Energy is the largest single cost line in a chemical plant — up to 40% of operating expense before a single tonne is sold — and it is also the largest single source of the emissions the plant now has to report. CSRD, the SEC climate rule, ISO 50001, and the new ISO 50100:2026 decarbonization standard have all converged on the same demand: track the energy precisely, link it to the emissions, and prove the reduction year over year. Plants that still manage energy off a monthly utility invoice and emissions off an annual spreadsheet end up paying twice — once at the meter and once at the audit. An iFactory energy and emissions module reads the meters and process signals already on the site, builds Scope 1 and Scope 2 inventories continuously, and writes the auditable record both standards now require.
iFactory Energy & Emissions for Chemicals
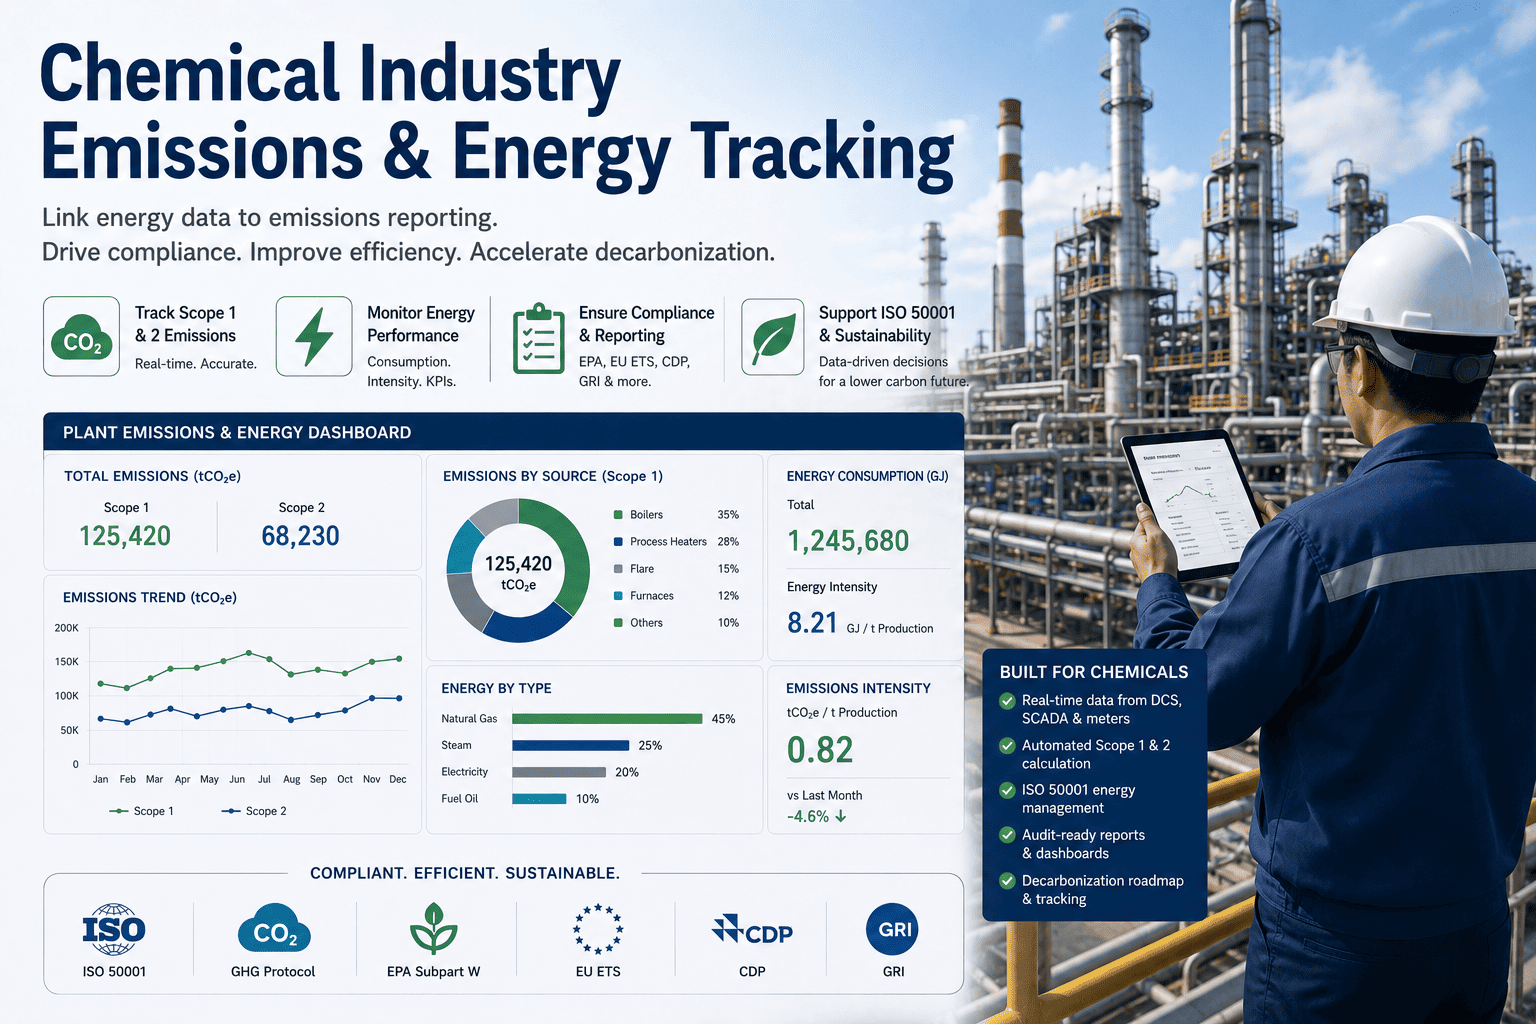
Chemical Industry Emissions & Energy Tracking
Energy is up to 40% of operating cost and the largest source of Scope 1 and Scope 2 emissions. ISO 50001 cuts energy use by 12% in fifteen months on average. iFactory connects the meter to the emissions report so the savings show up in both places — and the audit packet writes itself.
~40%
energy share of operating cost
12%
energy cut, 15 months (DOE avg)
3-5%
world-class annual carbon cut
ISO 50100
new 2026 decarbonization standard
Energy Is the Bill. Emissions Are the Audit.
For decades, chemical plants treated energy as a cost line and emissions as a separate compliance task — different teams, different spreadsheets, different reporting cycles. The new ISO 50100:2026 standard, the EU Corporate Sustainability Reporting Directive, and the SEC climate disclosure rule have closed that gap permanently. The energy data is now the emissions data, and the audit looks at both together. Plants that haven't linked the two end up either reporting savings they can't trace, or carbon reductions they can't prove — both of which are findings, not wins.
Where Scope 1 and Scope 2 Come From in a Chemical Plant
Scope 1 covers everything the plant burns or releases directly from owned sources. Scope 2 covers the energy bought from the grid, the steam main, or a neighboring industrial supplier. The pair is the mandatory minimum perimeter under ISO 50100, and for almost every chemical plant the two scopes together account for the great majority of the corporate footprint. The breakdown below is where most chemical plants find their emissions actually live.
Scope 1
Direct Emissions
What the plant burns or emits from owned sources, including process chemistry itself.
Stationary Combustion
Boilers, fired heaters, furnaces, reformers — burning natural gas, fuel oil, refinery gas, biomass. Usually the largest single Scope 1 line on a chemical site.
Process Emissions
CO2 released by the chemistry itself — steam methane reforming for hydrogen, ammonia synthesis, calcination, oxidation reactions. Cannot be reduced by efficiency alone.
Fugitive Emissions
Refrigerant leaks, methane and VOC losses from flanges and seals, blowdowns, flaring. Small lines individually, meaningful in aggregate, hard to instrument.
Mobile Combustion
Site trucks, forklifts, mobile generators, internal logistics fleet. Smaller than the above three but mandatory to count under ISO 50100.
Scope 2
Indirect from Purchased Energy
Energy bought from a utility, a steam supplier, or a district heating network. Mandatory perimeter; compressed air is not included.
Purchased Electricity
Grid power. Two calculation approaches: location-based (average grid factor) or market-based (low-carbon supply contracts). The choice shapes both the number and the reduction strategy.
Purchased Steam
District steam, neighboring industrial supplier, third-party utility. Carries the emission factor of whatever is producing the steam — often very different from the grid average.
Purchased Heat or Cold
District heating, chilled water imports, refrigeration supplied by a third party. Smaller for most chemical plants, but mandatory to track and report.
Why You Can't Track One Without the Other
Every kWh consumed is also a kilogram of CO2 equivalent. Every cubic foot of gas burned is a known emission factor times its lower heating value. Plants that track energy separately from emissions end up with savings projects that can't be tied to carbon reductions, and carbon reductions they can't trace back to specific operational actions. The audit asks for both, the regulators expect the linkage, and the corporate ESG team needs the numbers to reconcile. The link has to live in the same system, with the same time stamps, on the same record.
Want your plant's energy meters mapped to a live emissions inventory? Talk to our energy team and we'll scope it against the meters you already have.
A Pragmatic Decarbonization Roadmap
Net zero by 2050 is the headline. The roadmap that gets a chemical plant there is four phases, each with its own measurable target and its own set of operational moves. The pattern below reflects what's reachable with current technology — and what each phase needs from the energy and emissions data layer to stay credible.
2026
Baseline
Measure & Establish
ISO 50001 EnMS stood up
Scope 1 + 2 inventory live
EnPIs and SEUs defined
Audit-ready data layer
2030
~30%
Efficiency & Clean Power
Heat integration upgrades
Low-carbon PPA contracts
Steam & pump optimization
3-5% annual reduction cadence
2040
~60-70%
Electrify & Switch Fuels
Process electrification
Green hydrogen for high-temp heat
Heat pumps for low-temp duty
CCS pilots on flue gas
2050
Net Zero
Residual Capture & Feedstocks
Full CCS coverage on Scope 1
Low-carbon or recycled feedstocks
100% low-carbon Scope 2
Verified offsets for residuals
ISO 50001 in Practice — Plan, Do, Check, Act
ISO 50001 is the operating manual for getting from a baseline to a credible annual reduction. The standard is built on the Plan-Do-Check-Act cycle borrowed from ISO 9001 and ISO 14001, which means it slots into existing management systems instead of replacing them. The cycle repeats annually, and the data layer underneath it is what gets audited.
Plan
Baseline & Targets
Energy review, baseline establishment, identification of Significant Energy Uses (SEUs), Energy Performance Indicators (EnPIs), action plan with measurable targets.
Do
Implement Controls
Operational controls on SEUs, staff training, communication, documented procedures, quick-win projects that demonstrate value early and fund the rest of the program.
Check
Measure & Verify
Energy performance against baseline, EnPI tracking, internal audits, monitoring of legal and other requirements. The data layer is what makes the check defensible.
Act
Improve & Repeat
Management review, corrective actions, continual improvement of both the energy performance and the management system itself. Cycle restarts annually.
Want a thirty-day ISO 50001 readiness assessment on your site? Book a demo and we'll review your meters, your SEUs, and your reporting gap.
Where Chemical Plant Tracking Programs Fall Short
Most chemical plants have some energy tracking and some emissions reporting — but the two rarely talk, and the audit catches the gap. Five patterns show up in nearly every site that hasn't built a unified data layer. The structured-program version of each is what auditors expect, regulators reward, and ESG teams need to defend the numbers in front of investors.
Spreadsheet program
Where Audits Fail
Energy reported off monthly utility invoices, emissions off annual rollups
Scope 1 process emissions estimated, never instrumented
Fugitives counted once a year using factor tables, not continuously
Location-based vs market-based Scope 2 choice not documented
Audit packet assembled manually in the weeks before the assessor arrives
Linked data layer
What Auditors Reward
Energy and emissions on the same time-stamped record, refreshed live
Scope 1 process emissions calculated from process flows, not estimated
Fugitive leak detection feeding the inventory continuously
Both Scope 2 methods reported with the chosen one clearly justified
Audit packet generated on demand, current as of the most recent meter read
Standing It Up — A Practical Roadmap
The data layer that links energy to emissions is rarely a greenfield project. Most chemical plants already have meters, a historian, and some form of emissions register — they need them connected, not replaced. Four steps cover the practical stand-up on almost every site.
1
Connect the Meters You Already Have
Electric submeters, gas meters, steam meters, fuel oil flow. Read-only OPC and Modbus into the historian. No new instrumentation for the first cut — the gap is usually in the data layer above, not the meters.
2
Build the Scope 1 & 2 Inventory
Map every meter and process flow to its emission factor. Calculate Scope 2 both location-based and market-based and document the choice. Produce a live, time-stamped inventory that refreshes with every meter read.
3
Stand Up the ISO 50001 Frame
Identify SEUs, set EnPIs, define the baseline period, document the management review cadence. The PDCA cycle starts running. Audit-ready documentation lives in the same system as the live data.
4
Wire It to the ESG Report
CSRD, SEC, CDP, GHG Protocol. The same live data feeds every disclosure framework instead of three separate manual reconciliations. The audit packet generates itself, current to the last meter read.
Want this four-step plan scoped against your meters and your reporting deadlines? Talk to a specialist and we'll lay it out site by site.
Frequently Asked Questions
How is ISO 50100:2026 different from ISO 50001?
ISO 50001 is the energy management system standard — it covers how to set baselines, identify Significant Energy Uses, run the Plan-Do-Check-Act cycle, and improve energy performance. ISO 50100:2026, released this year, is a decarbonization-focused overlay that adds explicit absolute reduction targets for Scope 1 and Scope 2 emissions, with mandatory reporting of those targets and the trajectory against them. It complements ISO 50001 rather than replacing it.
Why does Scope 2 have two calculation methods?
Location-based uses the average emission factor of the grid the plant sits on. Market-based uses the emission factor of the specific power supply the plant has contracted for — a renewable PPA, a low-carbon tariff, a guarantee-of-origin certificate. The two often produce very different numbers. The GHG Protocol requires reporting both, and ISO 50100 expects the chosen one to be documented and justified. Picking one without disclosing the other is a common audit finding.
What's a realistic annual carbon reduction target?
Three to five percent per year is the world-class operational benchmark — achievable through structured efficiency, heat integration, and progressive switching to low-carbon energy supply. Larger reductions in early years are common as the easier savings get harvested first. Larger reductions later usually require capital projects: electrification, green hydrogen, or CCS. The roadmap on this page shows the typical phasing.
Do we need new sensors, or can we use the meters we already have?
Almost always existing meters for the first cut. Most chemical plants already have electric submetering, gas flows, and steam metering on the major energy users — what's usually missing is the calculation layer that turns those readings into a live Scope 1 and Scope 2 inventory. Additional instrumentation is added later, targeted at the specific blind spots the initial inventory reveals.
Where should a plant just starting out actually begin?
Pick the site with the highest energy intensity — usually the one with the largest fired heaters or the most steam consumption. Connect every meter on that site to a single data layer, build the Scope 1 and Scope 2 inventory live, and run it for a quarter alongside the existing monthly reporting. The gap between the two almost always tells the team exactly where the program needs to focus next, and the first site becomes the template for the rest of the portfolio.
Track the energy. Prove the reduction.
See Your Plant's Energy and Emissions on One Live Record
Bring one site — the one with the largest fired heaters or the biggest steam load. We'll connect the meters already on it, build a live Scope 1 and Scope 2 inventory against the right emission factors, stand it up against the ISO 50001 frame, and show you what your CSRD or SEC disclosure looks like when it generates itself from the same data instead of getting reconciled by hand the week before it's due.
Existing
meters, no new instrumentation
Live
Scope 1 + 2 inventory
ISO
50001 + 50100 aligned
One
record, every disclosure