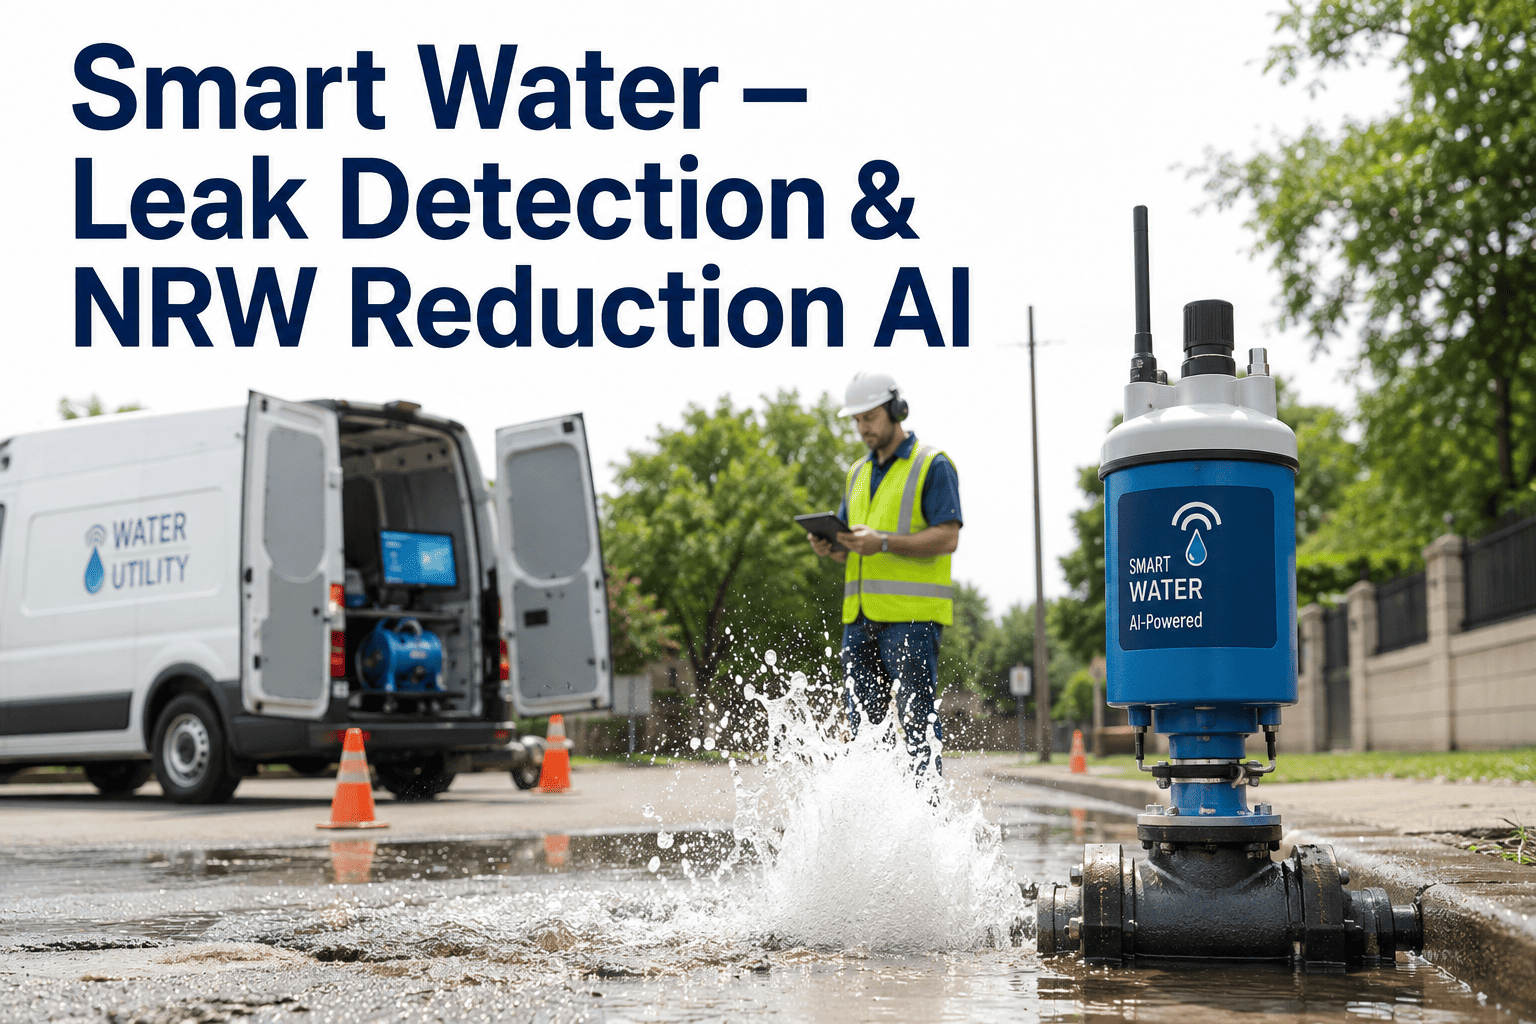
Every gallon lost to a leak somewhere in your distribution network is a gallon that was already pumped, treated, chemically dosed, and tested before it disappeared into the ground without generating a cent of revenue. Non-revenue water is not a minor accounting line, it is treated water walking out the back door of a utility that paid full price to produce it. Ageing pipe networks, rising demand, and tightening capital budgets have made this one of the most pressing challenges water utilities face heading into the second half of 2026, and the utilities closing the gap fastest are the ones replacing manual leak surveys with continuous, AI-driven detection across the whole network.
Find the Leak Before It Becomes a Burst
iFactory combines DMA night-flow analysis, acoustic correlation, and pressure management into one continuous detection layer, cutting non-revenue water and prioritizing pipe repairs before a slow leak turns into an emergency excavation.
Where Your Non-Revenue Water Is Actually Going
Real losses — physical leaks and bursts from ageing pipe joints, fittings, and mains
Apparent losses — meter inaccuracy, tampering, and unbilled authorized use
Billed revenue water — the share of production that actually reaches paying customers
Four Detection Methods, Working at Different Scales
DMA Night-Flow Analysis
Minimum night flow from AMI data flags which district metered area developed a new leak overnight, before a single truck rolls.
Acoustic Correlation
Sensors on hydrants and valves listen for the acoustic signature of pressurized water escaping, locating leaks within one to three meters.
Pressure Management
Reducing pressure in over-served zones cuts new break rates by 20 to 40 percent and slows existing leak flow, with no excavation required.
Apparent Loss Detection
Meter accuracy trending and tamper detection recover revenue that was quietly leaking out of the billing system, not the pipe.
Why Detection Speed Changes the Math
A 10 L/s burst isolated in 15 minutes loses roughly 9 cubic meters. The same burst caught after a 4-hour manual round loses 144 cubic meters, sixteen times more water from the exact same event.
See Your Network's Leak Risk Mapped in One Call
Bring your latest AWWA water audit and our team will show which zones would benefit most from continuous acoustic and pressure monitoring.
Manual Leak Survey vs. Continuous AI Detection
| Capability | Manual Survey Cycle | Continuous AI Detection |
|---|---|---|
| Detection frequency | Periodic sweeps, weeks apart | Continuous, nightly DMA analysis |
| Leak location accuracy | General zone estimate | Pinpointed within 1-3 meters |
| Pressure-driven breaks | Addressed reactively | Reduced proactively via PRV tuning |
| Repair prioritization | Based on complaint reports | Ranked by loss volume and risk |
| Regulatory water audit | Compiled manually each cycle | Generated automatically to AWWA M36 |
Frequently Asked Questions
Does this require replacing our existing meters or SCADA system?
No, the detection layer is built to operate from your existing AMI and SCADA infrastructure rather than requiring a network-wide meter replacement. DMA night-flow analysis uses the AMI data your utility already collects, and pressure management analytics pull from SCADA or dedicated pressure loggers you may already have deployed in key zones. Acoustic correlation sensors are the main new hardware added, typically mounted on hydrants and valves in priority zones rather than across the entire network at once. You can review what your current infrastructure already supports with our team through this booking link.
How much can pressure management realistically reduce our break rate?
Reducing minimum night pressure in zones currently operating above what's needed at the most critical demand point typically cuts new pipe break rates by 20 to 40 percent, based on published industry results across utilities that have implemented pressure zone optimization. This reduction happens without a single pipe repair, since it addresses the mechanical stress that causes new breaks in the first place, and it also slows the flow rate of leaks that already exist. Most utilities see this as the fastest first step because it uses infrastructure they already have installed.
What is the difference between real losses and apparent losses, and does this catch both?
Real losses are physical water lost through leaks, bursts, and background seepage from pipe joints, while apparent losses come from meter inaccuracy, unauthorized consumption, and data or billing errors that mean water was delivered but never billed. Both categories reduce revenue, but they require different detection methods, real losses need acoustic and flow-based detection while apparent losses need meter accuracy trending and consumption pattern analysis. A complete non-revenue water program addresses both simultaneously rather than treating leak detection as the whole picture.
How is a water audit report generated, and can it support grant or funding applications?
The system generates AWWA M36-format water loss audit data automatically from the same detection methods running continuously across your network, rather than requiring your team to manually compile flow, production, and billing data each reporting cycle. This standardized format is what most state funding programs and regulatory submissions require, so having it produced automatically removes a recurring administrative burden. For guidance on formatting a specific submission, reach out through our support page.
How quickly does a utility typically see measurable NRW reduction?
Pressure management adjustments often deliver measurable reduction within the first billing cycle since they don't require any physical repair to take effect. Acoustic detection and DMA-based leak identification build value as sensor coverage expands and baseline patterns are established, with most utilities reporting confirmed leak finds within the first month of deployment in priority zones. Full-network NRW reduction in the range utilities target typically compounds over the first six to twelve months as detection coverage and repair prioritization mature together.
Every Percentage Point of NRW Is Money Already Spent
Talk to our team about mapping detection coverage across your distribution network and recovering the water you've already paid to treat.