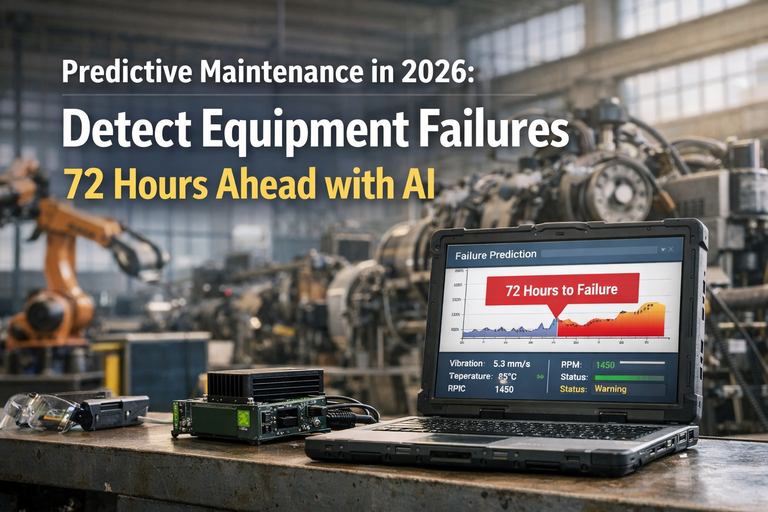
A bearing failure on a rolling stand rarely happens without warning, but the warning signs are usually buried in vibration data that nobody is watching until an alarm threshold is crossed, at which point the failure is often only hours away rather than weeks. Reactive maintenance on steel mill casting and rolling line assets means fixing equipment after it breaks, and time-based preventive maintenance means replacing parts on a fixed schedule whether they need it or not, both of which leave money on the table compared to knowing which specific asset is actually degrading right now. iFactory applies AI models to vibration, thermal, and motor current signals from casting and rolling line assets to predict failures 7 to 30 days ahead of when they would otherwise occur, giving maintenance teams enough lead time to plan a repair during scheduled downtime instead of scrambling during an unplanned stoppage. Mills running this approach on critical rolls, bearings, and drives are finding that the earlier warning changes maintenance from a reactive scramble into a planned activity, and iFactory support can help identify which assets to prioritize first.
AI Predictive Maintenance · Iron & Steel Mills
Predict Bearing, Roll, and Drive Failures 7 to 30 Days Before They Happen — Not After the Line Stops
Vibration, thermal, and motor current AI models continuously watch critical assets on casting and rolling lines, flagging developing degradation early enough for maintenance to plan around it instead of react to it.
Roll Bearing VibrationTrending Up
4.8 mm/s
Baseline 2.1 mm/s · Alert threshold 6.0
Drive Motor ThermalNormal
62°C
Within expected operating range
Predicted Failure Window18 Days Out
Stand 4 Bearing
Recommend inspection within 10 days
What Gets Monitored
Critical Casting and Rolling Line Assets Covered by Predictive Models
Different asset types fail in different ways, so a single vibration threshold applied uniformly across a plant misses failure modes that are specific to a given piece of equipment. iFactory builds separate degradation models per asset class, trained on that equipment's own operating history.
Roll Bearings
Vibration signature modeled against load and speed to catch early-stage bearing wear before it produces an audible or thermal symptom.
Drive Motors
Motor current signature analysis detects developing winding or coupling issues well before a thermal trip occurs.
Hydraulic Systems
Pressure and temperature trending on hydraulic units flags seal degradation and pump wear ahead of a functional failure.
Gearboxes
Vibration and thermal patterns specific to gear mesh wear are tracked separately from bearing-related signatures on the same shaft.
Degradation Timeline
How a Developing Failure Progresses From First Signal to Recommended Action
Day 0-7
A subtle deviation from the asset's own baseline vibration or thermal signature first appears, too small to trip a fixed alarm threshold but statistically significant against its own history.
Day 7-18
The deviation trends consistently rather than fluctuating randomly, and the model raises a developing-failure flag with an estimated window before functional failure.
Day 18-25
Maintenance planning schedules an inspection or repair during the next available planned downtime window, rather than waiting for an unplanned stoppage.
Day 25-30
Without intervention, the asset would typically reach functional failure in this window; with the early flag, the repair is already completed well before this point.
An Unplanned Stoppage Costs Far More Than the Part That Failed.
iFactory flags developing asset degradation weeks before functional failure, so the repair happens on your schedule, not the equipment's.
Reactive vs. Predictive
Reactive and Time-Based Maintenance vs. iFactory Predictive Maintenance
Function
Reactive / Time-Based Maintenance
iFactory Predictive Maintenance
Failure Warning
Discovered when equipment fails or an alarm threshold is already crossed
Flagged 7 to 30 days ahead based on the asset's own degradation trend
Parts Replacement
Replaced on a fixed schedule regardless of actual remaining life
Replaced when condition data shows genuine degradation, not before
Downtime Type
Unplanned stoppages disrupt production schedules with no notice
Repairs scheduled into existing planned downtime windows
Spare Parts Planning
Emergency orders at premium cost when a failure occurs unexpectedly
Parts ordered ahead of the predicted failure window at standard lead time
Maintenance Labor
Concentrated in emergency response and blanket preventive swaps
Focused on the specific assets showing genuine degradation signals
Measured Outcomes
What Maintenance Teams Report After Deploying Predictive Monitoring
7-30 Days
Typical Early Warning Window
Lead time between the first developing-failure flag and the point functional failure would otherwise occur.
25-40%
Reduction in Unplanned Downtime
Plants report meaningfully fewer unplanned stoppages once critical assets are under predictive monitoring.
10-20%
Fewer Unnecessary Part Swaps
Condition-based replacement reduces parts changed under a fixed schedule that still had useful life remaining.
4
Asset Classes Modeled Separately
Bearings, motors, hydraulics, and gearboxes each get degradation models tuned to their own failure modes.
10-14 Days
Typical Deployment Timeline
Time from sensor connection to a live predictive dashboard for assets with existing vibration or thermal sensing.
Planned
Repair Windows, Not Emergency Calls
Maintenance teams shift from responding to failures to scheduling repairs around production plans.
Field Case
Catching a Drive Motor Degradation Signature Three Weeks Before It Would Have Failed Mid-Shift
A rolling mill running a critical drive motor on a continuous three-shift schedule had no history of predictive failure alerts before deploying vibration and motor current monitoring on that asset. Within the first month of live monitoring, the system flagged a gradually developing current signature deviation consistent with early-stage bearing wear inside the motor housing, projecting a functional failure window roughly three weeks out if left unaddressed. Maintenance scheduled a motor inspection during the next planned weekend outage, confirmed visible bearing wear consistent with the model's flag, and replaced the bearing before it reached a point that would have caused an unplanned mid-shift stoppage on a line running near full order backlog.
3 WeeksLead time before predicted failure
1Planned outage used for repair
0Unplanned mid-shift stoppages
Frequently Asked Questions
Steel Mill Maintenance Teams Ask These Questions First
What sensors do we need already installed for predictive maintenance to work?
Most mills already have some combination of vibration probes, thermal sensors, and motor current monitoring on their most critical rolls, bearings, and drives, and iFactory is built to connect to that existing instrumentation first. Where a genuinely critical asset has no sensing at all, additional sensors can be added, but the fastest path to value is usually starting with assets that already have some monitoring in place.
Book a Demo to review what sensors your critical assets currently have.
How accurate is the 7 to 30 day prediction window in practice?
The prediction window is a range rather than a fixed date because failure progression varies by asset type, load conditions, and how early a deviation is first caught, and the model continues refining the estimate as more data accumulates after the initial flag. In practice, the value is less about pinpointing an exact failure date and more about giving maintenance planning enough lead time to schedule an inspection or repair before an unplanned stoppage occurs.
Will this replace our existing preventive maintenance schedule entirely?
Most plants transition gradually, keeping preventive maintenance as a baseline for lower-criticality equipment while shifting their highest-value assets to condition-based scheduling driven by predictive flags. Over time, as confidence in the models grows, more assets typically move from a fixed schedule to condition-based triggers, but this is usually a phased transition rather than a single cutover.
How does the system distinguish a genuine developing failure from normal operating variation?
Models are trained against each specific asset's own historical baseline rather than a generic industry threshold, which accounts for that asset's particular load pattern, age, and installation characteristics. A reading that fits within the asset's own normal variation range is not flagged, while a consistent trend away from that baseline, even if still below a fixed alarm threshold, is treated as a genuine developing signal worth investigating.
Contact support to review how baselines are established for your specific assets.
How long does it take to get a predictive dashboard live on our priority assets?
For assets with existing vibration, thermal, or current sensors and available data access, a live predictive dashboard typically takes 10 to 14 days from integration kickoff. Assets requiring new sensor installation generally extend the timeline to three to five weeks, depending on how many assets and sensor types are involved.
Book a Demo to get a scoped timeline for your priority asset list.
Know Which Asset Is Degrading Weeks Before It Fails, Not Minutes After.
Predictive maintenance for critical casting and rolling line assets, built on your existing sensors, live in as little as 10 days.