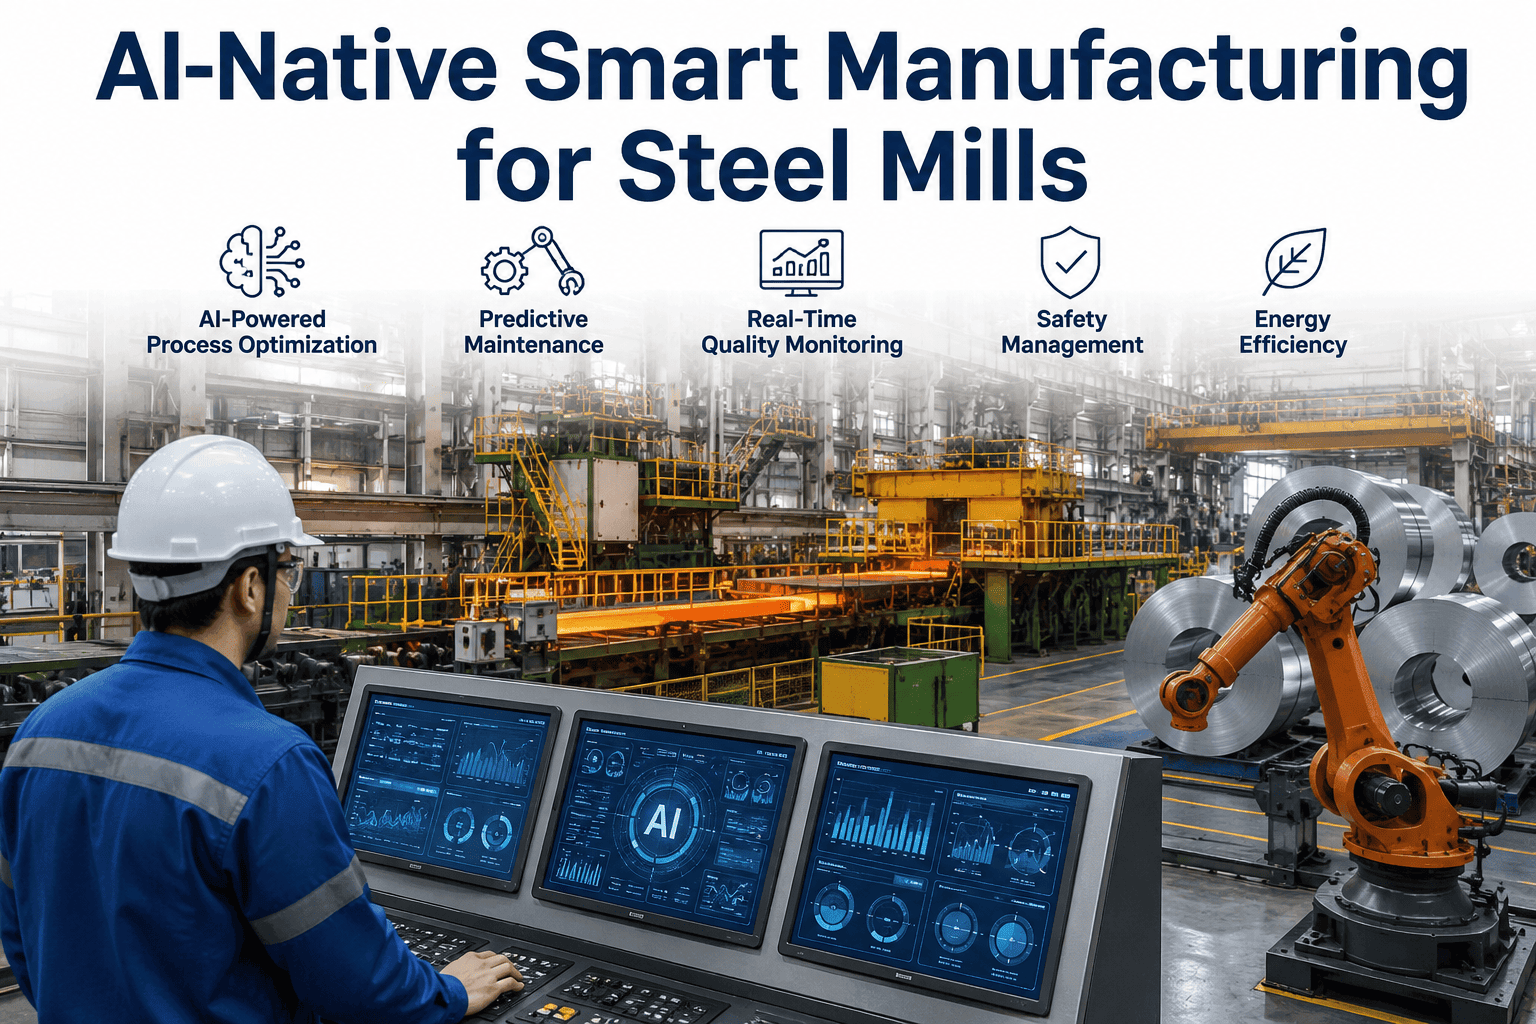
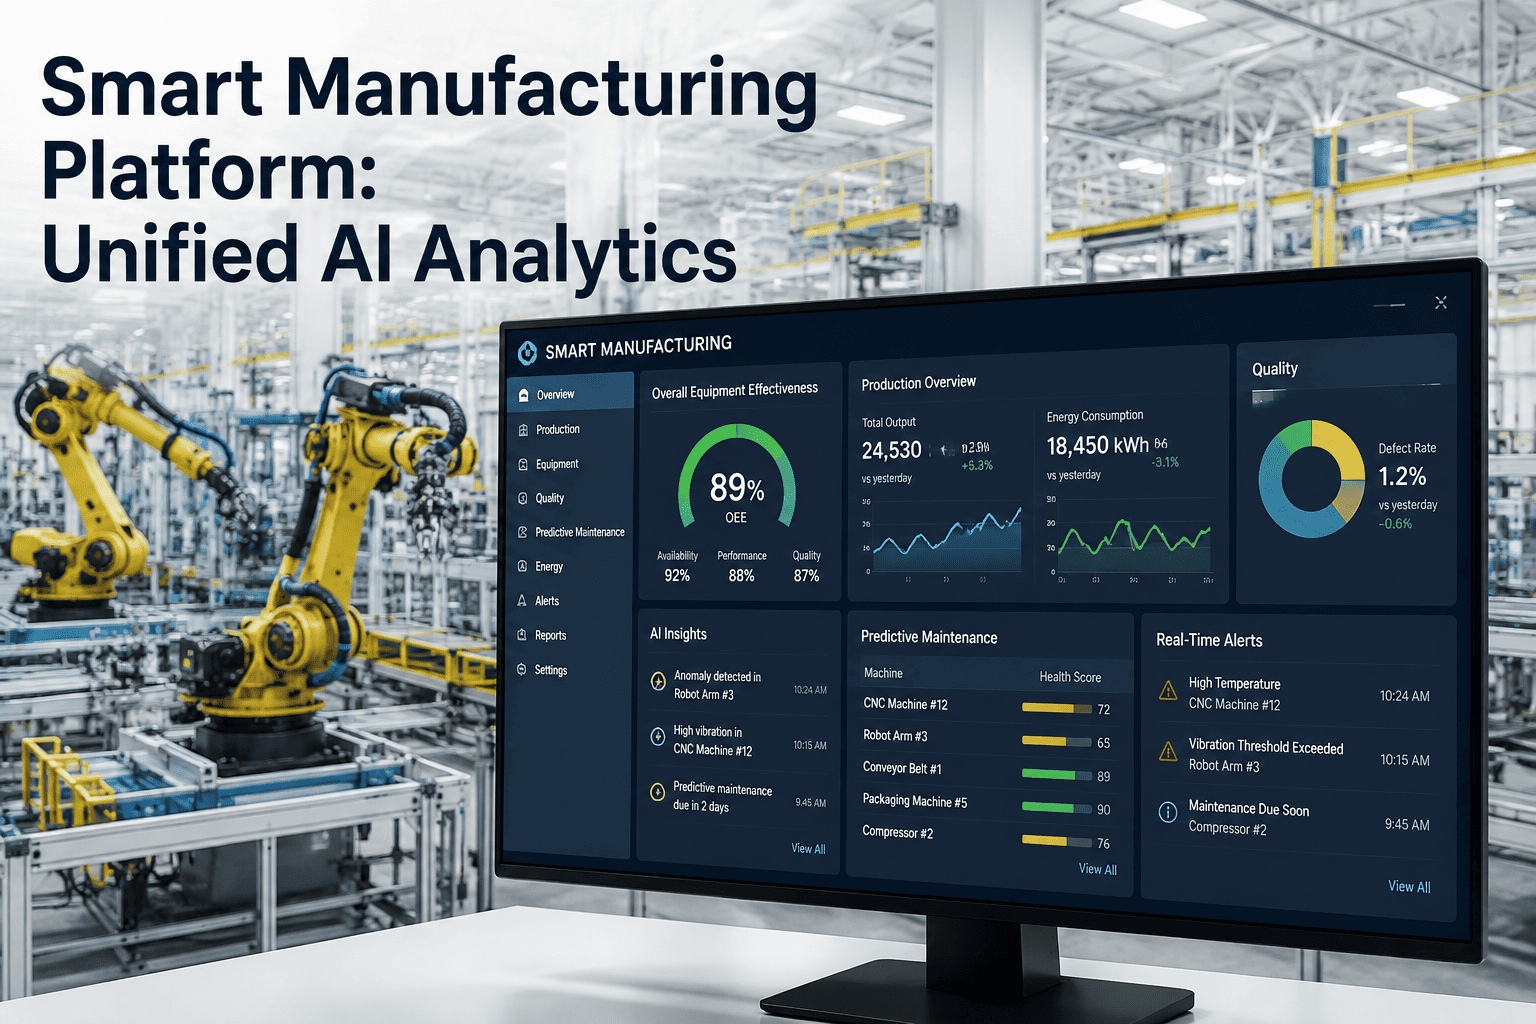
A steel mill running casting and rolling lines at full tilt generates more operational data in a single shift than most plants generate in a month, yet that data usually lives in five or six disconnected systems that were never designed to talk to each other. Vision cameras watching for surface defects sit in one silo, vibration sensors feeding a condition monitoring tool sit in another, and the MES tracking heats and coil IDs sits in a third, so a quality engineer chasing a scale defect has no easy way to check whether it correlates with a bearing temperature spike on the same stand thirty minutes earlier. iFactory was built specifically to close that gap for brownfield iron and steel mills, bringing vision-based defect detection, predictive maintenance, MES and MOM data, and energy monitoring onto a single AI-native platform that overlays existing casting and rolling line infrastructure without a rip-and-replace project. The result is a plant where a shift supervisor can see quality, reliability, and energy signals side by side instead of chasing three logins, and where iFactory support can walk a team through connecting their first line in the same week they request a demo.
Unified Factory AI · Iron & Steel Manufacturing
One AI Platform for Steel Mill Vision, Predictive Maintenance, MES, and Energy — Built for Brownfield Casting and Rolling Lines
Instead of running separate point tools for defect detection, asset health, production tracking, and energy use, iFactory unifies all four data streams on top of the sensors and control systems a mill already has installed, no line rebuild required.
4
Data Domains Unified on One Screen
10-14 Days
Typical First-Line Deployment
0
New Sensors Required to Start
Four Domains, One Platform
Why Steel Mills Need Vision, Reliability, Production, and Energy Data in the Same Place
A casting or rolling line failure is rarely caused by just one thing going wrong. A quality escape often traces back to a bearing running hot, a bearing running hot often traces back to a lubrication schedule slipping, and a slipping schedule often shows up first as an unexplained energy draw. Looking at any one of these domains alone means the root cause takes days to find instead of minutes.
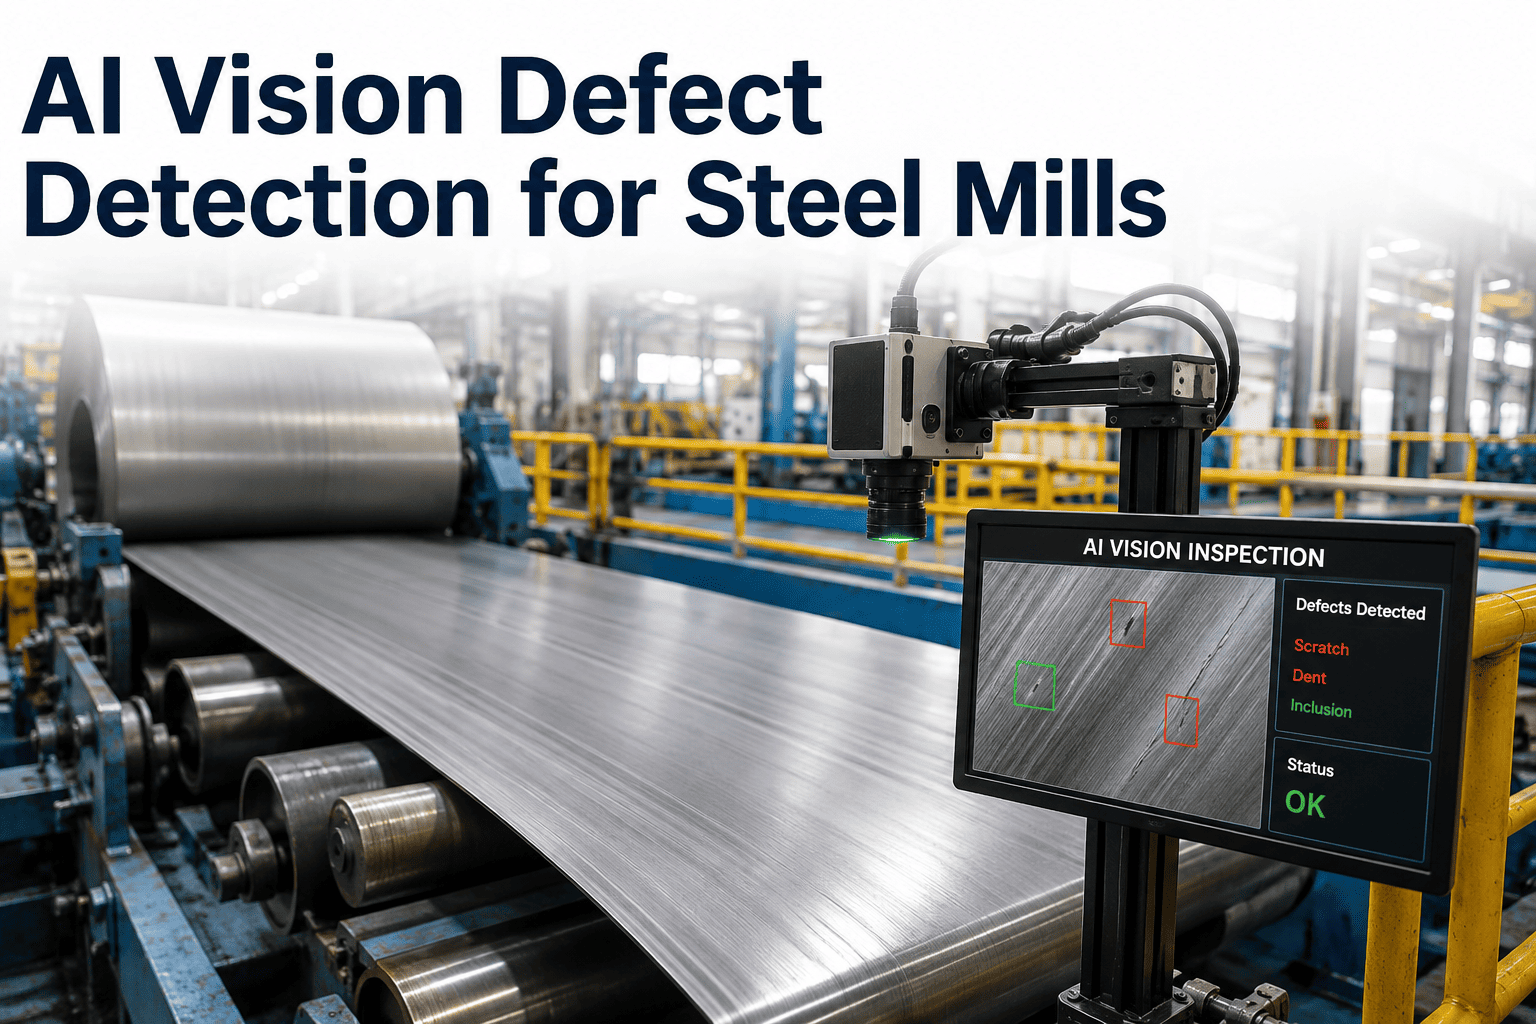
AI Vision Inspection
Edge GPU cameras inspect slabs, billets, and coils at line speed for surface cracks, scale, and rolled-in defects, tagging every flagged unit to its exact heat and stand.
Predictive Maintenance
Vibration, thermal, and motor current signals on rolls, bearings, and drives are modeled continuously to flag developing failures well before a breakdown.
MES / MOM Integration
Heat numbers, coil genealogy, shift schedules, and order data are pulled from existing MES and MOM systems so every reading has full production context attached.
Energy Monitoring
Furnace, motor, and compressed air load is tracked per line and per shift, surfacing waste that would otherwise be buried in a monthly utility bill.
How It Connects
From Existing Line Sensors to a Single Control Room View
1
Connect Existing Sensors
Cameras, PLC tags, vibration probes, and energy meters already on the casting and rolling lines are connected through standard industrial protocols, no new hardware mandated to begin.
2
Normalize and Contextualize
Raw signals are matched against heat IDs, coil genealogy, and shift schedules pulled from the MES, so every data point carries full production context automatically.
3
Model and Score
Vision models score defects, reliability models score asset health, and energy models score consumption against baseline, all on the same time axis.
4
Unified Control Room View
Operators, quality engineers, and maintenance planners see one dashboard instead of four logins, with alerts routed to whoever owns the underlying issue.
Running Vision, Maintenance, MES, and Energy as Four Separate Tools Means Four Separate Blind Spots.
iFactory brings them together on your existing casting and rolling line hardware, so one platform shows the full picture your teams have been piecing together manually.
Point Tools vs. Unified Platform
Separate Systems vs. iFactory for Steel Mill Operations
Capability
Separate Point Tools
iFactory Unified Platform
Root Cause Speed
Requires manually cross-referencing logs from separate vision, maintenance, and MES systems
Defect, asset, and production data correlated automatically on one timeline
Deployment Footprint
Each new tool often needs its own sensors, network, and vendor integration project
Built on top of existing line sensors and control systems already in place
Operator Experience
Different logins and dashboards for quality, maintenance, and energy teams
One control room view shared across quality, maintenance, and operations
Data Silos
Each system stores its own history, making cross-domain trend analysis manual and slow
Shared data model links vision, vibration, MES, and energy readings by heat and time
Time to First Value
Multiple vendor projects, each with its own onboarding and integration timeline
First line typically live within 10 to 14 days on existing infrastructure
What Mills Report
Measured Outcomes After Unifying Vision, Maintenance, MES, and Energy Data
30-45%
Faster Root Cause Investigation
Quality and maintenance teams report cutting investigation time substantially once vision, vibration, and production data sit in one place.
2-4
Separate Logins Eliminated per Shift
Operators move from checking multiple systems each shift to one unified control room dashboard.
7-30 Days
Early Warning on Developing Failures
Predictive models on rolls and drives typically surface a developing issue well ahead of a breakdown.
10-15%
Energy Waste Identified
Per-line energy baselines commonly reveal avoidable consumption that a monthly bill never isolates.
10-14 Days
Typical First-Line Deployment
Time from kickoff to a live unified dashboard for a line with existing sensors and PLC access.
1
Dashboard Replacing Several Tools
Vision, reliability, MES, and energy views consolidated into a single interface for plant leadership.
Field Case
Tracing a Recurring Scale Defect Back to a Bearing Nobody Was Watching
A hot strip mill had been logging an intermittent scale defect on one rolling stand for months, with the quality team unable to pin the cause to a specific shift, operator, or material grade. After connecting the stand's existing vibration probe and vision camera to iFactory, the platform surfaced a pattern the separate systems had never revealed on their own: every flagged coil correlated with a small vibration signature increase on one backup roll bearing, always appearing about ninety minutes into a run. Maintenance had been monitoring that bearing on a fixed inspection schedule that did not align with when the signature actually developed. The bearing was swapped ahead of its scheduled replacement, and the defect pattern stopped appearing on subsequent runs.
MonthsUnresolved before unified correlation
90 minConsistent onset window identified
1Bearing confirmed as root cause
Frequently Asked Questions
Steel Mill Leaders Ask These Questions First
Do we need to install new sensors before we can start?
Most mills already have cameras on line, PLC tags on drives, and at least basic vibration or thermal monitoring on critical rolls, and iFactory is designed to connect to that existing instrumentation first rather than requiring a new hardware layer before anything can go live. Where a gap exists, such as a stand with no vibration sensing at all, additional sensors can be added incrementally without holding up the rest of the deployment.
Book a Demo to review what your current line already has in place.
How does this integrate with our existing MES or MOM system?
iFactory connects to MES and MOM systems through standard integration methods to pull heat numbers, coil genealogy, order data, and shift schedules, so every vision, vibration, or energy reading automatically inherits the correct production context. This is a read-oriented integration in most deployments, meaning the existing MES continues operating as the system of record for production transactions while iFactory adds the analytical layer on top.
Can we start with just one line or one domain, like vision alone?
Yes, many mills start with a single high-priority line and a single domain, most often vision inspection or predictive maintenance, before expanding to additional lines and data types. This phased approach lets a team validate accuracy and workflow fit on one line before the same configuration is extended plant-wide, which also keeps the initial deployment timeline short.
Who is expected to act on the alerts the platform generates?
Alert routing is configured per plant, so a vision-flagged surface defect can route to the quality team while a developing bearing signature routes to maintenance planning, all from the same underlying event. Plant leadership typically gets a consolidated view across all domains, while frontline teams see only the alerts relevant to their role, reducing alert fatigue.
Contact support to discuss alert routing for your organizational structure.
What does a typical deployment timeline look like for a full line?
For a line with existing vision and vibration sensors and available PLC and MES access, a unified dashboard covering all four domains typically takes 10 to 14 days from integration kickoff to live monitoring. Lines requiring additional sensor installation or more complex MES integration generally extend to four to six weeks, depending on scope.
Book a Demo to get a scoped timeline for your specific line configuration.
See Vision, Maintenance, MES, and Energy Data on One Screen for Your Own Line.
A unified control room view for casting and rolling lines, built on the sensors your mill already has, live in as little as 10 days.