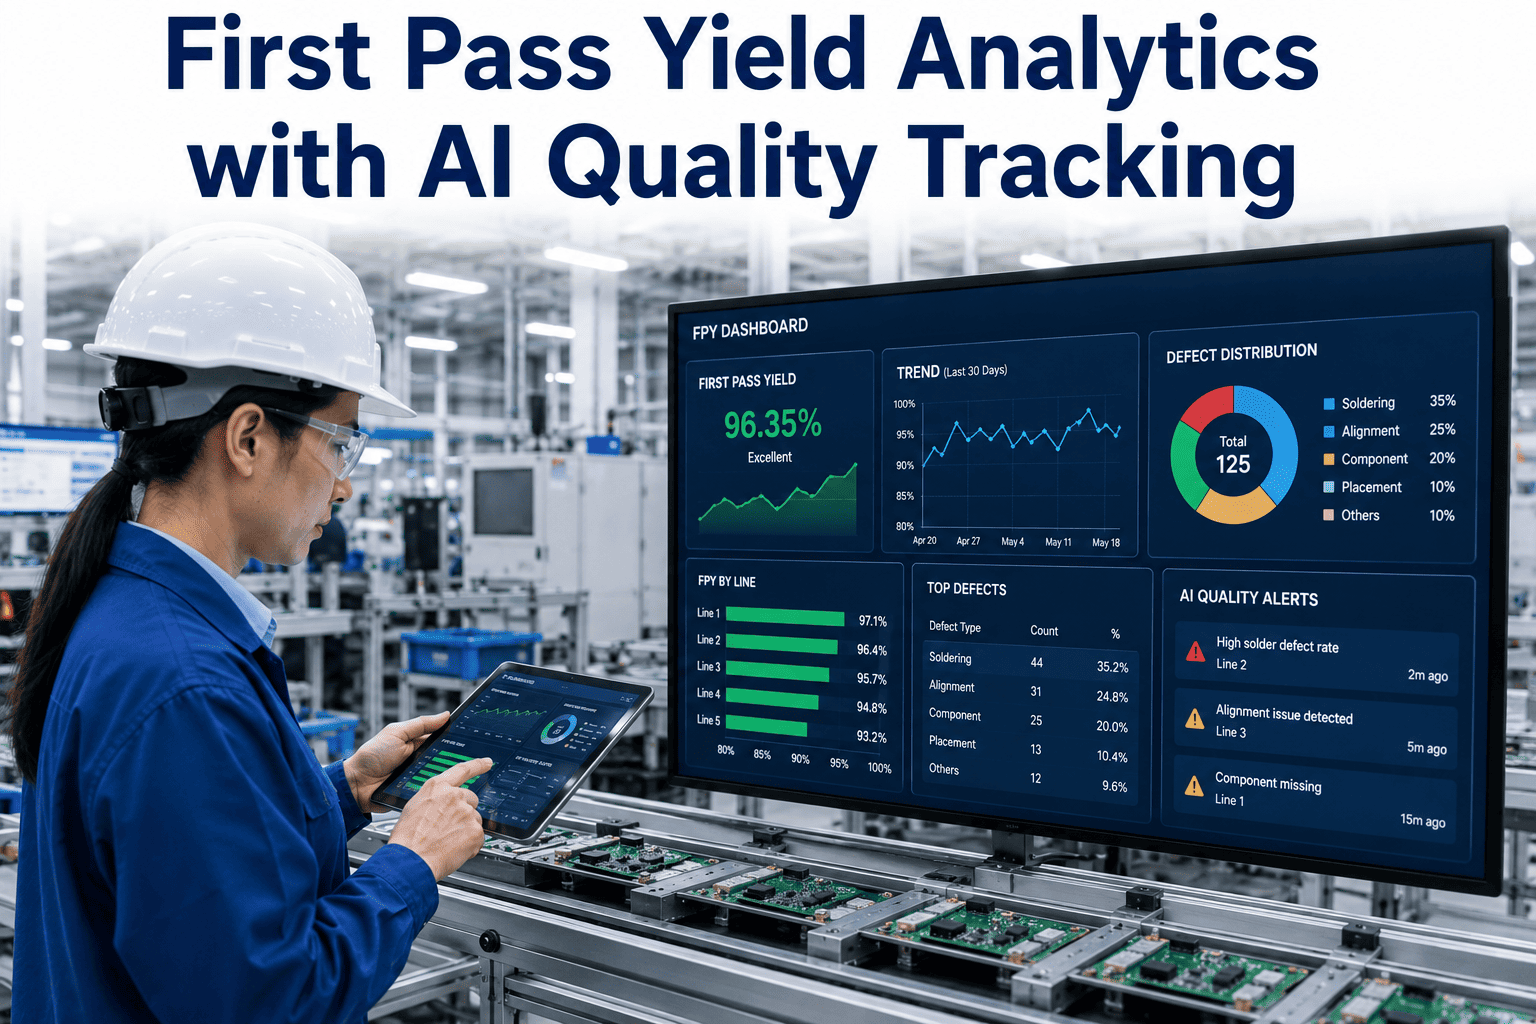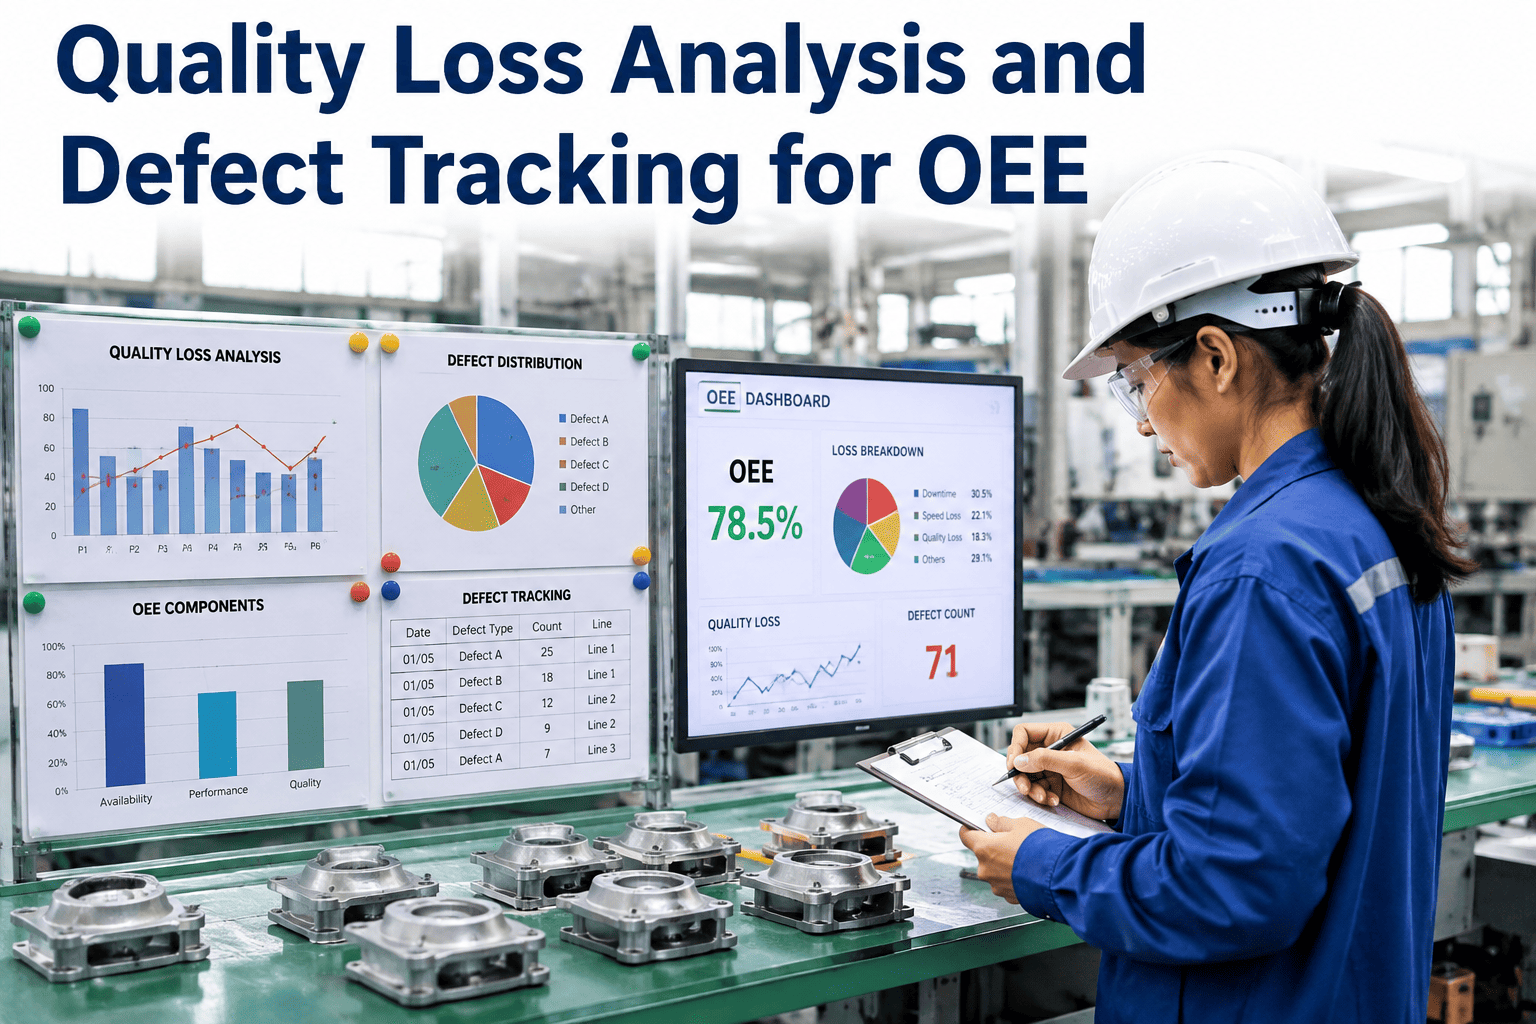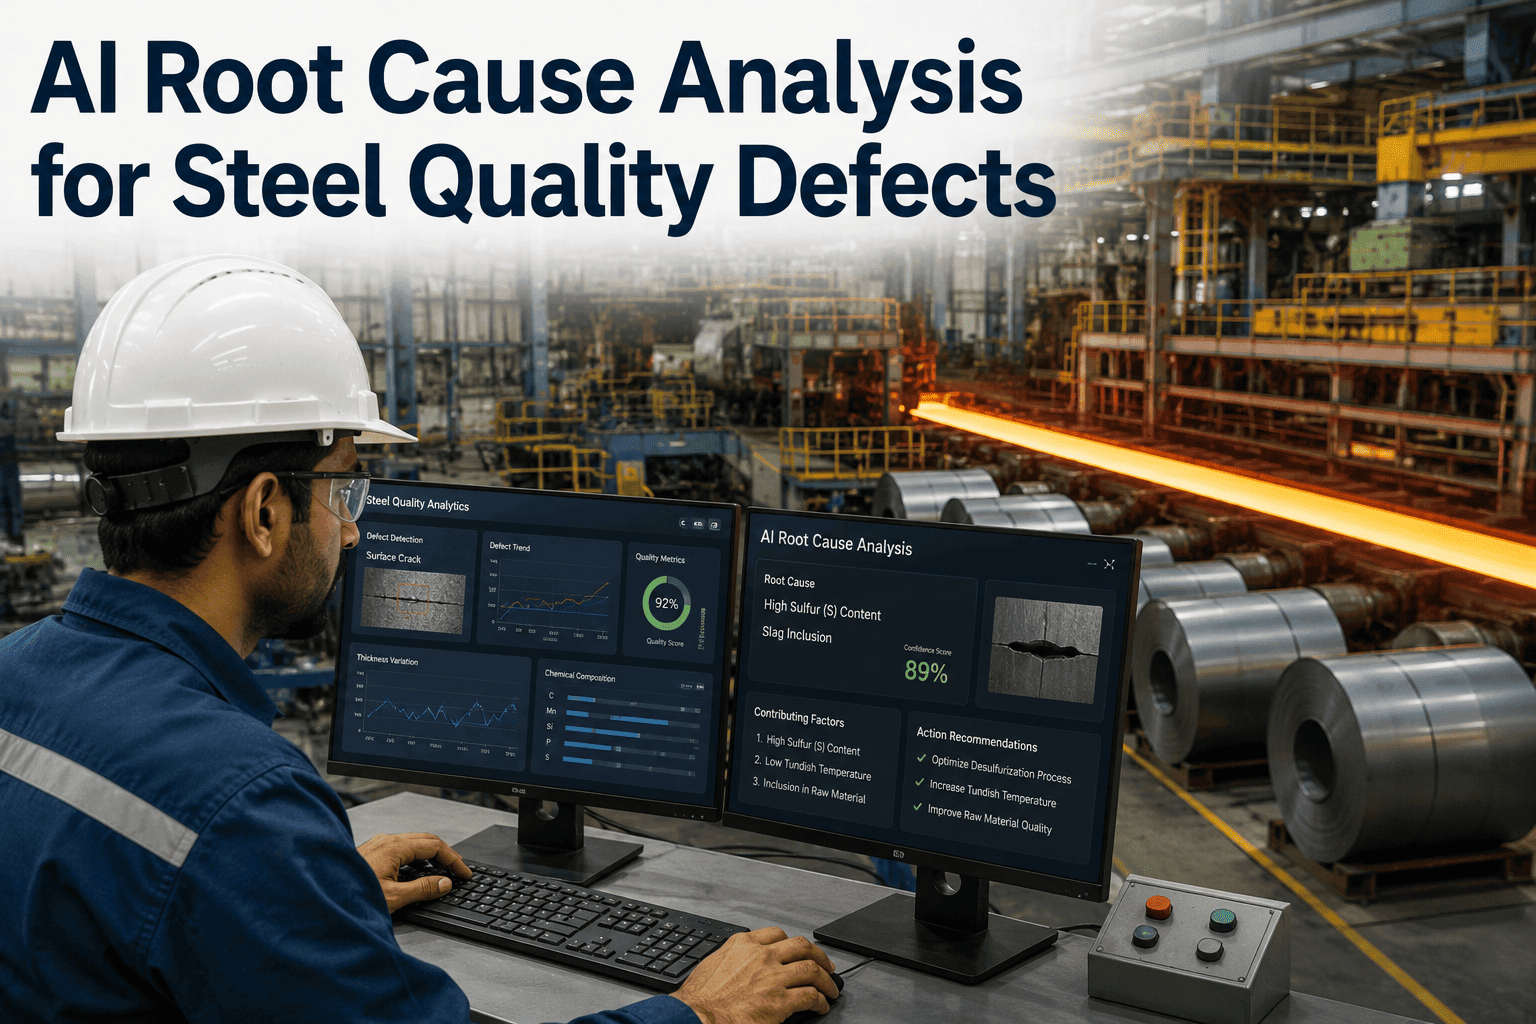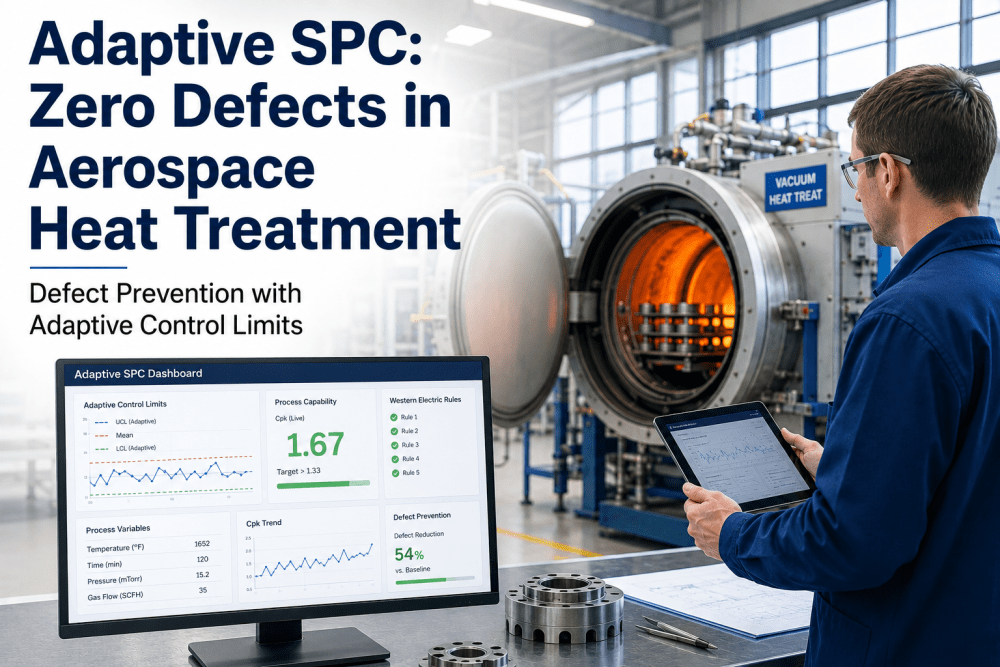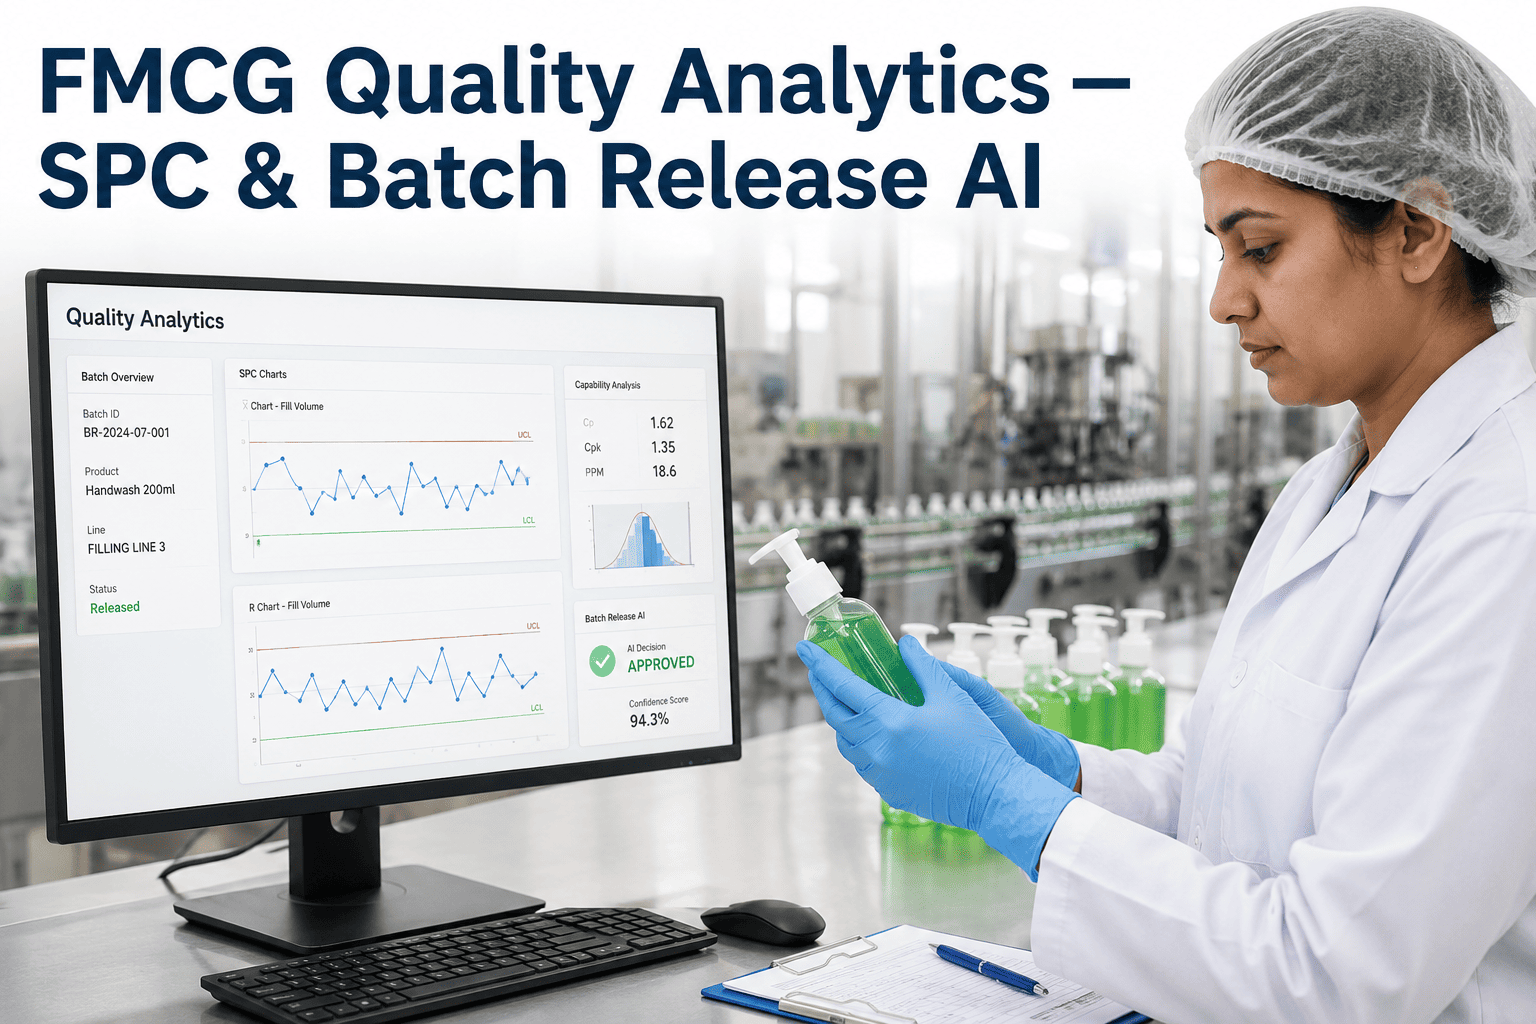
A batch release decision in FMCG manufacturing is really a race between two clocks — the quality team's confidence that a batch meets specification, and the commercial team's need to get product on the truck before the delivery window closes. When SPC data lives in a spreadsheet that updates once a shift, quality holds run long not because the batch is actually in doubt, but because nobody has assembled the evidence to release it faster. AI-driven quality analytics collapses that gap by keeping statistical process control, defect trending and specification data current in real time, and manufacturers who want to see the effect on their own hold times can book a demo against a recent production run.
Why Statistical Process Control Still Fails in Practice
Statistical process control has been standard practice in FMCG manufacturing for decades, yet most plants still run it as a compliance checkbox rather than a live decision tool. Control charts get plotted, control limits get calculated, and out-of-control points get circled — after the shift has ended and the product has already moved downstream. The value of SPC comes from catching a process shift while it's still correctable, not from documenting it after the fact. AI-based SPC monitoring flags out-of-control conditions the moment they occur, giving line operators the chance to intervene before an entire batch drifts out of specification.
Defect Trending: Turning Isolated Complaints Into Early Warnings
A single consumer complaint rarely triggers action on its own — and that's exactly the problem. Defect trending analytics exists to catch the pattern a single complaint can't reveal: three complaints about the same defect type from three different regions in the same week is a signal, even if each complaint individually looked minor. Book a demo to see how iFactory correlates complaint data against batch and line history automatically.
Seal failures and fill-weight variance tracked against line speed and material lot to isolate root cause fast.
Taste, texture or appearance complaints cross-referenced against raw material batch and process parameters.
Early stability test deviations flagged before they become a shelf-life complaint months after shipment.
Supplier-level defect patterns tracked so a single bad lot doesn't propagate silently through multiple SKUs.
Batch Release Automation: What Changes When Data Is Already Assembled
Batch release automation does not mean removing human judgment from the release decision — it means the evidence quality reviewers need is already compiled and cross-checked by the time they sit down to review it. The comparison below shows how release workflows typically change once real-time SPC and specification monitoring are in place.
| Release Workflow Element | Manual Process | AI-Assisted Process | Typical Time Saved |
|---|---|---|---|
| SPC data compilation | Manual chart review, end of shift | Continuous, flagged automatically | 30–45 min/batch |
| Specification cross-check | Manual comparison against spec sheet | Automated pass/fail scoring | 15–25 min/batch |
| Deviation investigation | Retrospective root-cause search | Pre-linked to process and material data | 1–3 hours/deviation |
| Release documentation | Manual report assembly | Auto-generated from live data | 20–30 min/batch |
Benchmarking Your Quality Program Against FMCG Industry Norms
FMCG quality benchmarking only works if you're comparing against numbers grounded in actual industry performance rather than internal targets set years ago. The figures below reflect what mid-to-large scale FMCG manufacturers typically achieve once real-time quality analytics replace manual, end-of-shift review processes.
Quality Cost Tracking: Making the Cost of Poor Quality Visible
Quality cost tracking is frequently the missing link between the quality department and the finance department — most FMCG plants can report defect rates but struggle to translate them into a dollar figure that justifies further investment in quality systems. A structured quality cost model separates prevention cost, appraisal cost, and failure cost, then ties each back to specific product lines and defect categories. This reframing consistently shifts internal conversations, because a recurring $40,000-a-month failure cost on a single SKU is a far more persuasive argument for process investment than a defect rate percentage alone.
Frequently Asked Questions: FMCG Quality Analytics and Batch Release
How does real-time SPC monitoring reduce quality hold time?
Real-time SPC flags out-of-control points the moment they occur rather than at end-of-shift review, so deviations get investigated while the batch is still in process instead of after it has already moved into hold status. Book a demo to see the hold-time impact modeled against your own production data.
What is defect trending and how is it different from standard QA reporting?
Standard QA reporting documents individual defects and complaints as they occur. Defect trending correlates them across batches, lines and time periods to reveal patterns that no single complaint would surface on its own, catching systemic issues earlier.
Does batch release automation reduce the quality team's decision authority?
No — automation compiles and cross-checks the evidence needed for a release decision, but the release decision itself remains with the quality reviewer. The goal is faster access to complete data, not removing human judgment from the process.
How is quality cost tracking calculated across prevention, appraisal and failure costs?
Prevention costs cover process control and training, appraisal costs cover inspection and testing, and failure costs cover rework, recalls and complaints. Tracking all three together, tied to specific SKUs, shows where quality investment produces the clearest financial return.
Can this kind of quality analytics integrate with existing LIMS and MES systems?
Yes — most quality analytics platforms are designed to pull from existing laboratory information management systems and manufacturing execution systems rather than replacing them. Talk to support about your current LIMS/MES setup to confirm integration paths.