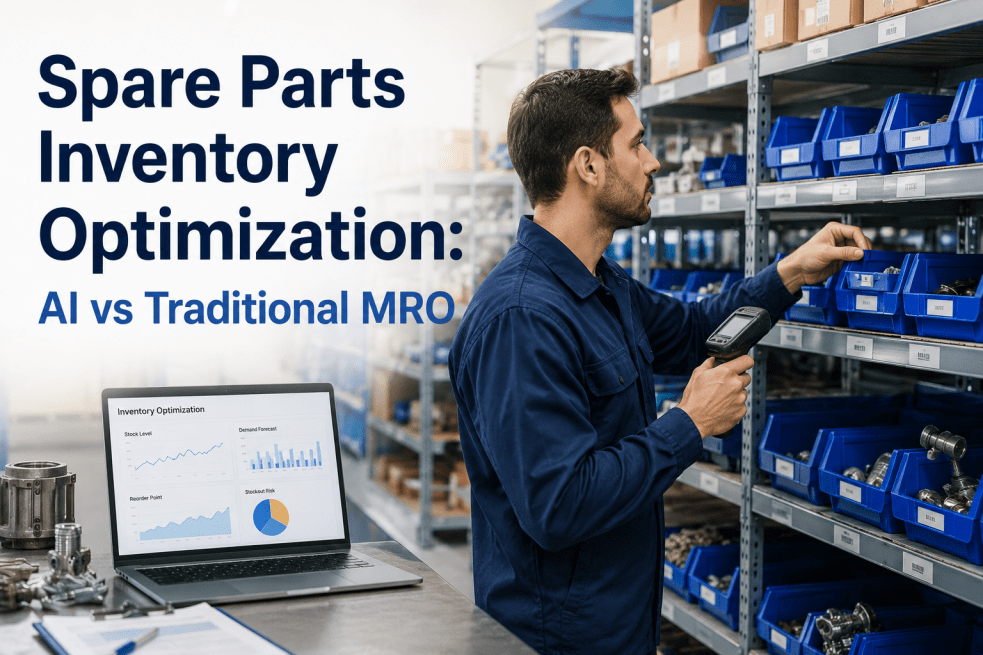
For decades, spare parts inventory at manufacturing facilities has been managed using a combination of historical consumption data, vendor lead time estimates, and the institutional knowledge of warehouse coordinators who have spent years learning which parts move, which parts sit, and which parts the plant cannot afford to be without. This traditional MRO inventory model — built on reorder points calculated from past usage, safety stock buffers sized to vendor lead time variability, and ABC classification based on annual spend — has served manufacturing operations adequately when the underlying conditions remained stable. But manufacturing conditions are no longer stable. Equipment portfolios are aging, supply chains have become more volatile, lead times for industrial components have stretched from weeks to months on certain categories, and the cost of carrying obsolete or slow-moving inventory has become a measurable drag on working capital efficiency. AI-driven spare parts inventory optimization addresses these realities by analyzing equipment condition data, maintenance work order history, supplier performance trends, and consumption patterns simultaneously — generating reorder recommendations, stock level adjustments, and obsolescence flags that reflect the actual operational risk profile of each part rather than the historical averages that drive traditional reorder point calculations. For U.S. manufacturing maintenance and supply chain leaders evaluating whether to continue investing in their existing MRO inventory management approach or transition to an AI-driven model, the question is not whether AI capabilities exist — they do, and they are increasingly accessible. The question is how the AI-driven approach compares to traditional MRO methods on the specific dimensions that matter to a manufacturing operation: stockout prevention, working capital reduction, obsolescence management, and the operational integration between inventory data and maintenance planning. This guide examines that comparison in detail and shows how iFactory AI's integrated CMMS and EAM platform delivers the inventory optimization outcomes that manufacturing operations need.
Ready to replace static reorder points with AI-driven inventory intelligence that reflects real equipment risk? Book a Demo with iFactory's MRO optimization team.
The Traditional MRO Inventory Model — Where It Came From and Where It Falls Short
Traditional MRO inventory management at U.S. manufacturing facilities was built around a set of calculations and classification methods that made sense in an operating environment where consumption was relatively predictable, vendor lead times were stable, and the cost of holding inventory was lower than the cost of computational analysis. The reorder point formula — average daily usage multiplied by lead time in days, plus a safety stock buffer — produced a single trigger value that warehouse staff could apply mechanically. The economic order quantity formula balanced ordering costs against carrying costs to produce a recommended order size. The ABC classification grouped parts by annual dollar consumption, directing management attention to the small percentage of parts that drove the majority of inventory spend. These methods were defensible, repeatable, and auditable. They produced inventory positions that could be explained to plant management and to auditors without requiring statistical sophistication or specialized software.
The breakdown points of this traditional model are not new — they were known to inventory practitioners for decades — but they have become more consequential as manufacturing operating conditions have shifted. The reorder point calculation assumes stationary demand: that future consumption will resemble past consumption. For equipment that is aging, that has been modified, or that operates under changing duty cycles, this assumption fails systematically. The lead time component of the formula assumes vendor delivery performance that is consistent with historical experience — an assumption that has been violated in nearly every supplier category since 2020. The safety stock calculation uses a service level target that is applied uniformly across the parts catalog, treating a low-cost bearing on a non-critical fan the same as a custom-machined component on the production line's bottleneck equipment. The result is an inventory position that is simultaneously over-invested in slow-moving items and under-invested in the parts that actually matter for production continuity.
Stationary Demand Assumption
Reorder points calculated from 12-month average consumption fail to detect emerging consumption shifts driven by equipment aging, duty cycle changes, or new failure modes that have not yet generated enough history to influence the average
Lead Time Volatility Blindness
Static safety stock buffers do not adjust to current supplier performance — when a vendor's actual lead time stretches from 6 weeks to 18 weeks, the reorder point continues triggering at the old level until someone manually intervenes
Spend-Based ABC Misclassification
ABC classification by annual dollar consumption ignores criticality — a $200 part that takes a $3M production line down is classified C while a $40K part used in routine preventive maintenance is classified A, inverting the actual operational risk hierarchy
Obsolescence Detection Lag
Traditional cycle counts identify physical inventory but not functional obsolescence — parts for retired equipment, superseded models, or discontinued process lines accumulate as carrying cost for years before manual review catches them
Disconnect from Maintenance Plans
Inventory triggers operate independently of upcoming maintenance schedules — parts needed for a planned overhaul next quarter are not pre-positioned, while parts on hand for equipment scheduled for replacement continue to be reordered
No Equipment Condition Signal
Even when condition monitoring identifies a developing failure on a specific asset, traditional inventory systems have no mechanism to pre-stage the spares needed for that repair — the inventory team learns about the requirement when the work order arrives
How AI-Driven Spare Parts Optimization Works Differently
AI-driven spare parts inventory optimization is not a replacement for the underlying inventory data — the part records, the stock counts, the vendor relationships, and the warehouse locations remain the operational foundation. What changes is the analytical layer that sits on top of this data and the decision logic that determines reorder timing, stocking levels, and obsolescence flags. Rather than applying a static formula to each part in isolation, the AI model continuously analyzes the relationships between parts, equipment, work orders, supplier performance, and operational conditions — producing recommendations that reflect the integrated picture of inventory risk across the facility.
Data Consolidation Across CMMS, EAM, and ERP Systems
The optimization model ingests parts master data, consumption history from work orders, equipment criticality classifications, maintenance schedules, vendor lead time history, and current stock positions — pulling from the CMMS, EAM, and ERP systems already in place at the facility. iFactory AI's integrated platform performs this consolidation natively, with optional connectors to SAP, Oracle, and Infor systems where the inventory data resides elsewhere. The output of this step is a unified parts dataset where every record carries the full operational context: which equipment uses it, when it was last consumed, how long it took the last supplier to deliver it, and what its current stock position is.
Criticality Scoring Based on Equipment Risk, Not Just Spend
Each part is scored on a criticality index that combines equipment importance to production, failure mode probability for the equipment it supports, alternate-source availability, and historical impact of stockout events on the same or similar equipment. This scoring replaces the spend-based ABC classification with a risk-based hierarchy where a $200 part that supports a bottleneck asset is correctly identified as more critical than a $40K part used in routine maintenance of redundant equipment. The criticality score updates automatically as equipment status changes, as new failure modes appear in work order history, and as supplier sourcing options change.
Demand Forecasting Using Consumption Patterns and Maintenance Plans
Future demand for each part is forecast using a model that combines historical consumption patterns with the planned maintenance schedule, scheduled equipment replacements, and condition monitoring signals from connected equipment. Parts needed for a planned overhaul in eight weeks appear in the demand forecast at the appropriate time, allowing pre-positioning. Parts for equipment that is scheduled for retirement are flagged as declining demand candidates. Parts associated with assets showing condition monitoring anomalies are flagged for accelerated demand. The forecast is updated continuously as new work orders, condition signals, and maintenance plan changes are recorded.
Reorder Optimization With Current Lead Time Reality
Reorder points and order quantities are calculated using current supplier lead time performance — not the historical average from twelve months ago. When a vendor's actual delivery performance drifts, the optimization model adjusts the safety stock automatically and flags the change for procurement review. Service level targets are differentiated by criticality tier, so the model invests stock in high-criticality items aggressively while maintaining minimal positions on low-criticality categories. The result is a reorder logic that protects against current supply chain reality rather than the conditions that existed when the original parameters were set.
Obsolescence Detection and Working Capital Recovery
The model continuously evaluates parts for obsolescence indicators — equipment retirement, model supersession, prolonged non-consumption, declining failure mode relevance — and produces a ranked obsolescence list that supply chain teams can review for write-down, return to vendor, transfer to other facilities, or external disposition. This identification, which is typically performed manually once or twice per year in traditional MRO, runs continuously in the AI-driven model and surfaces obsolescence as it develops rather than after years of accumulation.
Want to see what AI-driven inventory optimization would surface in your specific parts catalog? Book a Demo with iFactory's MRO analytics team.
AI vs Traditional MRO: A Direct Comparison Across the Decisions That Matter
The most useful way to evaluate the AI-driven approach against traditional MRO is to compare how each method handles the specific decisions that warehouse coordinators, maintenance planners, and supply chain managers make every week. The table below maps the principal MRO decision points against both approaches and shows where the AI-driven model produces materially different outcomes.
The Workflow Difference: Before and After AI-Driven Optimization
The clearest way to understand what changes operationally is to compare the workflow for handling a typical inventory event — say, an unplanned consumption spike for a specific part — under each approach. The comparison below maps the day-by-day activity sequence in a traditional MRO environment against the same scenario in an AI-driven environment.
How iFactory AI Integrates Inventory Optimization With CMMS and EAM
The operational value of AI-driven spare parts optimization depends on how tightly the inventory layer is integrated with the maintenance management and asset management systems that generate the demand signals. A standalone inventory optimization tool that requires manual data imports from the CMMS produces a fraction of the value of a platform where inventory decisions are continuously updated by the same workflow that records work orders, completes preventive maintenance, and tracks equipment condition. iFactory AI's CMMS and EAM platform delivers this integration natively — the inventory module operates on the same data foundation as the maintenance planning, condition monitoring, and asset hierarchy modules.
Unified Asset-to-Part Hierarchy
Every part record in iFactory is linked to the specific equipment it serves through the asset hierarchy — bill of materials data is maintained alongside equipment records rather than in a separate inventory system. When a piece of equipment is added, modified, or retired, the associated parts are automatically flagged for reclassification or obsolescence review.
Work Order to Inventory Closed Loop
Every work order completion automatically updates parts consumption — eliminating the data lag between maintenance activity and inventory position. The optimization model has access to consumption data within minutes of work completion rather than waiting for end-of-shift or end-of-week reconciliation.
Preventive Maintenance Bill of Materials
Every PM task has its bill of materials defined at the task level — when PM schedules are generated, the inventory layer automatically checks availability and triggers procurement actions at appropriate lead time. Planners no longer need to manually verify parts availability before scheduling work.
Condition Monitoring to Inventory Trigger
When predictive maintenance algorithms detect a developing failure mode on a specific asset, the inventory module is automatically notified and checks the parts likely required for the repair. Pre-staging actions are triggered at appropriate lead time relative to the predicted intervention window.
Supplier Performance Integration
Vendor performance metrics from the purchase order history continuously feed back into safety stock calculations — supplier lead time variance, on-time delivery rate, and quality reject rate all influence the buffer sizing for parts sourced from each vendor.
Multi-Site Stock Optimization
For organizations with multiple facilities, iFactory's platform supports network-level inventory optimization — identifying opportunities to share critical spares across sites, redistribute excess inventory, and consolidate purchasing leverage for common parts categories without compromising local availability.
Ready to see iFactory's integrated CMMS, EAM, and AI-driven inventory optimization working together? Book a Demo with our manufacturing solutions team.
Expert Review: What Supply Chain Leaders Say About the AI vs Traditional MRO Transition
"The transition from traditional MRO inventory management to AI-driven optimization is not really a technology transition — it is a workflow transition that the technology enables. The traditional MRO model assigned the inventory decision to a warehouse coordinator who was working with annualized averages and a static parts catalog. That coordinator could only manage a fraction of the parts catalog with real attention; the rest operated on autopilot through the reorder point formula. When the formula's assumptions failed — and they fail for a meaningful percentage of parts at every facility I have audited — the failure showed up as a stockout that triggered an expedite, or as obsolete inventory that sat for years before someone wrote it off. The AI-driven approach changes the workflow by giving every part the equivalent of dedicated analytical attention every day, surfacing the parts where conditions have changed and where action is needed. The warehouse coordinator's role shifts from running the reorder formula to reviewing recommendations and approving exceptions. The maintenance planner's role shifts from chasing parts availability to executing planned work with confidence that parts are positioned. And the supply chain manager finally has visibility into the working capital that has been trapped in obsolete categories for years. What I tell every manufacturing client evaluating this transition is that the financial case is straightforward — the inventory reduction and stockout cost avoidance pay for the platform within twelve months at almost every facility. The operational case is what matters more in the long run: getting the parts decision out of the static formula and into a continuously updated analytical framework that reflects what is actually happening in the plant."
Conclusion
Traditional MRO inventory management built U.S. manufacturing through decades of stable operating conditions, predictable consumption patterns, and reliable supplier performance. The static reorder point, the spend-based ABC classification, and the annual obsolescence review served their purpose when those conditions held. They do not serve adequately in the current environment of aging equipment portfolios, volatile lead times, accelerating model supersession, and the working capital scrutiny that follows from elevated interest rates and supply chain disruption.
The AI-driven approach to spare parts inventory optimization is not a radical departure from MRO fundamentals — it is the application of continuous analytical attention to decisions that traditional methods could only address through static formulas and periodic manual review. The reorder point still exists, but it updates in real time. The criticality classification still drives investment priorities, but it reflects actual equipment risk rather than annual spend. The obsolescence review still happens, but it runs continuously rather than annually. And the inventory layer still serves the maintenance organization, but it now anticipates demand from condition monitoring signals and planned work rather than reacting to work order issuance.
For U.S. manufacturing operations facing the combined pressure of working capital optimization, supply chain risk management, and maintenance reliability improvement, the AI-driven model addresses all three objectives through a single integrated platform. Deployment timelines are measured in weeks rather than years. Financial payback typically completes within the first twelve months. And the operational benefits — fewer stockouts, less expedite spending, faster work order completion, recovered working capital — compound over time as the model accumulates more operational data and refines its recommendations.
Ready to move from static MRO formulas to AI-driven inventory intelligence? Book a Demo with iFactory's manufacturing solutions team.
Frequently Asked Questions
Transform Your MRO Inventory From Static Formulas to AI-Driven Intelligence
iFactory's integrated CMMS, EAM, and AI-driven inventory optimization platform delivers the operational improvements that traditional MRO methods cannot — working capital reduction, stockout prevention, obsolescence recovery, and the integration between inventory and maintenance that closes the gap between parts data and production reliability.