Every safety metric most plants live by — TRIR, DART, lost-time frequency — measures the same thing: injuries that already happened. They're a rearview mirror, useful for reporting the past and useless for changing the future. Worse, they hide a dangerous illusion: a clean injury record is not evidence that a plant is safe. It can just as easily be under-detection, while risk quietly builds in one zone or on one shift. The insight that changes this is nearly a century old — Heinrich observed in 1931 that every serious injury sits on a much larger base of near-misses and unsafe conditions, observable long before the serious event. The signal was always there, weeks ahead. Predictive safety analytics reads that base of the pyramid and forecasts where the next incident is most likely — by zone, shift, or crew — so you intervene before harm instead of investigating after. You can book a demo to see it on your safety data.
Predict the Incident From the Signals That Precede It — Not Count It After
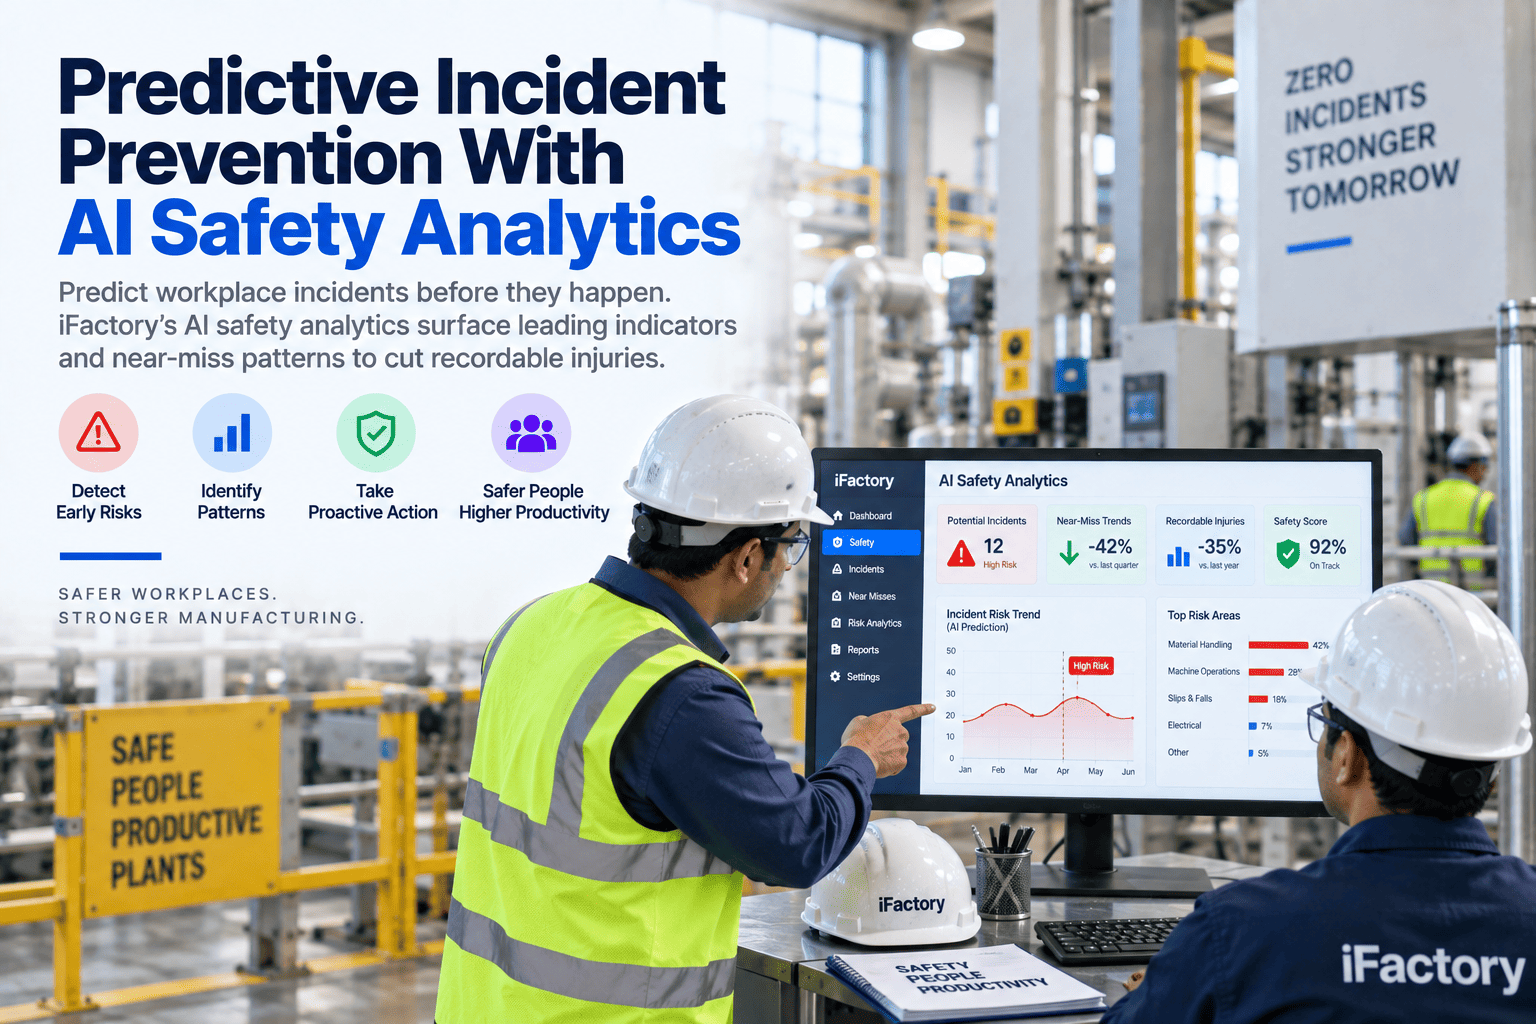
AI safety analytics reads leading indicators and near-miss patterns to forecast where an incident is most likely — by zone, shift, and crew — so you act on the deteriorating conditions before they become a recordable injury.
You Can't Manage Safety by Counting the Injuries You Already Have
The distinction at the heart of modern safety is between the metrics that look backward and the ones that look forward — and most programs are still built almost entirely on the backward-looking ones. Understanding why that fails is the starting point, because the whole value of predictive analytics is moving the plant's attention from the outcome to the conditions that produce it.
TRIR, DART, lost-time frequency, and fatality counts measure the outcomes of your safety system after the fact. They're essential for reporting and benchmarking, but by definition they can only tell you about harm that has already occurred — never where it's about to.
Near-miss reports, safety observations, unsafe-condition findings, training completion, and inspection results measure the state of the system while it's still safe — the proactive signals that reveal where risk is building before it produces an injury.
This is the trap that catches even well-run plants: the absence of incidents in the record does not confirm the absence of hazardous conditions. A facility can show a stable, low TRIR while specific zones or shifts are becoming steadily more dangerous — behavioral drift normalizing shortcuts, near-misses climbing, guards bypassed. Lagging indicators are blind to all of it until someone gets hurt, at which point the "surprise" incident was actually the visible end of a trend that had been developing for weeks. A low TRIR can mean you're safe, or it can mean you're under-detecting — and the two look identical until predictive analytics reads the leading signals and tells them apart.
Every Serious Injury Sits on a Base of Signals You Can Read
The reason prediction is even possible rests on a structural fact about how incidents happen. Heinrich's 1931 observation — refined over decades but still the core idea — is that serious injuries don't appear from nowhere; they sit atop a much larger base of minor injuries, near-misses, and unsafe conditions. That base is data, and it's visible long before the event at the top. This is what predictive analytics actually reads.
A near-miss is an injury that didn't happen this time — a genuine incident with the harm removed by luck. Its frequency and pattern in a zone are the strongest available predictor of the serious event that eventually won't be lucky. Yet near-misses are the most under-reported, most overlooked data a plant has.
Bypassed guards, skipped steps, housekeeping slipping, PPE compliance drifting — the observations and audit findings that capture behavior normalizing away from the safe standard. Individually minor, collectively they're the conditions from which serious harm is built.
Overtime and fatigue, a new crew, a rushed changeover, equipment overdue for maintenance, a particular shift — the operating conditions that raise incident probability. These sit alongside the safety data and, combined with it, sharpen the forecast.
The recordable injury or worse is the visible tip — but by the time it appears, the pyramid beneath it had been building in the data for weeks. Predictive analytics reads the base to forecast the tip, so the intervention lands before the event, not in the investigation after it.
Read the Base of the Pyramid Before It Reaches the Top
iFactory turns your near-miss reports, observations, and operational data into a forecast of where the next incident is most likely — so you act on the signals weeks before they become an injury.
From a Pile of Safety Data to a Forecast You Can Act On
Predictive safety analytics applies machine learning to the historical incident, near-miss, and operational data a plant already generates, to forecast the probability of future incidents by location, task, or crew. It's not a dashboard of the same lagging numbers — it's a forward-looking risk picture. This is what it produces.
The model surfaces where risk is concentrating — this area, this shift, this task, this team — so safety attention and resources go to the specific place an incident is most likely, instead of being spread evenly across a plant that isn't uniformly risky.
It finds the patterns in near-miss and observation data a human review misses — the cluster of similar close-calls on one machine, the drift in one department — turning scattered reports into a coherent warning that names the hazard.
Rather than waiting for TRIR to move, it tracks the leading indicators that shift first — near-miss frequency rising, observation quality falling, training lapsing — and flags the deteriorating trend while conditions are still correctable.
A risk score nobody can act on is useless, so the analytics surfaces what's driving the elevated risk — the factors an EHS lead can actually address — turning a prediction into a targeted intervention rather than a vague alarm.
The Forecast Has to Become an Intervention Before the Shift
A prediction that lands in a monthly report changes nothing. The value of predictive safety analytics is entirely in whether the forecast reaches the right person early enough to change what happens on the floor. This is the loop that turns a probability into a prevented injury.
Near-miss reports, safety observations, inspection and audit findings, training records, and operational context flow into the model as they're captured — so the risk picture is current, not a monthly compilation that's already stale when it's read.
The model scores where an incident is most likely and ranks the drivers, so the highest-probability, highest-consequence situations rise to the top instead of every hazard competing flatly for the same limited attention.
The warning reaches the supervisor or EHS lead who owns that zone, with the contributing factors attached, so it's an actionable heads-up — brief the crew, fix the guard, reschedule the fatigued shift — not a report filed for later.
The intervention opens a tracked corrective action, and its outcome feeds back into the model — so the system learns which interventions actually lowered risk, and the forecast sharpens over time instead of staying static.
The Discipline of Measuring Leading Indicators Is Itself the Prevention
It's worth being clear-eyed about how predictive safety actually delivers results, because that clarity is what separates a real program from a black box nobody trusts. The gains are real and documented, but they come from a specific mechanism — and the tool has firm limits that a serious program respects.
Organizations monitoring leading indicators see around a 59 percent reduction in TRIR and 60 percent in DART; technology-enabled tracking pushes those higher, and enterprise users report a 30-to-45 percent drop in high-potential near-misses when predictions are acted on consistently.
The correlation isn't magic: the discipline of systematically measuring, reporting, and acting on proactive metrics is itself the behavior that builds a safer system. The analytics makes that discipline scalable — but action on the signal, not the signal alone, is what prevents the injury.
The model forecasts probability and surfaces factors; it does not make safety-critical decisions. A person always owns the call and the intervention. Predictive analytics is decision support for the safety team, not a replacement for their judgment.
Clean, honestly reported near-miss and observation data is what makes the forecast trustworthy — which is why a culture where people actually report close-calls matters as much as the model. Start where the data is solid, prove accuracy, then scale.
Prediction Sits on Top of Reporting, CAPA, and Compliance
Predictive analytics isn't a standalone gadget — it's the forward-looking layer on the safety systems a plant already runs, and it makes each of them more valuable by turning their data into foresight. Here's how it connects to the rest of the EHS program.
When reporting a near-miss visibly feeds a forecast that prevents a real incident, people report more — and higher reporting rates both improve the model and signal the proactive culture that correlates with lower injury rates. The analytics rewards the behavior safety depends on.
Every safety program has more corrective actions than capacity. A risk forecast ranks them by the incidents they'd actually prevent, so the limited hours go to the actions that lower real risk most rather than to whatever was reported most recently.
The inspections, observations, and audits done for compliance become predictive inputs, so the effort already spent on regulatory programs does double duty — satisfying the auditor and feeding the forecast that prevents the next injury.
Leading-indicator trends and prevented-incident evidence give the safety team the data to justify resources and demonstrate program value — moving the conversation from counting injuries to demonstrably preventing them.
Leading Signals In, a Ranked Risk Forecast and Action Out
iFactory turns the safety data your plant already collects into forward-looking prevention: it ingests near-misses, observations, and operational context, forecasts where an incident is most likely by zone and shift, surfaces the drivers, and routes the warning to someone who can act — with human judgment always in the loop.
What Safety Teams Ask About Predictive Incident Prevention
Move Your Safety Program From Counting Injuries to Preventing Them
iFactory's predictive safety analytics reads the near-miss and leading-indicator signals beneath every serious incident, forecasts where the next one is most likely, and routes it to someone who can act — so you intervene before harm, with your team's judgment always in the loop.