A two-micron drift in electrode coating thickness sounds trivial until it changes how much energy a cell can store, how long it lasts, and whether it stays safe under stress. At roll-to-roll line speeds, that drift can happen and disappear inside a single shift before a manual sample check ever catches it. Gigafactories running on hourly microscopy checks are, in effect, flying blind between samples. See how a closed-loop AI system holds coating weight on target continuously by booking a demo for your coating line.
Why Two Microns Changes Everything
Coating thickness uniformity is the single most sensitive quality parameter in lithium-ion cell production, and the margin for error is measured in microns, not millimeters.
Reading the Tolerance Band in Real Time
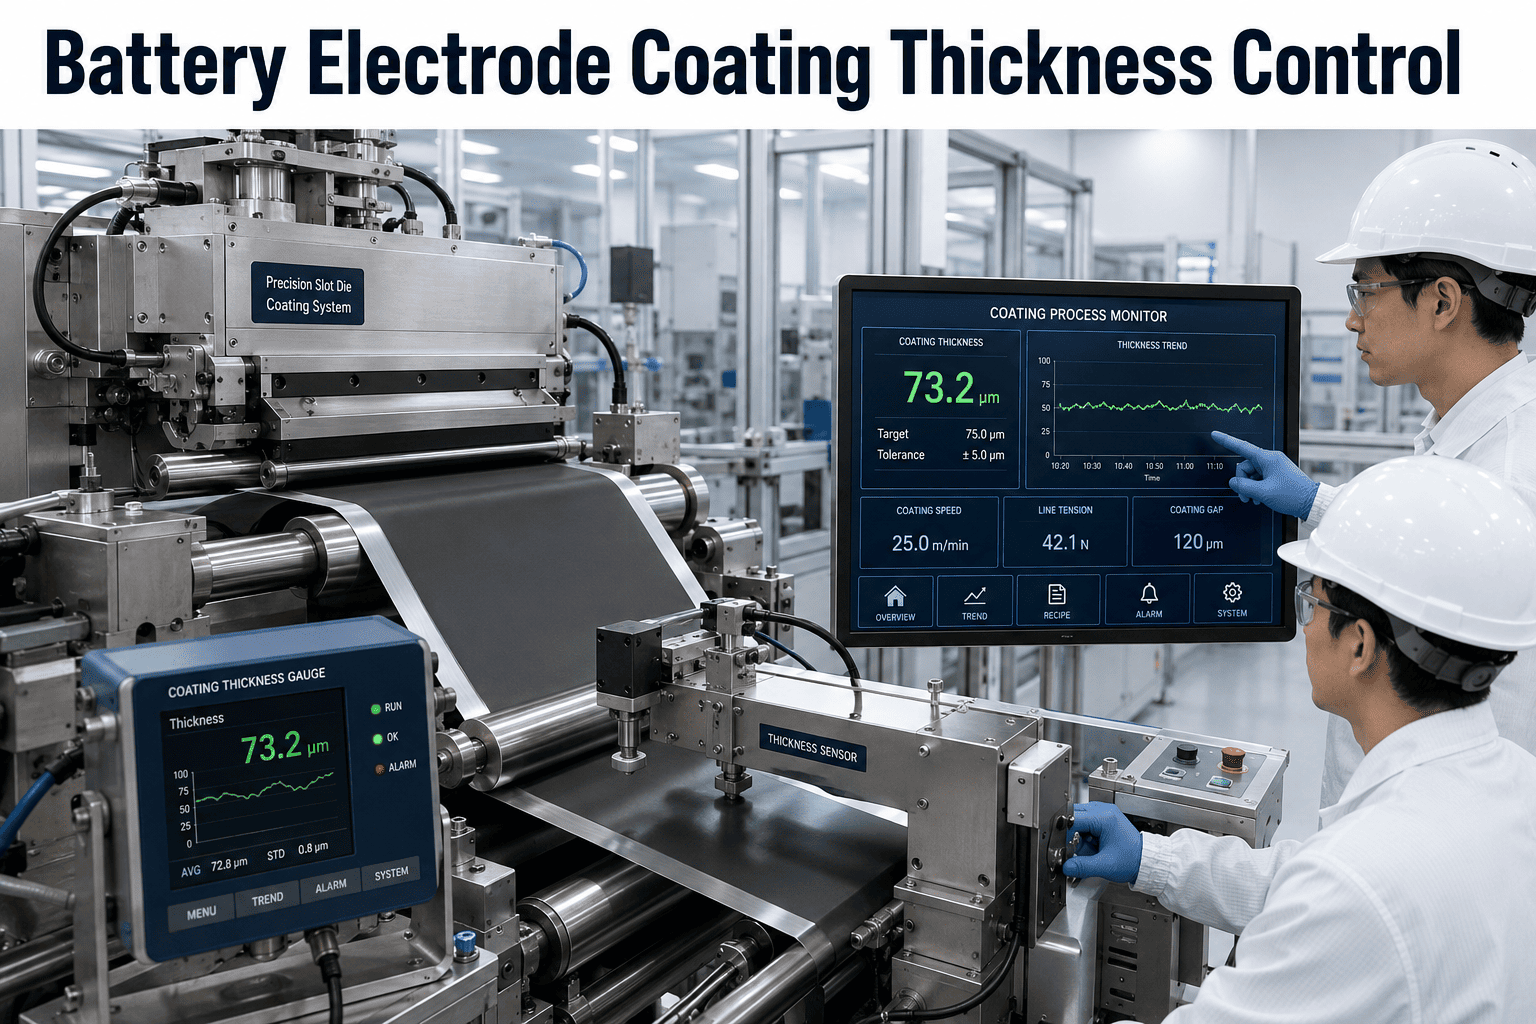
A slot-die coating process operates inside a coating window bounded by two failure modes — too little flow starves the bead, too much causes it to bleed. AI closes the loop between those limits continuously.
The Cost of Waiting for the Hourly Sample
An hourly microscopy check feels rigorous on paper, but a coating line does not pause between samples. It keeps running, and whatever drift is happening keeps happening too.
Between one sample and the next, a slot-die coater at typical gigafactory line speed processes a substantial length of coated material, all of it produced under whatever conditions existed during that window, good or bad. If viscosity began drifting five minutes after the last sample was pulled, the next check might be fifty-five minutes away from catching it, and every meter of electrode coated in between carries whatever thickness variation was building during that gap. This is not a hypothetical edge case — it is the default condition of any process controlled by periodic sampling rather than continuous measurement, and it is precisely the gap that in-line profilometry closes.
Battery plant managers who have moved from hourly sampling to continuous monitoring consistently describe the same realization: the variation was always there, sampling just was not frequent enough to see most of it. Once a dense stream of thickness data becomes available, patterns that were invisible at hourly resolution — a slow drift tied to a specific batch of slurry, a cyclical variation tied to roll changeovers — become obvious, and those patterns are usually the fastest wins once a team knows where to look.
What the AI System Actually Adjusts
Coating thickness is not controlled by one dial. It is the combined result of several parameters that drift independently, which is exactly why manual control struggles to keep up.
Manual SPC vs Closed-Loop AI Control
Statistical process control on a sample basis catches drift after the fact. A closed loop catches it while the web is still moving through the coater.
| Dimension | Manual Sampling & SPC | Closed-Loop AI Control |
|---|---|---|
| Measurement frequency | Periodic, often hourly | Continuous, in-line at line speed |
| Detection point | After material is already coated | While the web is still in the coater |
| Correction speed | Operator-dependent, minutes | Automatic, seconds |
| Root-cause isolation | Manual correlation across shift logs | Automatic correlation across gap, viscosity, speed, and temperature |
| Documentation | Manual log entry | Automatic quality record for every meter coated |
The Yield and Scrap Impact
Coating defects rarely show up as a dramatic failure. They show up as a slow accumulation of scrap and rework that adds up fastest at gigafactory scale.
Why This Matters More at Gigafactory Scale
A single coating line producing at modest volume can absorb a certain amount of thickness variation without it showing up in the numbers that matter to a plant manager. A gigafactory line running continuously cannot.
At high line speeds, a slot-die coater can process a substantial amount of electrode material per shift, which means even a brief excursion outside the tolerance band affects a meaningful quantity of material before anyone notices on a manual sampling schedule. Because coating speed and thickness measurement density both scale with production volume, the case for continuous in-line monitoring gets stronger, not weaker, as a plant ramps toward full capacity. What looks like an acceptable manual sampling interval at pilot-line volume becomes a real yield risk once the same line is running around the clock.
There is also a compounding effect worth planning for. Coating thickness variation that survives to the next process step — slitting, notching, stacking — tends to interact with tolerance stack-up from those downstream steps, which is part of why stacking misalignment and coating defects are often correlated in gigafactory defect data. Holding coating thickness tightly at the source reduces the burden on every inspection point that follows it, which is one of the reasons plant managers increasingly treat coating control as the highest-leverage single investment in the cell manufacturing process.