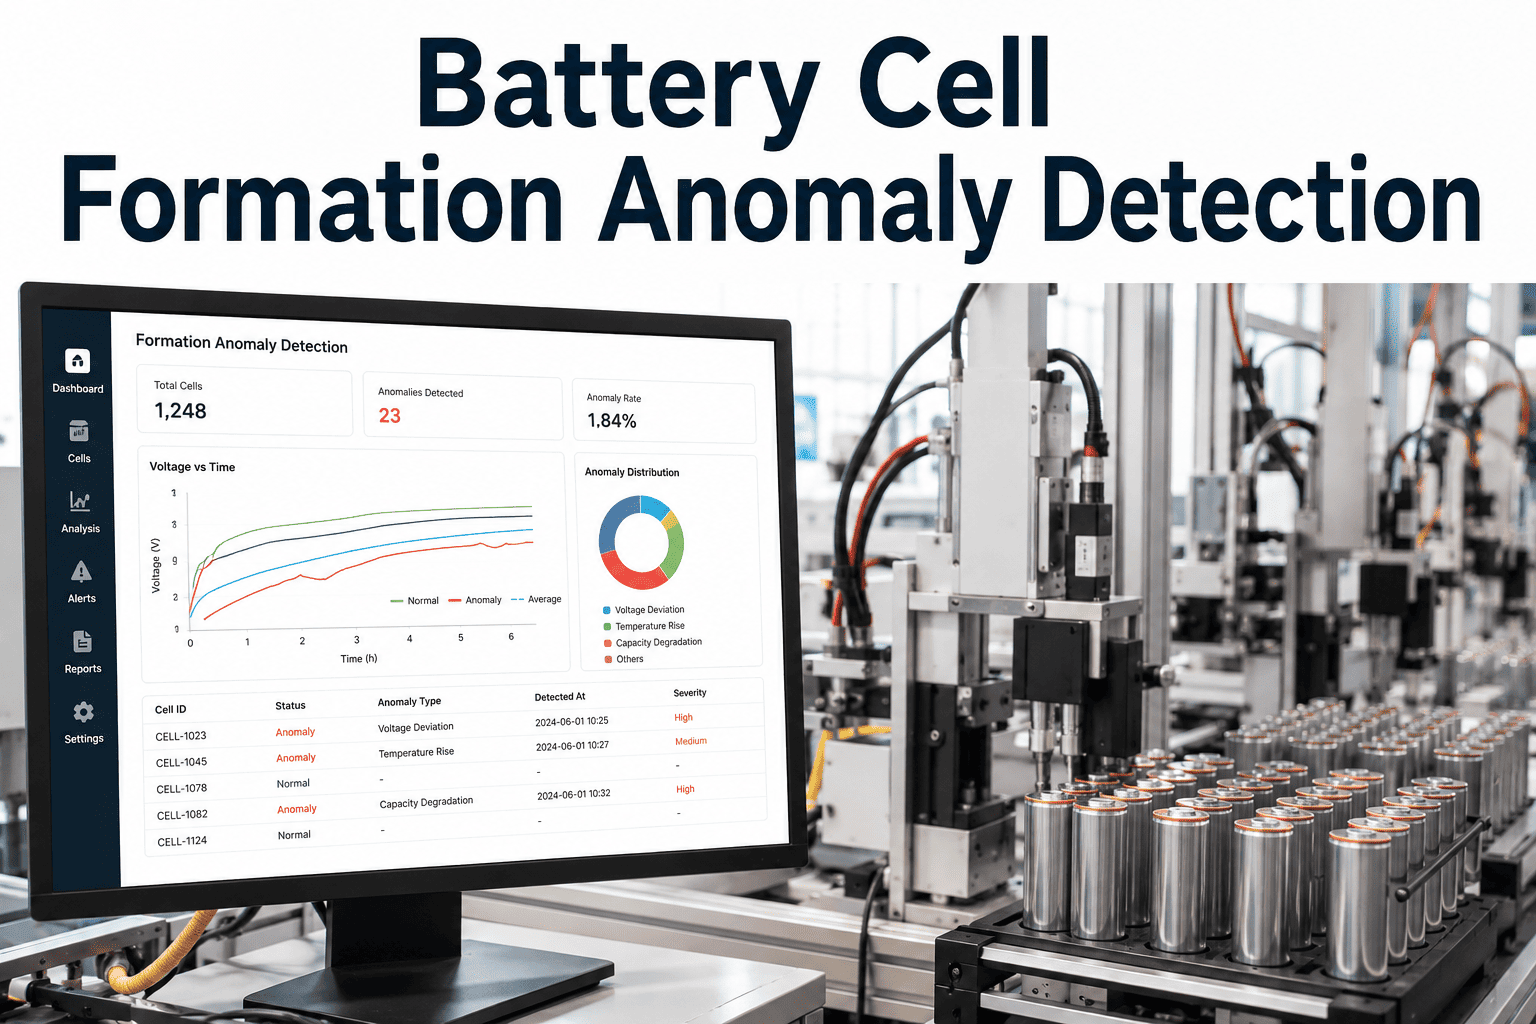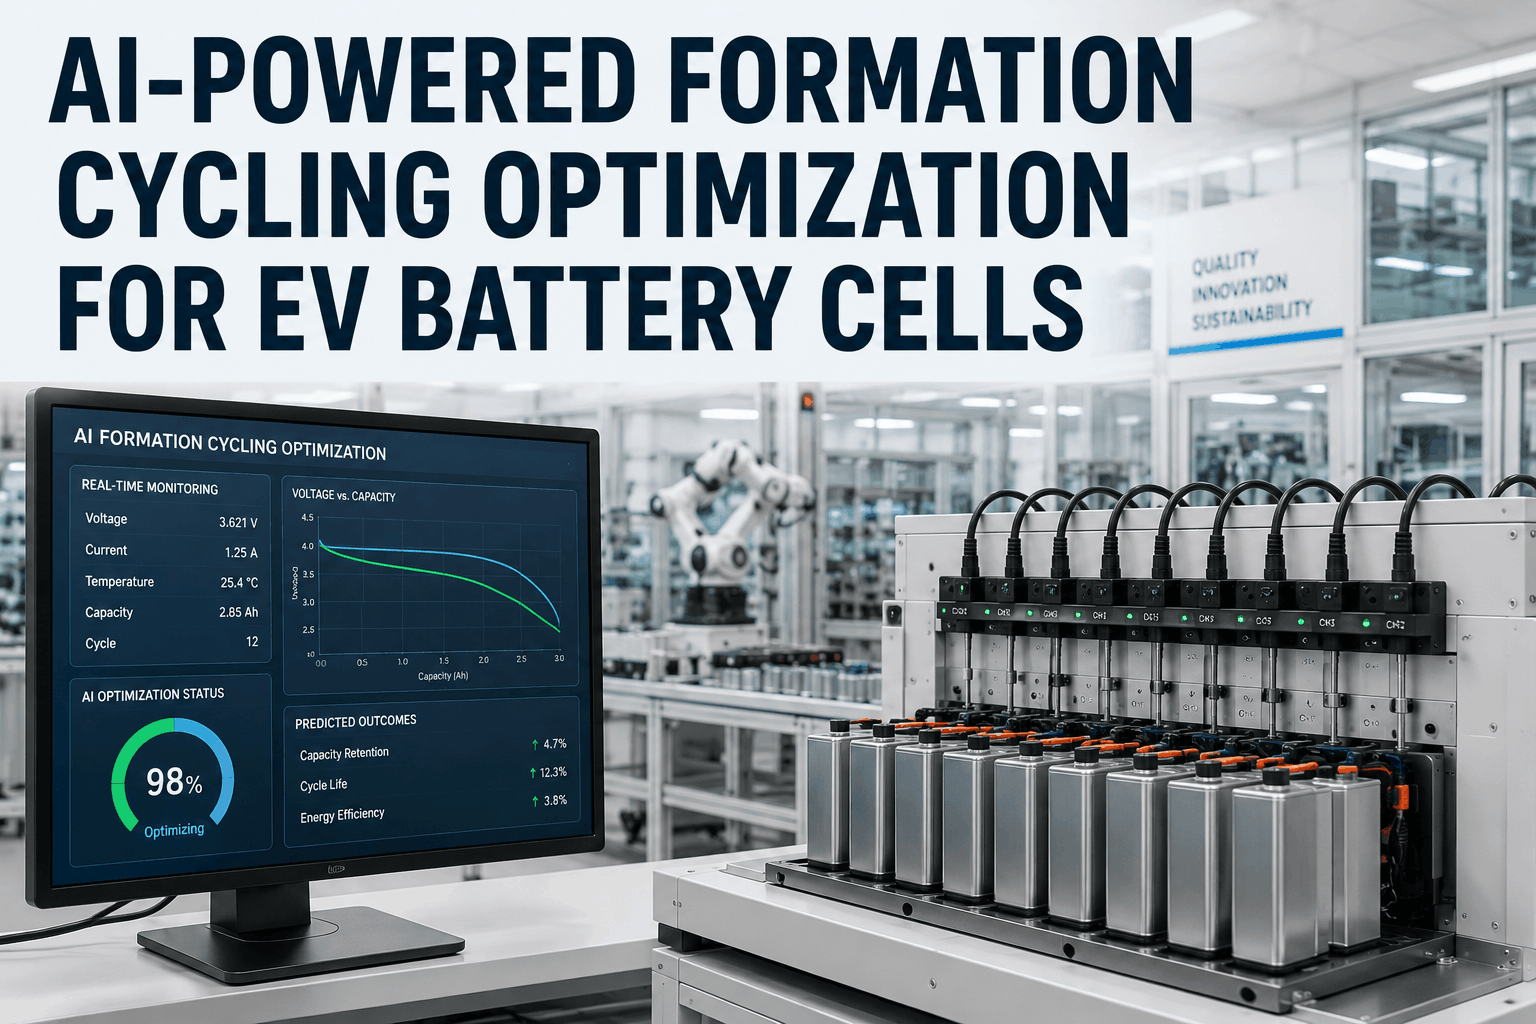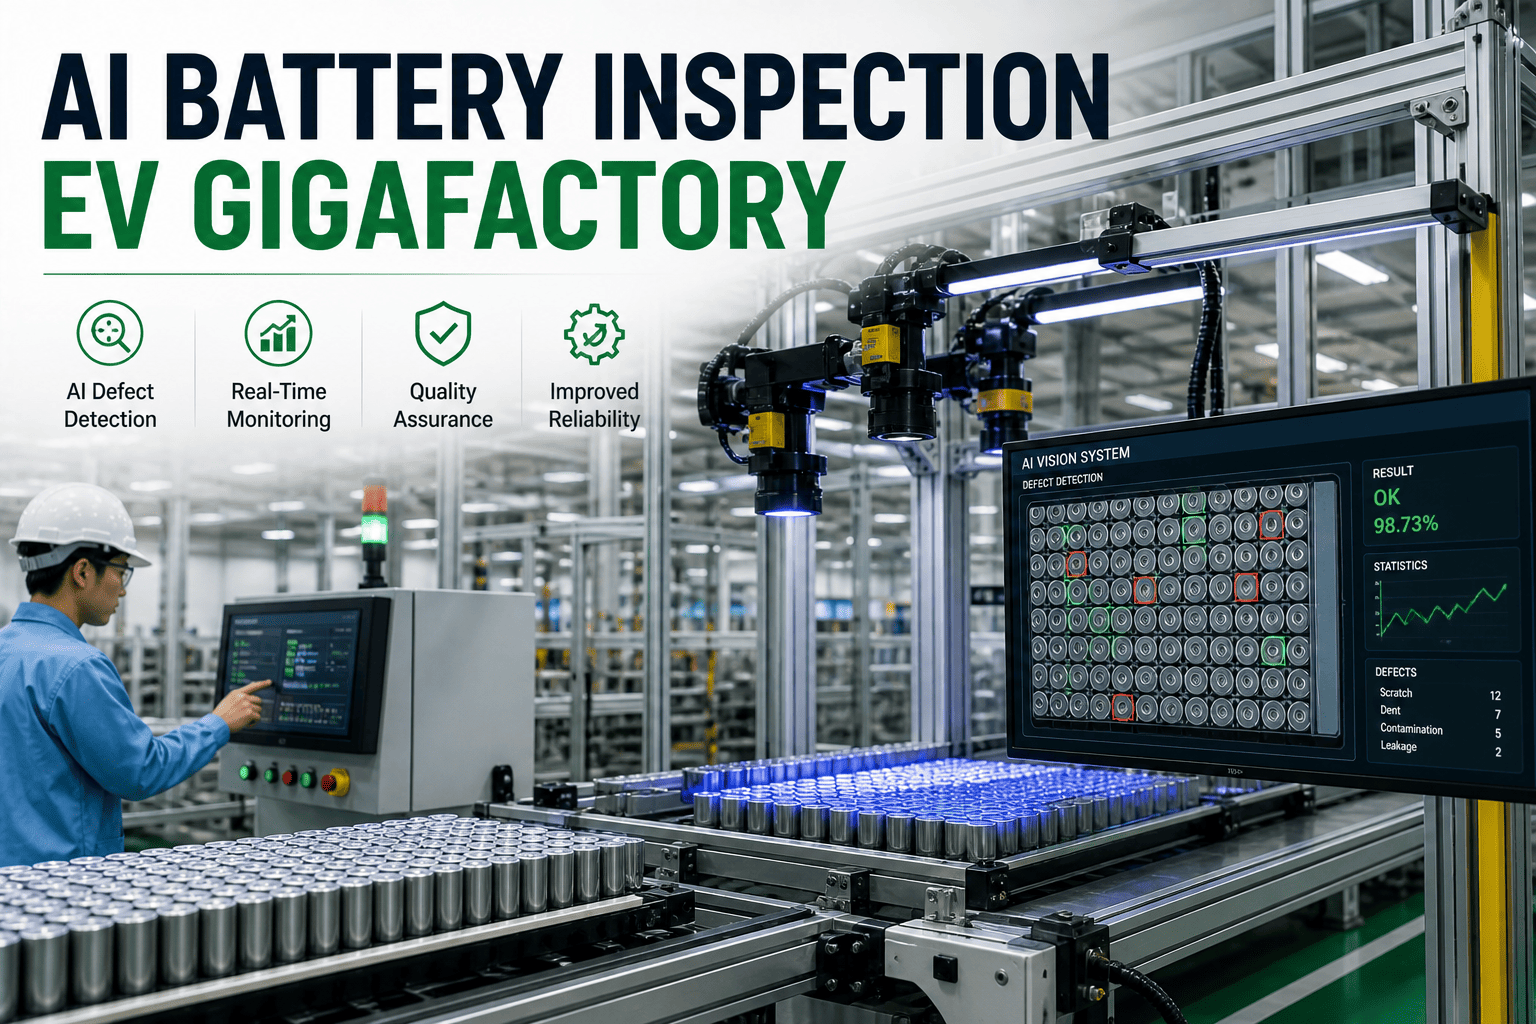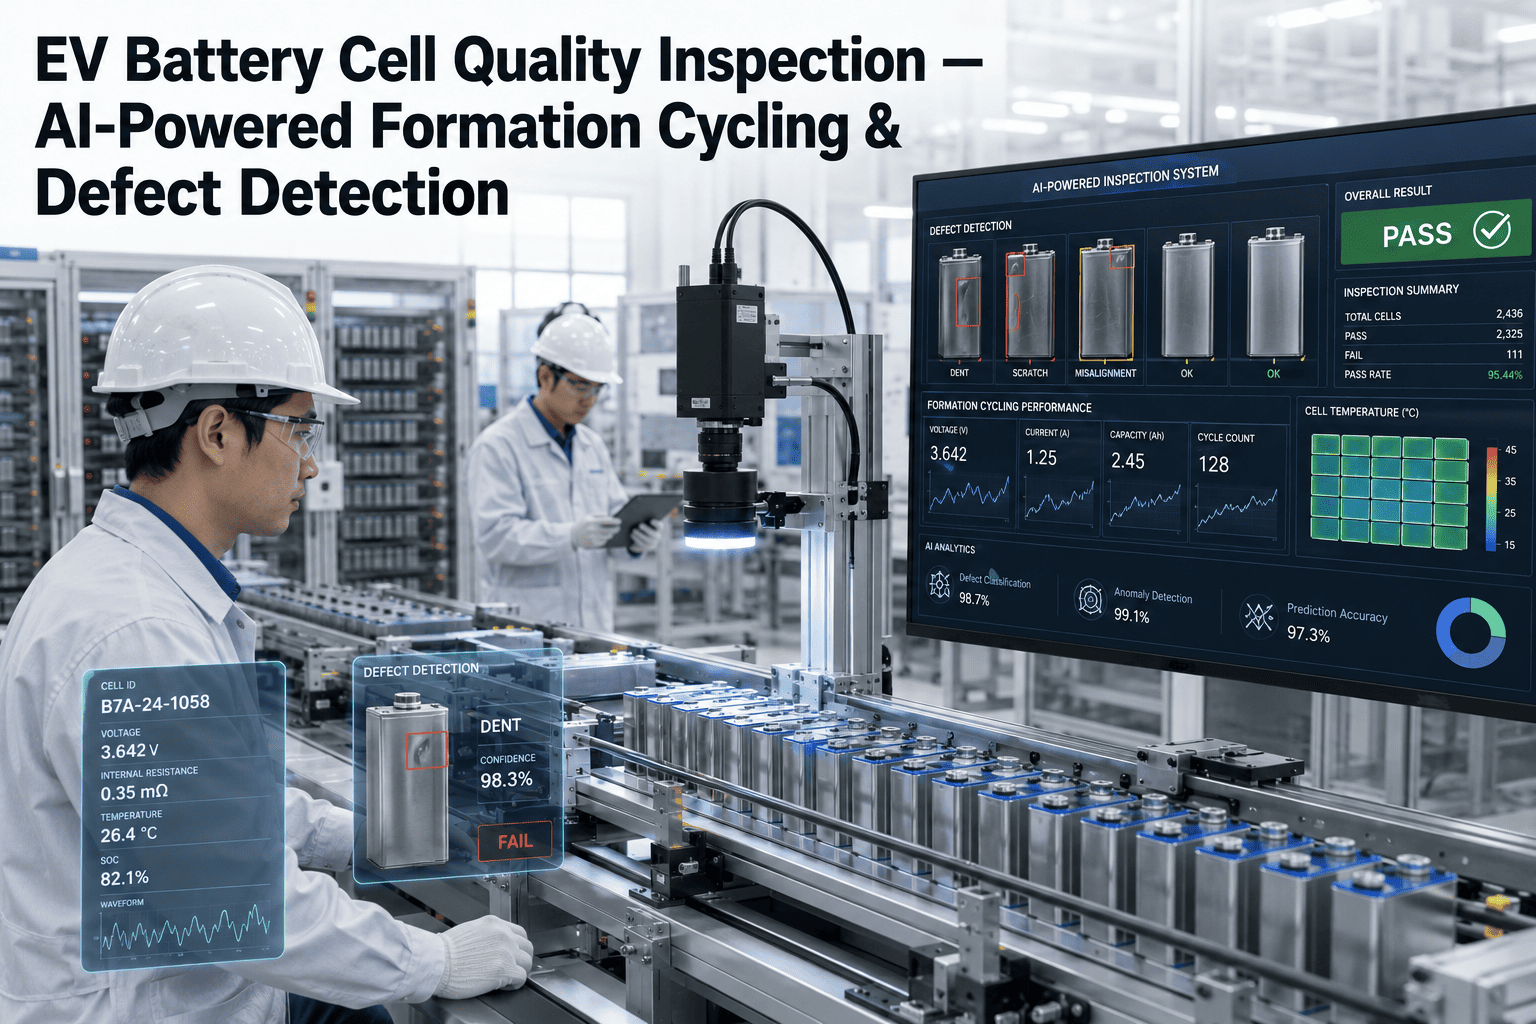
Formation cycling is the one point in battery manufacturing where a defective cell tells on itself, if anyone is watching closely enough. Voltage curves, impedance readings, and thermal signatures during those first charge and discharge cycles reveal internal flaws long before a cell would ever fail a simple pass or fail visual check. Most plants still rely on sampling a small percentage of cells, which means the majority of formation data collected during this critical window is never actually analyzed for defect signals. Quality managers who want to see what that missed data typically reveals can book a demo today.
QUALITY MANAGER GUIDE · FORMATION CYCLING · 2026
Every Cell Tells You Something During Formation
AI analysis of voltage curves, impedance, and thermal signatures during formation cycling catches defective cells that sampling-based inspection was never designed to find.
Why Sampling Misses So Much
Traditional post-production testing typically samples only one to two percent of manufactured cells, relying on the assumption that a defect present in the sample is representative of the batch as a whole. That assumption breaks down for the kind of subtle, cell-specific defects that formation cycling is uniquely positioned to reveal, such as internal micro-shorts or uneven electrode coating that only manifest as a slight voltage curve deviation.
Every cell already passes through formation cycling as part of standard production, which means the voltage, impedance, and thermal data needed to catch these defects already exists. The gap is not data collection, it is analysis, since manually reviewing formation curves for every cell at gigafactory volume is simply not feasible without automation.
The visual below makes the gap concrete. Out of every batch of cells produced, only a handful are ever actually reviewed for defect signals under a sampling approach, while the rest pass through with formation data that is generated, stored, and never looked at again.
SAMPLING INSPECTION
Roughly 1 cell in 30 is actually reviewed for defect signals
AI FORMATION ANALYSIS
Every single cell's formation data is analyzed for defect signals
1-2%
Of cells typically covered by manual post-production sampling
100%
Of cells already generate formation data, whether or not it is analyzed
3
Signal types AI cross-references: voltage, impedance, thermal
0V
Deviation as small as 0.05V can indicate early cell degradation
AI FORMATION CYCLING ANALYSIS
Turn Formation Data Into a Defect Filter
See how AI-analyzed voltage, impedance, and thermal signatures compare to your current sampling coverage.
Three Signals, One Combined Picture
No single signal on its own is a reliable defect indicator, since normal cell-to-cell variation can look similar to an early warning sign in isolation. Combining all three gives a far more confident read on which cells genuinely need to be pulled.
| Signal | What It Reveals | Typical Warning Sign |
|---|---|---|
| Voltage Curve | Internal shorts, coating defects | Deviation from expected charge curve |
| Impedance | Electrode contact and material issues | Resistance drift outside normal range |
| Thermal Signature | Localized heating, delamination | Uneven temperature during cycling |
From Formation Data to a Diverted Cell
1
Capture Every Cycle
Voltage, impedance, and thermal data are captured continuously during formation, not sampled after the fact.
2
Cross-Reference Signals
AI models compare all three signal types together, since a single anomaly alone can be a false positive.
3
Flag With Confidence
Cells showing a genuine multi-signal anomaly are flagged, reducing false rejections of otherwise healthy cells.
4
Divert Before Pack Assembly
Flagged cells are removed before entering a module, avoiding the far higher cost of a pack-level rework later.
What Quality Managers Are Saying
We always assumed our escape rate was close to zero because our sampling results looked clean. Once we ran full-coverage formation analysis, we found we had been missing more than one percent of defective cells, and none of them would have shown up in a random sample.
Quality Manager, EV Battery Cell Production
Frequently Asked Questions
Does full-coverage formation analysis slow down the production line?
No, because the analysis runs on data that formation cycling is already generating as part of the standard process, rather than adding a new inspection step to the line. The AI models process voltage, impedance, and thermal signals in the background while cells continue through their normal formation cycle, so throughput is not affected by the additional analysis layer running alongside it.
How does AI avoid flagging healthy cells as defective?
Rather than relying on any single signal crossing a threshold, the models cross-reference voltage, impedance, and thermal data together, since a genuine defect typically shows up as a correlated anomaly across more than one signal type. A minor voltage fluctuation alone might be normal cell-to-cell variation, but the same fluctuation paired with an unusual thermal signature is a much stronger indicator of an actual problem, which reduces false rejections meaningfully.
What escape rate improvement is realistic with full formation coverage?
Results vary by cell chemistry and existing process maturity, but plants moving from sampling-based inspection to full-coverage formation analysis commonly see escape rates drop from around one percent down to a tenth of a percent or lower. Teams can review a more specific estimate through support based on their current sampling rate and cell type.
Can this integrate with our existing formation cycling equipment?
In most cases, yes, since formation testers already output the voltage, impedance, and thermal data needed for analysis, the integration work is primarily about connecting that existing data stream rather than replacing testing hardware. Plant teams can book a demo to walk through compatibility with their specific formation cycling setup.
EV BATTERY QUALITY · FORMATION CYCLING
Analyze the Formation Data You Already Have
See how full-coverage voltage, impedance, and thermal analysis compares to your current sampling rate.