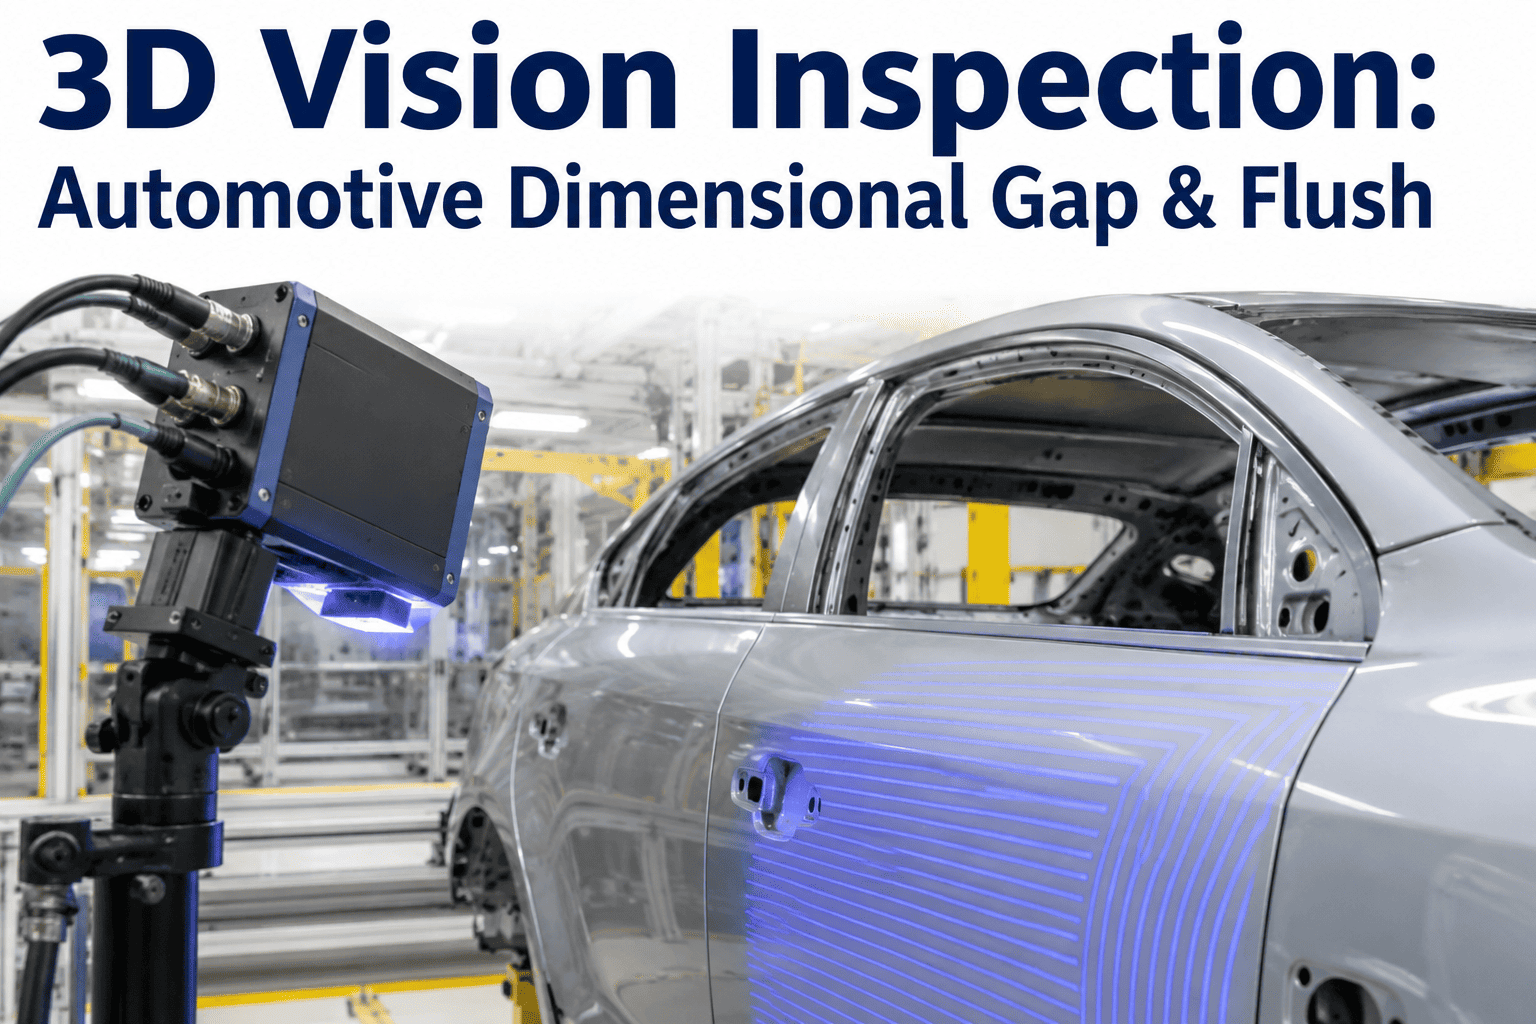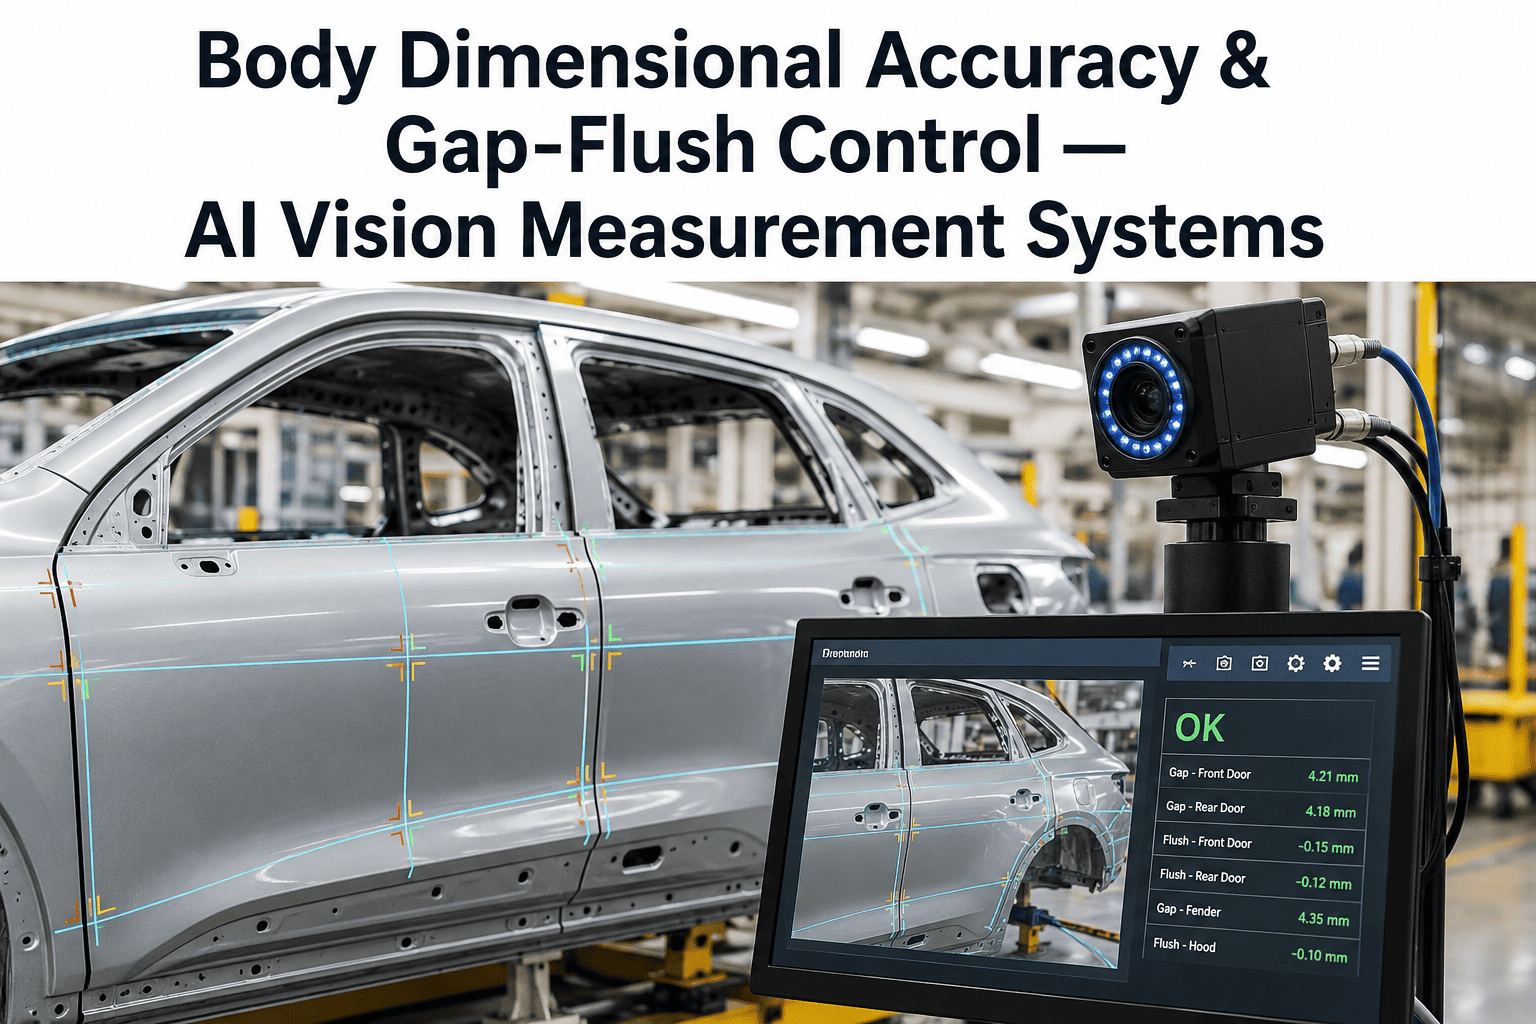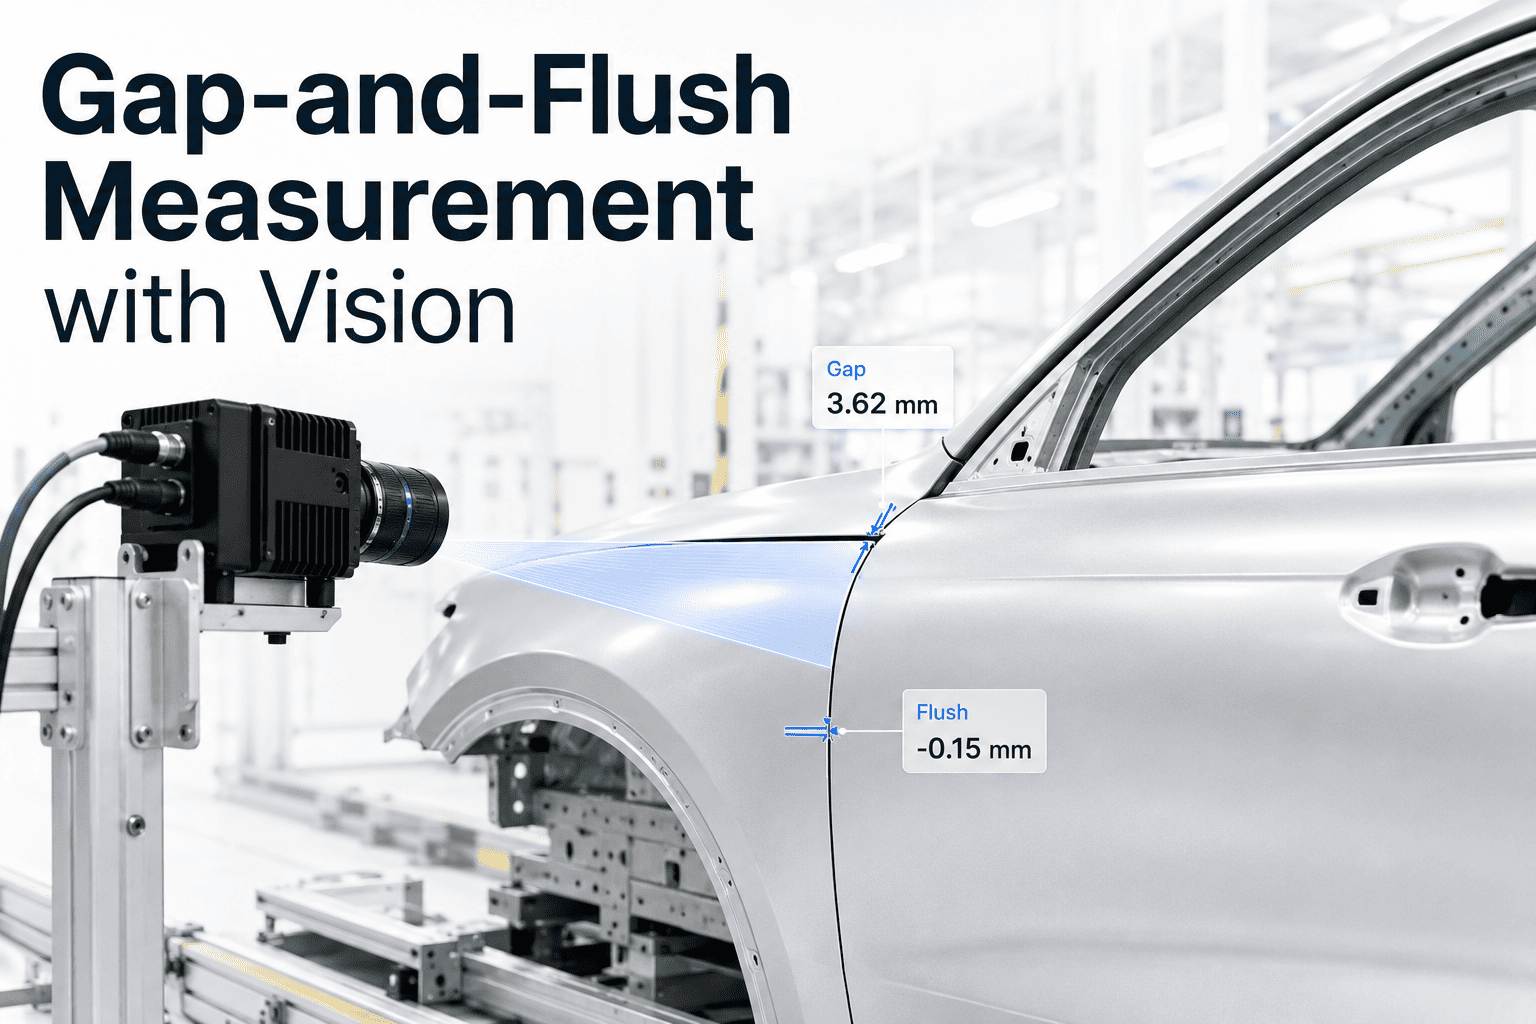
Gap and flush is the first thing a customer's hand and eye register when they walk up to a vehicle, long before they open a door or start the engine. A door panel sitting a fraction of a millimeter proud of the fender reads as a lower-quality build even if every mechanical system underneath is flawless. Manual feeler gauges have measured this for decades, but they sample a handful of points on a handful of vehicles per shift. 3D vision now measures every point on every body. See it running on real panel data by booking a demo.
Why Fit and Finish Is Judged First
Gap and flush is a functional measurement and a perception measurement at the same time. Customers cannot see a torque spec, but they can see and feel an inconsistent panel line.
The Measurement Zone Map
A full-body gap and flush check covers dozens of measurement points across every panel interface. Vision systems capture all of them in a single pass instead of a spot check on a sample of points.
What a Quality Manager Notices First
The shift from sampled to full-body measurement tends to surface in the quality data before it ever shows up in a customer satisfaction survey.
The first thing most quality managers notice is variance they did not know existed. A sampling plan built around checking a handful of vehicles per shift is designed to catch gross deviations, not the kind of subtle, vehicle-to-vehicle inconsistency that a full-coverage system reveals immediately. Two vehicles built minutes apart on the same line can carry noticeably different gap and flush profiles, and under a sampling regime that difference simply never gets measured unless one of those two specific vehicles happens to be pulled for inspection.
The second thing that changes is how quality data connects to engineering conversations. A quality manager holding a dataset with every vehicle measured at every panel interface can show engineering exactly which zones drift and under what conditions, rather than presenting a handful of anecdotal outliers. That level of evidence tends to move root-cause conversations forward faster, since a stamping or fixture theory can be tested directly against a full production run instead of a small, potentially unrepresentative sample.
Why Flush Needs 3D, Not Just 2D
Gap is a distance between two edges. Flush is whether those two surfaces sit on the same plane, and that distinction is exactly where 2D vision runs out of capability.
Manual Feeler Gauge vs 3D Vision AI
The feeler gauge has been the industry default for generations. It is precise at a single point but does not scale to full-body, full-shift coverage the way vision systems do.
| Dimension | Manual Feeler Gauge | 3D Vision AI |
|---|---|---|
| Points measured per vehicle | A sampled handful | Every gap and flush interface |
| Vehicles measured per shift | A small sample | 100% of production |
| Measurement uncertainty | Limited by gauge resolution | Sub-millimeter, well below manual resolution |
| Surface plane (flush) detection | Difficult to judge by feel alone | Directly measured via 3D reconstruction |
| Data record | Manual log per sample | Automatic record per vehicle |
What Full Coverage Delivers Over a Production Run
Once every vehicle is measured instead of a sample, patterns become visible that spot checks were structurally unable to catch.
From Body Shop to Showroom: Where Deviations Actually Start
A gap and flush problem discovered at final assembly did not necessarily originate there. Tracing it back to its true source is where full-body, multi-stage measurement earns its value.
Stamping tolerance, weld fixture wear, and body-in-white assembly sequence all contribute to how a panel sits relative to its neighbors long before paint or trim ever touch the vehicle. When gap and flush is only measured once, at the very end of the line, a quality team sees the symptom without the history — was this door always slightly proud of the fender, or did something shift during final trim installation? Measuring at the body shop stage and again at final assembly gives engineering two data points instead of one, which turns a guessing exercise into a straightforward comparison.
This matters most when a deviation is systemic rather than random. A single vehicle with an out-of-tolerance gap is a build issue for that vehicle. A consistent pattern of drift across dozens of vehicles in a shift, appearing at the same panel interface, is almost always a signal that a fixture, a weld sequence, or a stamping die has shifted — and that is exactly the kind of pattern that is invisible in a sampling plan but obvious the moment every vehicle is measured and the data is plotted over time.