Digital twins are reshaping how automotive manufacturers design and optimize factory layouts. Traditional plant layout decisions rely on static blueprints and historical precedent, often resulting in inefficient workflow patterns, bottlenecks at critical assembly stations, and wasted floor space. Digital twin simulations enable manufacturers to test hundreds of layout configurations before breaking ground, predict production bottlenecks, and optimize robotic positioning, material flow, and assembly line sequencing. Early adopters report 25-35% improvements in space utilization, 18-24% reductions in material handling distance, and 15-22% increases in line throughput—all validated through simulation before physical deployment.
The Factory Layout Problem in Automotive Manufacturing
Automotive assembly plants operate at extreme complexity. Volkswagen's flagship Wolfsburg plant spans 2.4 million square meters and coordinates 68 assembly lines simultaneously. Every meter of floor space carries cost: rent, utilities, maintenance. Every workflow inefficiency ripples through downstream stations, delaying shipments and blocking inventory flow. Traditional layout decisions made on engineering drawings miss critical interactions between robotic stations, conveyors, part storage, and human technicians until production ramps, by which time corrections cost millions.
The modern challenge is compounded by EV and battery production integration. Battery assembly lines operate under strict climate control and safety isolation. Robotic palletizing requires different spacing than manual sub-assembly. Inspection stations demand specific sightlines and access paths. A single layout error—undersizing a buffer zone, misplacing a robot base, misaligning station sequences—forces downstream line rebalancing, adds takt time, and reduces OEE. Digital twins solve this by enabling full factory simulation before any physical commitment.
Three Dimensions of Factory Layout Optimization
Effective digital twin simulations model three integrated layers: static spatial geometry (where equipment sits), dynamic material flow (how parts move), and temporal sequencing (when operations occur in relation to station capacity). Each dimension reveals different optimization opportunities.
Simulate Your Factory Layout Before Breaking Ground
iFactory digital twin platform integrates PLC, SCADA, and MES data to model exact production workflows. Test hundreds of layout configurations, identify bottlenecks, and validate OEE improvement predictions before construction. Book a consultation to see your factory in simulation.
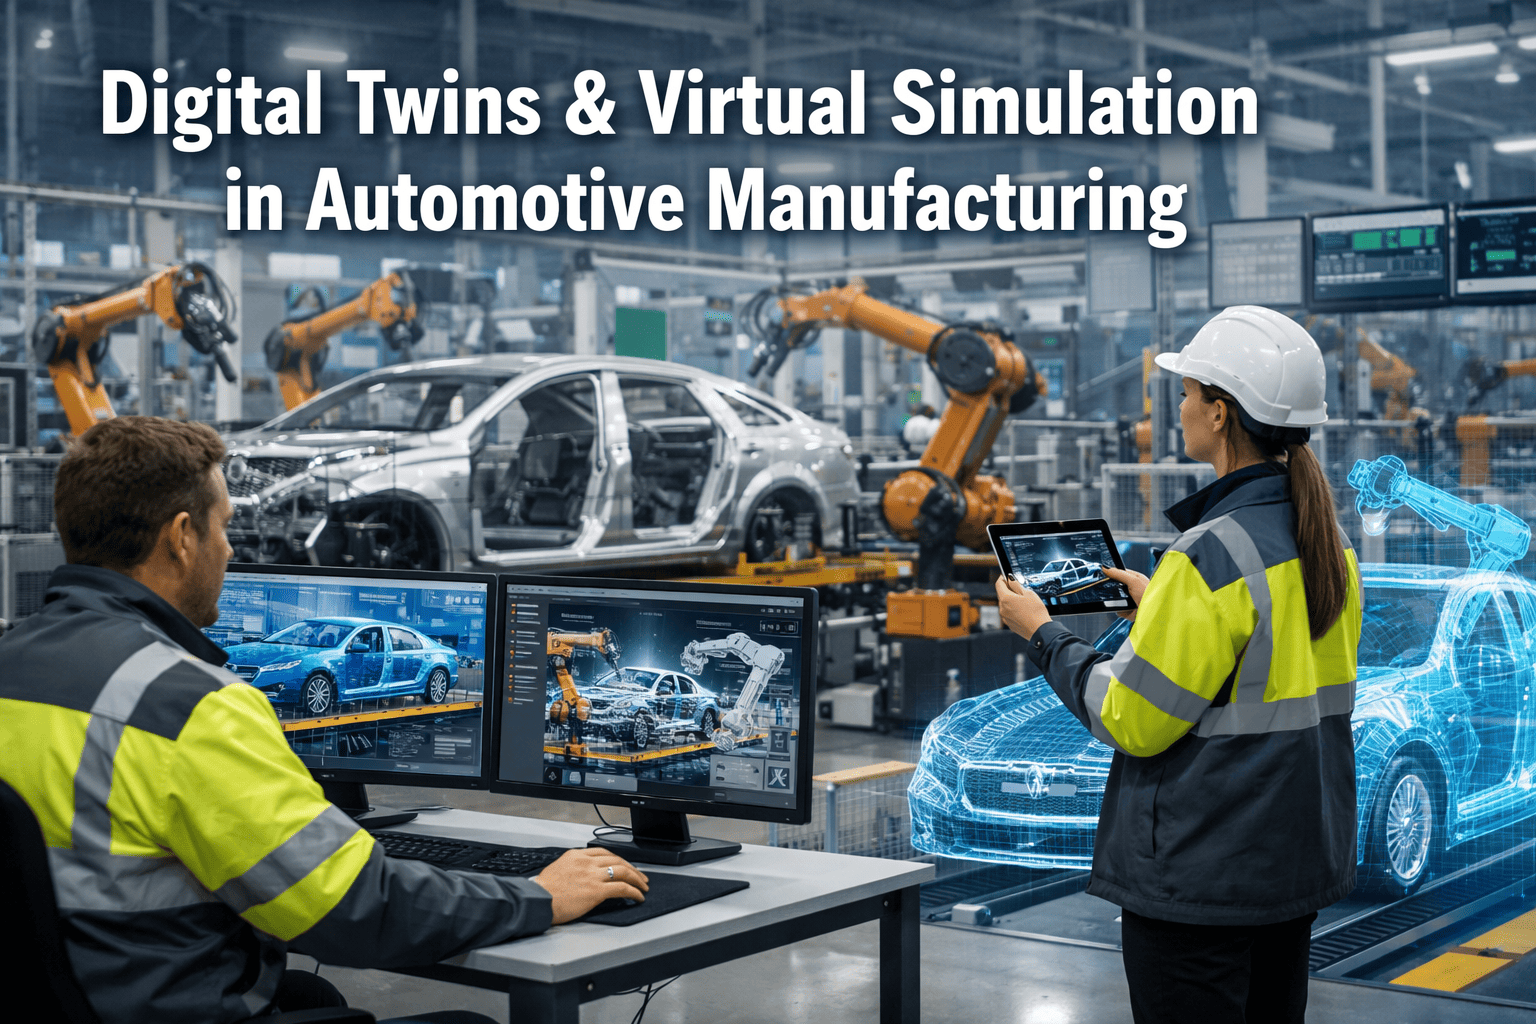
How Digital Twins Map Automotive Assembly Lines
A digital twin factory model begins with precise CAD geometry of the physical plant: the building envelope, structural columns, utilities (electrical, compressed air, water), and existing equipment. This baseline is then populated with detailed equipment models—each robot includes joint geometry, reach envelope, and cycle time specifications. Assembly stations include workstation dimensions, tool racks, and operator ergonomic zones. Conveyors include speed profiles and buffer capacity. Material storage areas include shelf layouts and part SKU assignments.
The simulation then loads production sequences: part lists, assembly operations, quality checkpoints, and material supply schedules. Real-world data from existing plants—actual cycle times, failure rates, changeover durations—is incorporated to make predictions accurate. The model is then run forward through simulated production days or weeks, tracking vehicle progression through each station, identifying where queues form, which resources are idle, and where bottlenecks emerge.
Real Factory Simulation Case Study: EV Battery Assembly Line
A Tier 1 automotive supplier expanded capacity for EV battery pack assembly. Original layout duplicated design from existing gasoline engine plant: single conveyor spine with branches to 12 assembly stations. Early simulation revealed 31% idle time at quality inspection (bottleneck), 2,140 meter average part handling distance, and insufficient buffer space for surge production. Three layout iterations were tested:
The final layout added one sub-assembly station and implemented an intermediate buffer with automated routing logic. Simulation predicted 54 units/hour throughput. Actual plant achieved 52 units/hour in first production run, validating simulation accuracy. Annual capacity gain: 21,120 additional units. Capital investment: $2.8M in new equipment. ROI: 8 months from added revenue.
Six Key Automotive Layout Optimization Patterns
Across dozens of simulated automotive plants, certain layout patterns consistently emerge as optimization opportunities. Understanding these patterns enables engineers to make faster, more confident layout decisions.
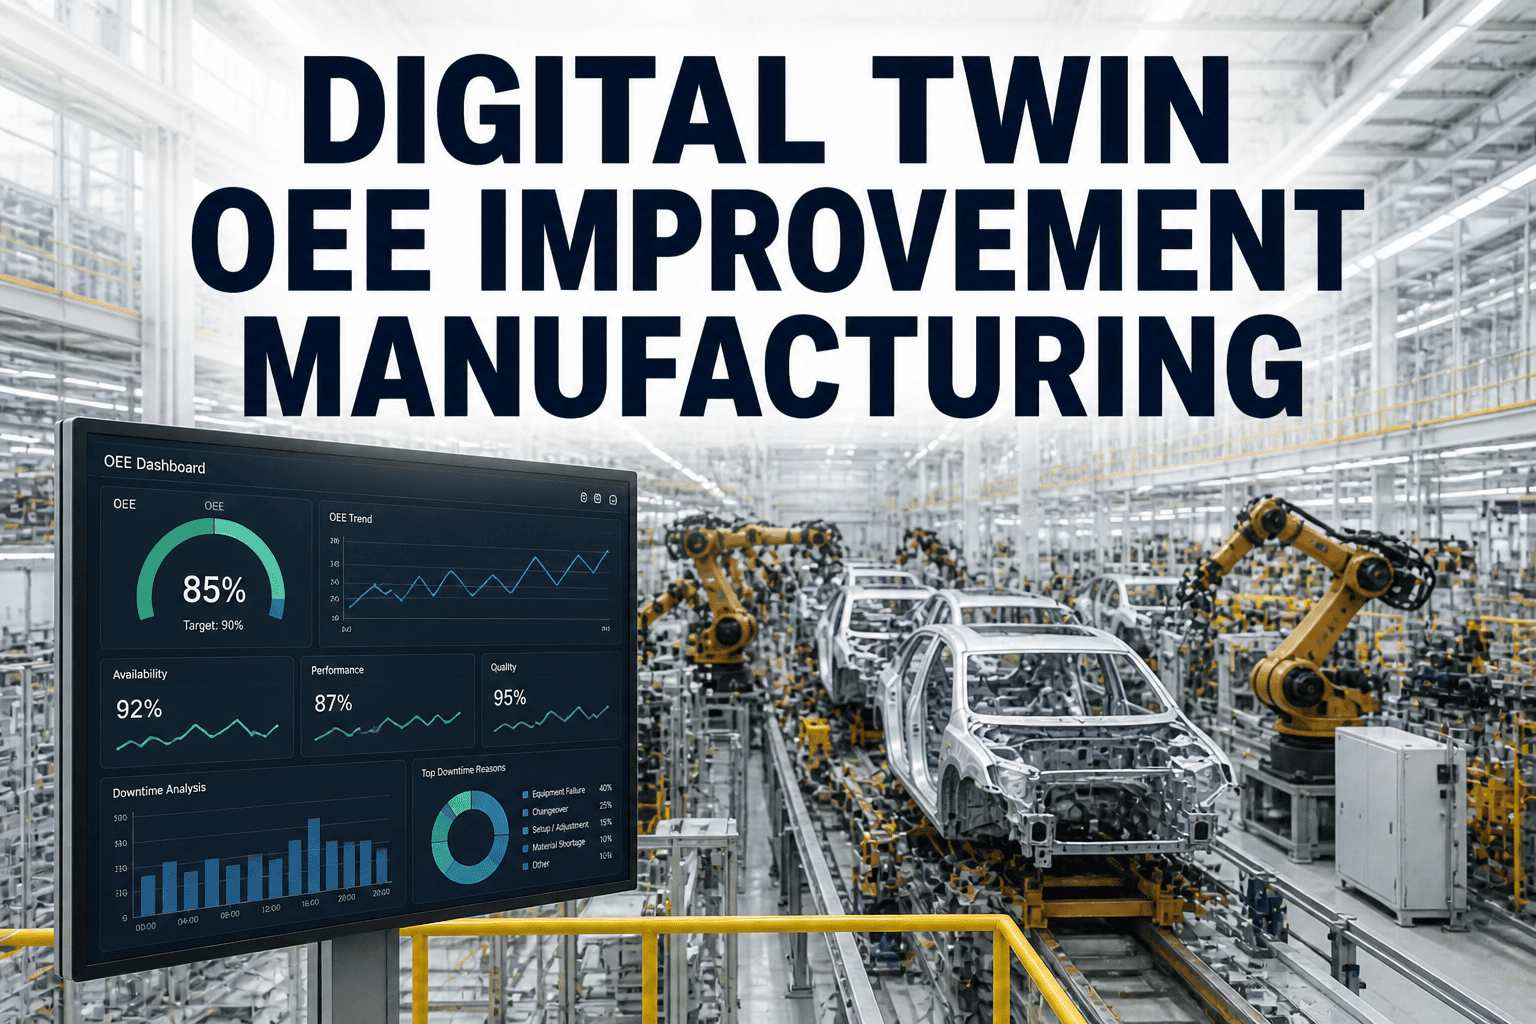
KPI Metrics From Factory Simulation
Digital twin simulations measure precise operational KPIs that align directly with business impact. These metrics guide layout optimization decisions and set expectations for actual plant performance.
| Metric | Baseline Expectation | Optimization Target |
|---|---|---|
| Line idle time | 12-20% (equipment waiting for parts or rework) | Below 8% (layout balanced, minimal queue buildup) |
| Takt time variance | 18-25% station-to-station variation | Within 10% target (load balanced across line) |
| Part handling distance | 2,000-2,500 meters per vehicle | 1,600-1,850 meters (20-25% reduction) |
| Buffer zone utilization | 55-65% or over 85% (both problematic) | 60-75% (optimal safety margin) |
| Quality inspection throughput | Bottleneck at 40-50% of line capacity | 120% of line capacity (never constraining) |
| Space utilization | 55-65% productive use (rest: storage, aisles, waste) | 70-75% productive use (20-35% improvement) |
| Changeover time per variant | 18-24 minutes (blocking adjacent stations) | 10-14 minutes (parallel changeover) |
| OEE (Overall Equipment Effectiveness) | Predicted 65-72% | Predicted 78-85% post-optimization |
Integration with Manufacturing Systems
Digital twins gain power through continuous integration with live manufacturing systems. Real-time data feeds from SCADA, PLC, and MES systems validate simulation assumptions and enable dynamic optimization during production.
Volkswagen Wolfsburg: Factory Digital Twin in Production
Volkswagen's Wolfsburg plant—the world's largest vehicle assembly facility—deployed a comprehensive digital twin covering 2.4 million m² across 68 production lines. The twin integrates data from 15,000+ SCADA endpoints and 2,800 robots. Monthly simulation cycles test proposed layout changes (new battery line integration, line speed adjustments, variant mix changes). Within 6 months of deployment, the digital twin identified 34 optimization opportunities worth 280 million euros in annual efficiency gains.
Regional Automotive Manufacturing Standards
Factory layout optimization targets vary by region due to labor costs, energy pricing, and compliance requirements. Digital twin simulations are customized to regional operational parameters.
| Region | Optimization Priority | Compliance Focus | Digital Twin Focus |
|---|---|---|---|
| US Midwest (Detroit) | Labor flexibility, variant mix, OEE targets 82-88% | UAW ergonomic standards, OSHA access requirements | Parallel workstations, changeover efficiency, human-robot collaboration zones |
| Germany (Wolfsburg) | Precision, efficiency, 6-second takt time targets | IATF 16949, German labor law (ergonomic rigor) | Sub-second cycle time tolerance, energy optimization, emissions tracking |
| Asia (Shanghai, Bangkok) | Cost minimization, high-volume production, scalability | IATF 16949, local emissions standards | Buffer optimization, material handling cost reduction, energy efficiency |
| Mexico (Monterrey) | Labor cost optimization, supplier proximity, supply chain risk | IATF 16949, proximity to US supply | Receiving/staging zones, supplier delivery windows, just-in-time material flow |
| Eastern Europe (Kvasiny) | Energy efficiency, labor productivity, expansion capacity | EU emissions, IATF 16949 | Modular line design, scalable automation, energy consumption modeling |
KPI Results: Before and After Digital Twin Optimization
Frequently Asked Questions: Digital Twin Factory Layout Planning
QHow long does it take to build a digital twin of an existing factory?
QCan digital twins model EV battery assembly lines with the same accuracy as traditional assembly?
QHow do you validate that simulation predictions match actual plant performance?
QWhat if we want to test a completely different layout approach?
QHow do we integrate the digital twin with our existing MES and SCADA systems?
QCan the digital twin predict the impact of adding a new product line to an existing plant?
Optimize Your Factory Layout With Digital Twin Simulation
Test hundreds of layout configurations before breaking ground. Identify bottlenecks, validate OEE improvements, and eliminate costly rework. iFactory digital twins integrate with your SCADA, PLC, and MES systems to model exact production workflows. Book a 30-minute consultation to see your factory in simulation.