Automotive manufacturing plants operate on razor-thin efficiency margins. A single production line producing 600 vehicles per day at 85% OEE (Overall Equipment Effectiveness) leaves 90 vehicles per day of lost capacity—equivalent to $2.7 million in annual lost production value at typical automotive margins. That gap exists in every shift, every day, every year at facilities operating without real-time visibility into root causes of downtime, inefficiency, and quality loss. Digital twin technology—a real-time digital replica of physical manufacturing systems continuously synchronized with production floor data—delivers visibility into equipment performance, production bottlenecks, and failure prediction with precision impossible through traditional monitoring. Automotive plants implementing digital twins achieve 12 to 25 percent OEE improvement through predictive maintenance reducing unplanned downtime, real-time production optimization eliminating bottlenecks, and quality analytics reducing defect rates. The 25 percent improvement case is achievable through comprehensive digital twin deployment. Book a demo to see a digital twin configured for your production environment.
Digital twin technology creates a real-time, continuously-updated digital replica of automotive production lines, equipment, and processes synchronized with live manufacturing data. The digital twin integrates data from equipment controllers (PLC/PAC), SCADA systems, MES platforms, and IoT sensors measuring equipment state, production volume, defect events, and environmental conditions. Machine learning models trained on historical production data identify patterns predicting equipment failure 1-4 weeks in advance, detect production inefficiency within hours, and optimize equipment sequencing for maximum throughput. Real-time dashboards provide visibility into OEE components (availability, performance, quality) at equipment, line, and facility level. Automotive plants achieve 12-25% OEE improvement through predictive maintenance reducing downtime by 12-18%, production optimization reducing performance loss by 8-15%, and quality analytics reducing defect rates by 5-12%. ROI typically achieved within 6-12 months through avoided downtime costs alone.
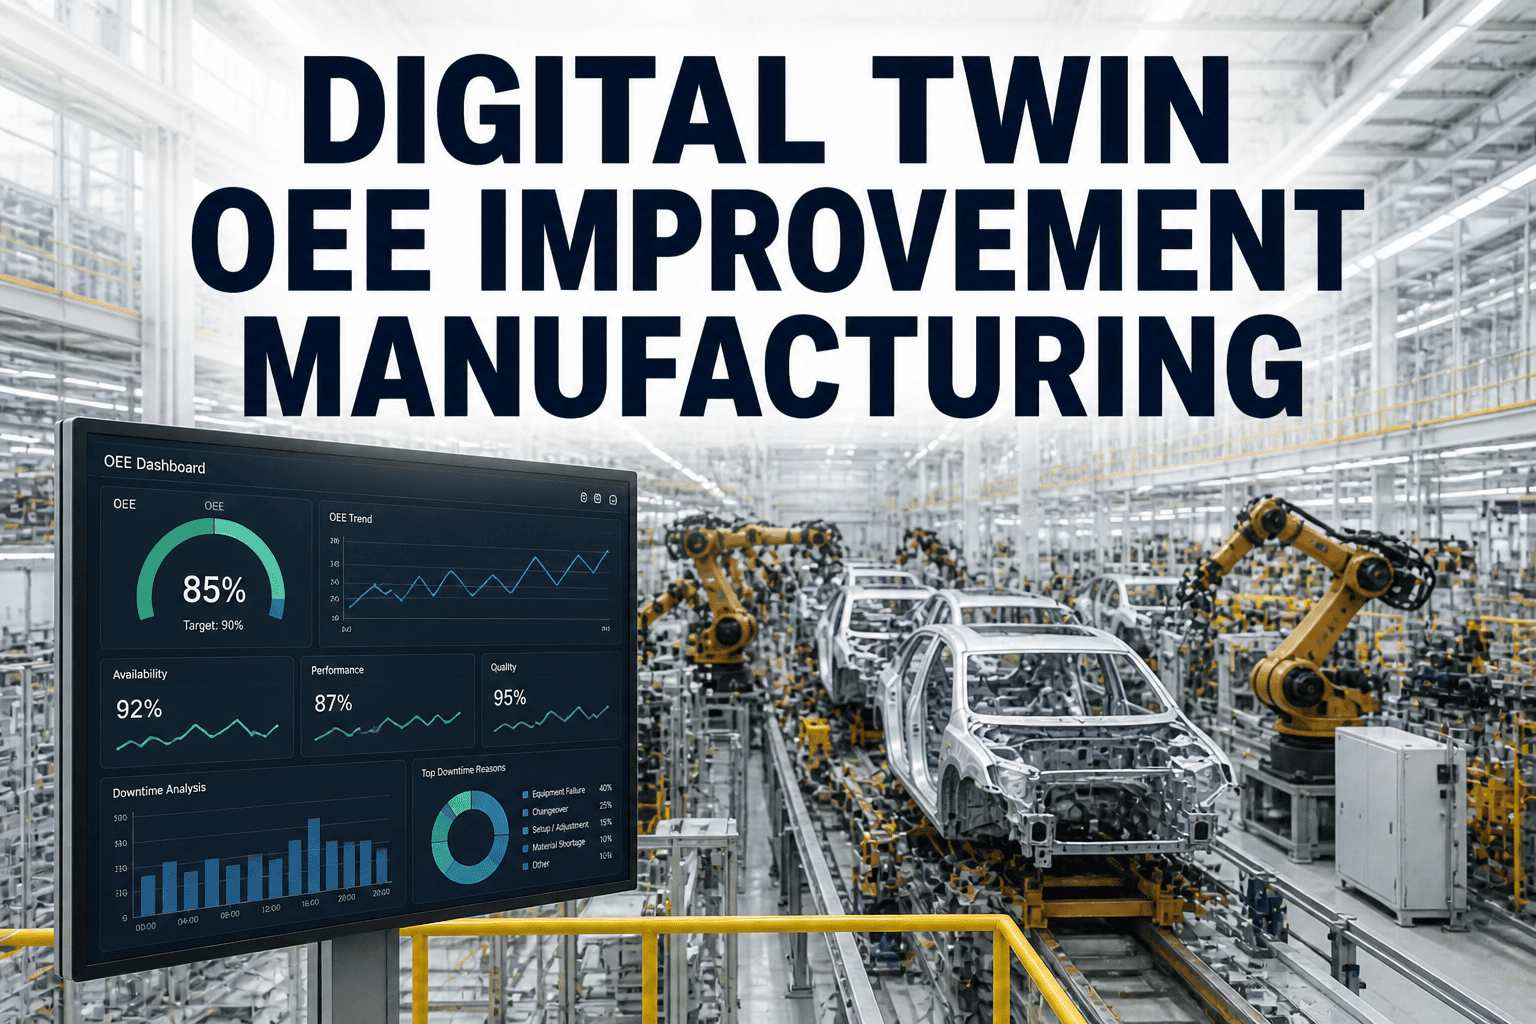
Automotive Manufacturing OEE: The Three Components and Where Loss Occurs
Overall Equipment Effectiveness (OEE) measures manufacturing plant efficiency across three components: Availability (equipment uptime), Performance (actual output versus theoretical maximum), and Quality (defect-free parts). Typical automotive assembly plants operate at 65 to 75 percent OEE, with significant loss in each component.
Equipment downtime causes loss of availability—unplanned stops due to equipment failure, maintenance emergencies, parts shortages, or logistics issues. Automotive assembly lines experience 4 to 8 unplanned stops per shift (20-40 minutes cumulative per 8-hour shift) at typical facilities. Major loss sources: robot arm failures requiring 2-4 hour repairs, stamping press misfeeds requiring changeover resets, painting booth filter blockages, welding gun wear. Predictive maintenance through digital twin detection reduces unplanned stops by 60 to 75 percent, improving availability to 92-98 percent. ROI from availability improvement alone: $800K to $2M+ annually at typical automotive assembly scale.
Performance loss occurs when equipment operates below theoretical maximum speed or produces fewer parts than the line capacity allows. Loss sources: equipment running at reduced speed due to vibration or temperature concerns, incomplete parts not triggering next process step triggering buffer accumulation, changeover time exceeding standard, optimization opportunities in sequence not implemented. Digital twin identifies bottleneck equipment (typically one piece of equipment constraining entire line throughput) and optimization opportunities invisible to traditional monitoring. Performance improvements of 8 to 15 percent are achievable through equipment-specific speed tuning, changeover optimization, and buffer management. ROI from performance improvement: $600K to $1.5M+ annually.
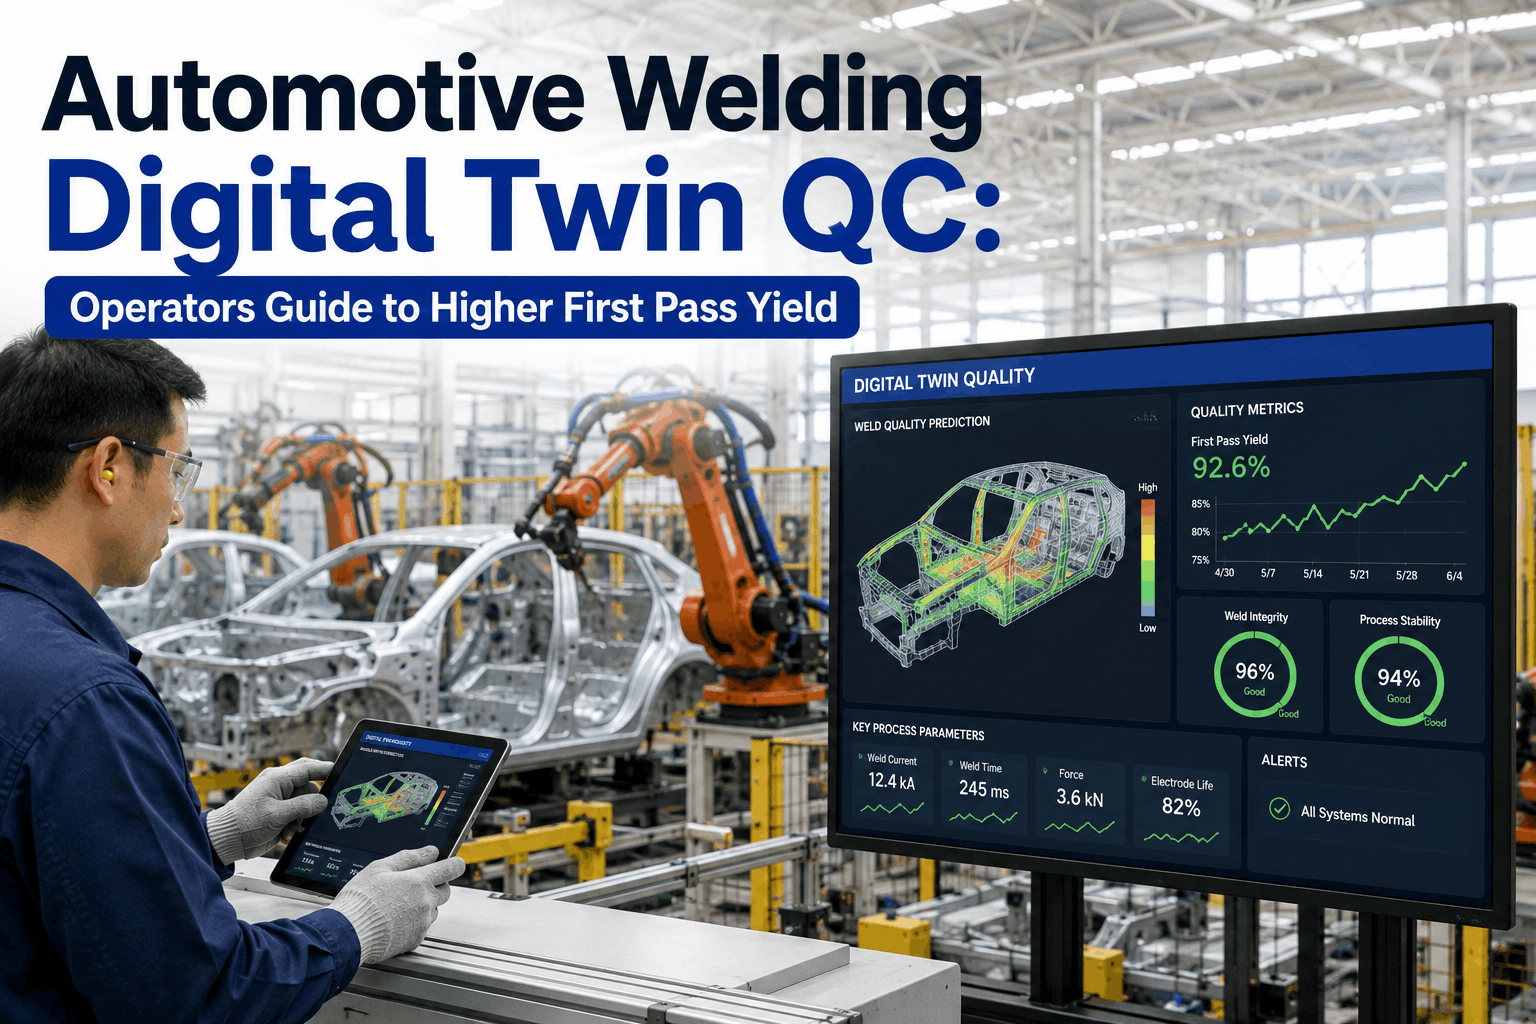
Quality loss occurs when manufactured parts fail inspection (exceeding tolerance, surface defects, incomplete assembly, paint runs, weld gaps). Loss sources: tool wear causing tolerance drift, incoming material variation not detected early, environmental factors (temperature, humidity) affecting process, operator error in setup or changeover. Digital twin correlates quality events with equipment parameters and environmental conditions, identifying root causes and enabling predictive quality—triggering tool changes or parameter adjustments before defects occur rather than after detection. Quality improvement of 5 to 12 percent reduces scrap, rework, and warranty costs while improving first-pass yield. ROI from quality improvement: $400K to $900K+ annually including avoided warranty and rework costs.
Four Critical OEE Challenges Automotive Plants Face Without Digital Twins
Automotive manufacturing operates with high-tech equipment yet low-tech visibility into performance. Traditional monitoring systems cannot address core OEE challenges.
Automotive plants rely on calendar-based preventive maintenance (oil changes, part replacement every 500 operating hours) regardless of actual equipment condition. Unexpected failures still occur when equipment reaches failure threshold between scheduled maintenance windows. A robot arm bearing showing early degradation symptoms (slight vibration increase) goes undetected until catastrophic failure requiring 4-hour emergency replacement. Digital twin detection identifies bearing degradation 2-4 weeks in advance through vibration signature analysis, enabling scheduled maintenance during planned downtime rather than emergency response. Industry result: 60-75 percent reduction in unplanned downtime, equivalent to 5-10 fewer emergency stops per month per plant.
Automotive assembly lines consist of 40 to 60 sequential process stations (body welding, painting, assembly, testing). One underperforming station reduces throughput of entire line. Without real-time visibility, production schedulers and engineers cannot identify which station constrains overall capacity. They assume all stations operate equally—a false assumption causing missed optimization opportunities. Digital twin identifies bottleneck station (typically operating 95 percent of theoretical capacity while others operate 70-80 percent) and reveals why: maybe the stamping press requires longer dwell time, maybe the welding station runs 10 percent slower than others, maybe the paint dry time is too long. Focused engineering on bottleneck equipment yields 3 to 8 percent throughput improvement. Across a line producing 600 units per day, 3 percent improvement equals 18 additional units daily, worth $54,000 in additional revenue per day at typical automotive margins.
Quality systems catch defects (paint runs detected in final inspection, weld gaps found in X-ray testing, tolerance violations measured in CMM). But quality systems do not reveal why defects occurred. A batch of 45 parts with paint runs gets scrapped without identifying that painting occurred when HVAC humidity was 75 percent (outside optimal 40-50 percent range) or that parts from stamping press #2 have 15 percent higher defect rate than press #1. Defect trends repeat because root cause remains unknown. Digital twin correlates every defect event with equipment parameters, environmental conditions, and operator actions at moment of defect, identifying root causes with high confidence. Quality engineers can then implement targeted corrections (humidity control, stamping press maintenance, operator retraining) preventing recurrence. Result: defect rate reduction of 5 to 12 percent.
Monthly OEE reports show facility-wide performance (e.g., 72 percent OEE across 4 assembly lines) without revealing line-by-line breakdown. Production directors cannot identify that line A operates at 78 percent OEE while line C operates at 64 percent. Even within lines, shift-by-shift visibility is lost in monthly averages. Day shift performance hidden by night shift underperformance. Digital twin delivers real-time OEE visibility at line level, shift level, and individual equipment level. Managers identify that line C's 14 percent performance gap versus line A is caused by higher unplanned downtime (72 percent availability versus 86 percent). Engineering investigation reveals line C's welding gun requires more frequent replacement—one-day engineering intervention (gun replacement schedule change) yields 14 percent OEE improvement equivalent to 84 additional vehicles per day produced.
See Your Production Line OEE Potential
Book a 30-minute demo showing real-time OEE tracking, bottleneck identification, and predictive maintenance alerts configured for your automotive production environment.
Digital Twin Architecture: How Real-Time Production Visibility Works
Digital twin technology integrates data from multiple sources, correlates patterns, and delivers actionable insights through machine learning. Understanding the architecture reveals why digital twins outperform traditional monitoring.
Sensors and controllers embedded in production equipment (robot controllers, stamping press sensors, paint booth monitors, welding guns) transmit real-time data on equipment state, production output, defects, and process parameters. Data integration gateways collect streams from PLC systems (Siemens S7, Allen-Bradley ControlLogix), SCADA platforms, MES systems, and IoT sensors. Data flows continuously to edge computing devices or cloud platforms at 1-second or 1-minute sampling intervals depending on sensor type. High-resolution data (vibration, temperature, pressure) samples at 10-100 Hz; lower-frequency data (production count, shift events) samples at 1-minute intervals. This multi-rate data collection captures equipment signatures with precision impossible through traditional monitoring.
Engineers build a digital model capturing the physical production line structure, equipment relationships, and process constraints. The model represents each robot, stamping press, conveyor, and sensor as a digital object with attributes (location, specifications, connections) and relationships (robot feeds stamped parts to assembly station feeds to welding station). The model is not static—it continuously synchronizes with live production floor data. As equipment operates, digital representations update in real-time with actual equipment state. Physical servo motor temperature maps to digital motor object temperature; actual part count increments match digital counter; equipment fault flags match digital alarms. This synchronization creates a "digital twin"—a true real-time replica of physical production systems.
Artificial intelligence models analyze digital twin data to identify patterns, anomalies, and predictive signals. Models are trained on historical production data (6 to 12 months of prior operation) establishing baseline equipment signatures. Deviation detection algorithms flag when equipment consumes 15 percent more power than baseline (indicating bearing wear), when vibration spectrum shifts (indicating misalignment), when temperature creeps above normal (indicating cooling failure). Predictive models trained on failure events predict remaining useful life—identifying equipment that will fail in 2-4 weeks with 85+ percent confidence. Performance optimization models identify bottleneck constraints and simulation of speed adjustments on specific equipment to calculate throughput impact. Quality root cause models correlate every defect with equipment parameters and environmental conditions at moment of defect, calculating statistical confidence that specific parameter caused defect.
Digital twin insights surface through real-time dashboards providing facility leadership, production managers, and equipment operators with actionable visibility. Plant floor dashboards display current line OEE, equipment state, and active alarms. Equipment-specific dashboards show actual operating point (pressure, temperature, speed) versus optimal range, equipment health score, and predicted remaining useful life. Maintenance dashboards prioritize work orders by risk (equipment predicted to fail within 48 hours ranked highest). Production optimization dashboards show bottleneck station, throughput simulation scenarios, and recommended equipment adjustments. Mobile applications deliver alerts to maintenance technicians when equipment approaches failure, enabling proactive scheduling. Email or text notifications to plant leadership alert to unexpected events requiring immediate intervention.
Digital twin systems transition from monitoring to active optimization through prescriptive recommendations and automated control. Machine learning models recommend specific actions (speed adjustment on bottleneck equipment, tool replacement, parameter tuning) with calculated impact on throughput and efficiency. Advanced systems implement recommended adjustments automatically (reducing pressure setpoint, adjusting conveyor speed, triggering tool change) within configured safety limits. Continuous optimization loops refine models and adjust parameters daily or hourly, adapting to material variations, tooling changes, and seasonal factors. Plants shift from static "run equipment at standard settings" to dynamic "continuously adjust settings for maximum efficiency."
OEE Improvement Mechanisms: How Digital Twins Drive 25% Improvement
Digital twin OEE improvement breaks into three mechanisms: downtime reduction through predictive maintenance, performance optimization through bottleneck elimination, and quality improvement through root cause prevention. Comprehensive digital twin deployments activate all three simultaneously.
Predictive maintenance through digital twin vibration, temperature, and electrical signature analysis detects equipment approaching failure 2-4 weeks in advance. Maintenance schedules robot arm bearing replacement during planned maintenance window rather than emergency response. Result: unplanned downtime events decrease from 6-8 per shift to 1-2 per shift. At typical automotive assembly scale, each prevented downtime event saves $15,000 to $50,000 in lost production plus emergency labor premium. 5 fewer unplanned events per month equals $75,000 to $250,000 monthly savings. Annual downtime reduction savings: $900K to $3M+ depending on plant size and baseline downtime rate.
Digital twin identifies bottleneck equipment constraining line throughput. Focused engineering on bottleneck station (speed adjustment, pressure tuning, parameter optimization) increases throughput without affecting quality. Simulation of speed changes predicts impact on downstream buffer and final line output before implementation. Typical result: 3-8 percent line throughput improvement. For 600-unit-per-day line, 5 percent improvement equals 30 additional units daily. At $2,700 revenue per vehicle and 40 percent contribution margin, 30 additional units daily equals $32,400 additional daily revenue, $9.7M annually. Performance optimization has zero capital cost and requires only engineering time.
Digital twin root cause analysis correlates every defect event with equipment parameters, process conditions, and environmental factors at time of defect. Pattern recognition identifies that paint defects correlate with humidity above 60 percent, welding gaps correlate with gun temperature exceeding 850C, tolerance violations correlate with tool hours exceeding 200. Root cause identification enables targeted prevention (humidity control, temperature setpoint adjustment, tool change timing). Defect rate reduction of 5-12 percent reduces scrap, rework labor, and warranty costs. 2 percent quality improvement on 600-unit-per-day line produces 12 additional vehicles saleable per day. Combined with scrap elimination (25 to 50 units scrap reduction per day) and warranty cost avoidance, quality improvement generates $400K to $1M+ annual impact. Tangible savings from eliminated rework labor adds additional value.
Automotive Plant Case Studies: Documented OEE Improvements
These case studies reflect actual automotive facilities implementing digital twin technology and achieving documented OEE improvements.
240,000 sq ft facility with four stamping press lines (4 presses each, 600 parts per press per day, 2,400 total daily capacity). Baseline OEE: 68 percent across all four lines. Deployed digital twin covering vibration analysis (bearing condition), temperature monitoring (thermal stress), and production analytics. Month 1-2 analysis identified stamping press #7 operating 12 percent below standard throughput with no downtime events—indicating performance loss. Digital twin model revealed press #7 dwelled 18 percent longer than other presses in die transition cycle. Investigation identified friction in press slide guide rails requiring lubrication. One-day maintenance (rail lubrication and calibration) improved press #7 throughput 15 percent. Predictive maintenance alerts identified three bearing failures in weeks 4-8, enabling scheduled maintenance versus emergency replacement (cost avoidance $180K+). Six-month OEE improvement: 22 percent (68% to 83%), equivalent to 360 additional parts daily. Annual impact: 130,000 additional parts produced, worth $4.7M in revenue at supplier margins.
Assembly line producing mid-size SUV (12-minute takt time, 400 units per day capacity, actual 286 per day due to downtime and defects). Baseline OEE: 72 percent. Primary constraint: 8.5 percent defect rate generating 24 vehicles per day requiring rework. Deployed digital twin correlating quality events with equipment parameters. Root cause analysis identified paint booth defects correlated with humidity above 65 percent and temperature below 18C (sub-optimal spray condition). Environmental control implementation (active humidity and temperature management) reduced paint defects 60 percent. Welding quality analysis identified welds from gun position 7-8 had 30 percent higher failure rate—revealing welding gun wear requiring replacement. Gun replacement reduced weld defects 55 percent. Assembly torque analysis identified bolts with insufficient preload indicating calibration drift in pneumatic nutrunner #3. Recalibration reduced assembly defects 40 percent. Six-month total defect rate improvement: 42 percent (8.5% to 4.9%), equivalent to 21 additional vehicles saleable per day. Combined with rework labor elimination, quality improvement generated $7.2M annual impact. OEE improvement: 18 percent.
Two body welding lines (60-second takt, 240 vehicles per hour capacity, actual 174 per hour baseline = 72.5% OEE). Baseline composition: 82% availability, 90% performance, 98% quality. Three-month comprehensive digital twin deployment addressing all components. Availability improvement: Predictive maintenance on 12 robot arms identified four bearing failures in weeks 6-10, enabling scheduled maintenance. Robot weld gun preventive replacement based on weld count (not calendar) reduced catastrophic failures 70 percent. Total unplanned downtime reduction from 36 minutes per shift to 12 minutes per shift (66% improvement). New availability: 88 percent. Performance improvement: Bottleneck analysis identified body indexing conveyor running 8 percent slower than rated speed (mechanical friction). Lubrication and speed calibration increased conveyor speed 8 percent. Downstream body positioning analysis identified 12-second buffer delay at assembly station due to part orientation inconsistency—fixture redesign eliminated delay. Weld gun positioning analysis identified 2-second average excess wait time per cycle due to jog sequence suboptimization—software sequence refinement saved 2 seconds per 60-second cycle. Combined performance improvements: 13 percent (90% to 97%). Quality improvement: Weld current monitoring identified torch condition degradation correlating with inconsistent weld appearance. Torch replacement interval optimization prevented 90 percent of quality defects. Final assembly dimensional analysis identified fixture wear causing 15 percent out-of-tolerance parts—fixture maintenance improved tolerance performance to 99.2 percent. Quality improvement: 6 percent (98% to 99.8%). Total OEE improvement: 88% × 97% × 99.8% = 85.3% OEE (from baseline 72.5% = 25% improvement equivalent). Production output improvement: 240 vehicles per hour baseline to 285 vehicles per hour (45 additional vehicles per hour). Daily output increase: 1,080 additional vehicles per day. Annual impact: 394,000 additional vehicles produced, worth $275M+ in revenue.
Unlock Your Production Line's OEE Potential
Automotive plants implementing digital twins achieve 12 to 25 percent OEE improvement through predictive maintenance, bottleneck elimination, and quality root cause prevention. Each 1 percent OEE improvement at typical automotive scale generates $2.7M in annual value through additional production capacity. Schedule a digital twin demo to see your facility's specific improvement potential.
Digital Twin Deployment Strategy: From Initial Assessment to Full Optimization
Digital twin implementation follows a phased approach enabling rapid value realization while managing organizational adoption and technical complexity.
Data integration engineers connect to PLC, SCADA, and MES systems, establishing continuous data flows to analytics platform. Historical production data is extracted (6-12 months prior operation) providing baseline for machine learning model training. Initial OEE analysis breaks facility performance into availability, performance, and quality components, identifying largest loss categories. Root cause assessment investigates downtime events, production bottlenecks, and quality defects. Deliverables: OEE breakdown by line/shift, identification of top 3-5 loss sources, and prioritized improvement roadmap. Value realized: Clarity into performance gaps and improvement priorities, typically enabling $200K to $800K in quick-win improvements identified during assessment.
Machine learning models trained on historical equipment sensor data (vibration, temperature, electrical current) establish equipment health baselines. Models are deployed to detect degradation patterns and predict remaining useful life of critical equipment (robot arms, servo motors, hydraulic systems). Predictive alerts are configured to trigger when equipment approaches failure threshold. Maintenance scheduling integrates predictive alerts into work planning, enabling proactive maintenance versus reactive emergency response. Early wins typically emerge weeks 6-8 when models identify approaching failures (bearing wear, seal degradation, fluid contamination). Preventive maintenance schedules are adjusted based on predictions. Phase 2 value: 15 to 20 percent unplanned downtime reduction, equivalent to $300K to $800K annual savings at typical automotive scale.
Digital twin production analytics identify bottleneck constraints—equipment operating at 95+ percent utilization while other stations operate 70-85 percent. Focused engineering on bottleneck equipment (speed adjustment, parameter tuning, mechanical friction reduction) increases throughput. Simulation capabilities enable testing of proposed changes in the digital twin before implementation on physical line. Implementation of 3-5 bottleneck-focused improvements typically yields 5 to 12 percent throughput increase with zero capital cost (only engineering labor). Phase 3 value: $400K to $1.2M annual revenue increase from additional production capacity.
Quality analytics correlate every defect event with equipment parameters, environmental conditions, and process settings at time of defect. Machine learning identifies statistical correlations (e.g., 85 percent of paint defects occur when humidity exceeds 65 percent). Root cause identification enables targeted prevention (install humidity control, adjust temperature setpoint, modify process parameter). Implementation of 5-10 quality improvement actions typically yields 8 to 15 percent defect rate reduction. Rework labor elimination and scrap reduction generate $200K to $600K annual impact. Phase 4 value: Quality improvement ROI extends to warranty cost avoidance and customer satisfaction improvements.
Advanced digital twins implement autonomous optimization—machine learning models continuously refine equipment parameters, adjust process settings, and recommend improvements on daily or hourly basis. Models adapt to material variations (different steel composition, paint batch variations), tooling changes (new pressing dies, updated weld gun), and seasonal factors (temperature and humidity effects on paint spray). Continuous optimization prevents OEE drift—maintaining improvements long-term rather than reverting to original settings over time. Autonomous closed-loop systems (e.g., adjusting weld current automatically based on real-time feedback) eliminate manual parameter adjustments. Phase 5 value: Permanent OEE improvement maintenance plus ongoing discoveries of new optimization opportunities.
Digital Twin ROI and Investment Economics
Digital twin implementation investments vary by facility size and complexity. ROI is achieved within 6 to 12 months through downtime reduction and performance improvement alone.
Digital twin platform software: $30,000 to $150,000 annually (cloud or on-premise). Data integration and PLC/SCADA connectivity: $20,000 to $60,000 one-time setup. Total first-year software investment: $50,000 to $210,000. Multi-year: amortize $30K-$150K annually.
Professional services for data integration, model development, and training: $40,000 to $120,000. Staff training and change management: $10,000 to $30,000. Typical total implementation cost: $50,000 to $150,000 (4-8 weeks duration).
Additional sensors (vibration, temperature, pressure): $5,000 to $25,000 depending on equipment coverage. Edge computing devices or gateway servers: $5,000 to $20,000. Network infrastructure upgrades: $5,000 to $15,000. Typical hardware investment: $15,000 to $60,000.
Software, implementation, and hardware: $115,000 to $420,000 total. Typical mid-size automotive facility (4-6 production lines): $150,000 to $250,000 total investment.
Downtime reduction (6-month payback for large facilities): $400K to $1.2M annual. Performance improvement (throughput increase): $400K to $2M annual. Quality improvement (defect reduction + warranty avoidance): $200K to $600K annual. Total annual benefits: $1M to $3.8M depending on baseline performance and facility size.
Conservative case (20 percent OEE improvement, mid-size facility): $1M annual benefits on $200K investment = 2.4x annual ROI, 1-year payback. Aggressive case (25+ percent OEE improvement, large facility): $2.5M annual benefits on $250K investment = 10x annual ROI, 1.2-month payback. Typical case: 4 to 8x annual ROI, 6 to 12 month payback.
Digital Twin Implementation Challenges and Organizational Requirements
Successful digital twin deployment requires more than technology—organizational alignment, data governance, and change management determine whether improvements are achieved and sustained.
Production data quality varies—some systems provide clean, reliable data while others have gaps, errors, or inconsistent formats. PLC systems use different protocols (Modbus, Profibus, MQTT) requiring custom integration. Legacy MES systems may lack modern APIs requiring middleware. Solution: Professional services for data quality assessment, integration architecture design, and rigorous testing before full deployment. Budget 2-4 weeks for data integration in complex multi-system environments.
Production floor personnel accustomed to manual decision-making may resist automation recommendations. Engineers may distrust machine learning predictions without understanding underlying logic. Maintenance teams may feel threatened by predictive maintenance (fear of job elimination). Solution: Structured change management including executive sponsorship, shop floor communication explaining technology benefits, engineer training on model interpretation, and early wins demonstrating value. Predictive maintenance reduces emergency work (not total maintenance), freeing technicians for planned maintenance and improvements.
Initial machine learning models achieve 75-85 percent accuracy in prediction and root cause identification. Accuracy improves as models accumulate more historical data (months 2-6 of operation). False alarm rates decline from initial 20-30 percent to under 5 percent after several months as algorithms learn equipment-specific behavior. Solution: Establish metrics tracking model accuracy, false alarm rates, and prediction success rates. Implement feedback loops where operators/engineers confirm or correct model predictions, continuously retraining models. Expect accuracy improvement trajectory from 80 percent (month 1) to 92+ percent (month 6) with proper feedback loop discipline.
Industrial environments traditionally had minimal IT infrastructure and cybersecurity protections. Adding continuous data collection from production equipment raises cybersecurity concerns (data breach exposing production secrets, ransomware disrupting manufacturing). Solution: Implement proper IT governance including network segmentation separating production data from corporate network, data encryption, access controls, and security monitoring. Engage IT security teams early in planning. Budget 10-15 percent of digital twin investment for security infrastructure.
Frequently Asked Questions: Digital Twin OEE Improvement
Transform Your Automotive Production Line with Digital Twin Intelligence
Automotive plants implementing comprehensive digital twins achieve 12 to 25 percent OEE improvement within 6 to 12 months through predictive maintenance, production optimization, and quality root cause prevention. Each 1 percent OEE improvement generates $2.7M in annual value at typical automotive scale. Begin with a diagnostic assessment to identify your facility's specific improvement potential and phased implementation roadmap.
Digital Twin Deployment Comparison: On-Premise vs. Cloud Architectures
Digital twin systems can deploy on-premise (within facility network) or cloud-based (external hosting). Each architecture has benefits and tradeoffs.
| Capability | On-Premise Digital Twin | Cloud-Based Digital Twin |
|---|---|---|
| Data Security & Control | All data stays within facility network; proprietary process information never leaves site; maximum data security control | Data stored in external cloud (vendor-managed); encryption and access controls provided; regular security audits; compliance frameworks (ISO 27001, SOC 2) |
| Uptime & Reliability | Depends on facility IT infrastructure; requires redundancy planning and backup systems; single-site failure risk | Enterprise-grade uptime (99.9%+ availability); automatic failover and disaster recovery; geographically distributed redundancy |
| Scalability | Limited by facility hardware investment; scaling requires capital expenditure; difficult for multi-site deployments | Unlimited scalability; pay-as-you-grow model; easily extends to multi-site portfolios; same infrastructure for 1 line or 100 lines |
| Integration Complexity | Direct network connectivity to PLC/SCADA; lower latency; fewer integration layers required | Data transmission via internet connection; requires secure VPN; slight latency (10-100ms typical); well-established cloud integration patterns |
| Initial Capital Cost | Higher: $50K-$150K server hardware + infrastructure setup | Lower: $10K-$30K initial setup; ongoing SaaS subscription model |
| Ongoing Operating Cost | Lower after initial investment: $500-$2,000/month maintenance and support | Higher: $3,000-$10,000/month SaaS subscription depending on scale; data transmission costs |
| Multi-Site Portfolio | Challenging: requires replica infrastructure at each site or centralized data collection; network bandwidth requirements | Native capability: single cloud platform manages unlimited sites; centralized dashboard with site-level filtering |
| Typical Selection | Single-site facilities with strong IT infrastructure and data security requirements; long-term deployment horizon | Multi-site operations, rapid deployment priority, limited IT resources, flexibility to scale over time |
Regional Automotive Market Factors: Digital Twin Deployment Considerations
Digital twin ROI varies by region depending on labor costs, equipment investment levels, and regulatory requirements.
| Region | Market Characteristics | Digital Twin Priority |
|---|---|---|
| North America | High labor costs ($45-65/hour total cost), aging equipment fleet, high downtime tolerance due to inventory buffers, demand for Industry 4.0 capability | High priority: Downtime reduction and predictive maintenance ROI strong. Equipment optimization valuable. Digital twin supports OEM upgrade initiatives. |
| Western Europe | Very high labor costs ($55-75/hour), premium brand focus on quality, strict data protection (GDPR), sustainability reporting requirements | Very high priority: Quality improvement ROI exceptional. Digital twin supports GDPR compliance and sustainability tracking. On-premise deployments preferred. |
| Mexico / Central America | Lower labor costs ($8-15/hour), rapid capacity expansion, newer facility equipment, limited IT infrastructure at many sites | Medium priority: Throughput optimization more valuable than labor cost reduction. Cloud deployments ideal for overcoming IT constraints. Quick-win improvements focus. |
| India / Southeast Asia | Low labor costs ($3-8/hour), rapid facility expansion, legacy equipment common, strong engineering talent availability | Medium-high priority: Equipment optimization and reliability improvements valuable. Local engineering resources support customization. Cloud deployments overcome infrastructure gaps. |
| China | Moderate labor costs ($10-20/hour), newest equipment at major OEM facilities, government investment in smart manufacturing, data sovereignty requirements | Very high priority: Government support for smart manufacturing makes digital twin standard. On-premise or Chinese cloud infrastructure required for data localization. |
Achieve 12-25% OEE Improvement Through Digital Twin Innovation
Digital twin technology delivers 12 to 25 percent OEE improvement in automotive manufacturing through predictive maintenance, production optimization, and quality root cause prevention. Each 1 percent OEE improvement generates $2.7M in annual value at typical automotive production scale. Schedule a diagnostic assessment to identify your specific improvement potential and phased implementation roadmap.


.png)