An electric vehicle powertrain integrates motor, inverter, gearbox, and battery management system into a tightly coupled mechatronic assembly. A single design iteration requires 12-18 months of physical prototyping, dyno testing, and thermal validation. Each prototype costs $180,000-300,000. Thermal runaway during high-power discharge must be predicted and prevented. Motor efficiency curves across full operating range must be optimized. Gear durability under electric torque pulses must be verified. Battery pack thermal distribution must be balanced across 100+ cells in parallel. A physical test campaign for a new powertrain architecture requires 6-8 complete prototype vehicles, 2,000+ hours on dynamometer testbeds, and 18-month calendar duration. Book a demo to see how iFactory's digital twin platform accelerates EV powertrain development.
EV Powertrain Development Challenge: Physics Complexity, Timeline Pressure, Cost Explosion
Electric vehicle powertrain development is exponentially more complex than internal combustion engine powertrains. ICE powertrains are thermal machines with decades of design experience. EV powertrains are mechatronic systems combining high-speed electric motors (up to 20,000 RPM), power electronics (inverters switching at kHz frequencies), mechanical reduction gearboxes (optimized for electric torque characteristics), and battery thermal management (cell-to-cell temperature variation critical). Each component exhibits interdependencies. Motor efficiency varies with inverter switching frequency and battery voltage. Thermal behavior of motor winding depends on gearbox mechanical losses. Battery pack temperature distribution depends on motor cooling strategy. Traditional sequential testing (design → prototype → dyno test → field trial) takes 18-24 months and costs $3-5M per powertrain variant. OEMs racing to market cannot afford this timeline.
Battery packs with 100+ cells in parallel develop temperature gradients of 5-15°C under fast charging or high-power discharge. Cell-to-cell temperature imbalance accelerates degradation and fire risk. Inverters dissipate 2-5% of power as heat — placement affects motor thermal profile. Motor windings must stay below 180°C to preserve insulation life. No single physical test can validate all thermal scenarios without 200+ instrumented test vehicles.
Motor efficiency depends on speed, torque, inverter switching frequency, and battery voltage. WLTP and EPA test cycles sample only 10% of possible motor operating points. Real-world driving encounters constant transients — acceleration, deceleration, thermal cycling. Optimizing efficiency across all real-world scenarios requires virtual exploration of 10,000+ operating points. Physical dyno testing covers at most 200 points.
EV drivetrains deliver full torque instantly at zero speed — 0 to 500 Nm in milliseconds. ICE powertrains build torque gradually. Gearbox bearing loads, gear tooth stress, and shaft deflections are 2-3x higher than ICE equivalents. Predicting gear durability requires simulation of 1 million gear mesh cycles under electric torque profiles. Physical testing to failure takes 6-12 months. Simulation predicts failure mode in weeks.
EV platforms iterate rapidly. Battery chemistry changes every 18-24 months (NCA → NMC → LFP). Motor speeds increase (6,000 RPM → 10,000 → 20,000). Gearbox ratios optimize for new battery capacity. Each variant requires new thermal validation, efficiency testing, durability assessment. Physical prototype builds take 4-6 months per variant. Digital twins enable variant exploration in weeks.
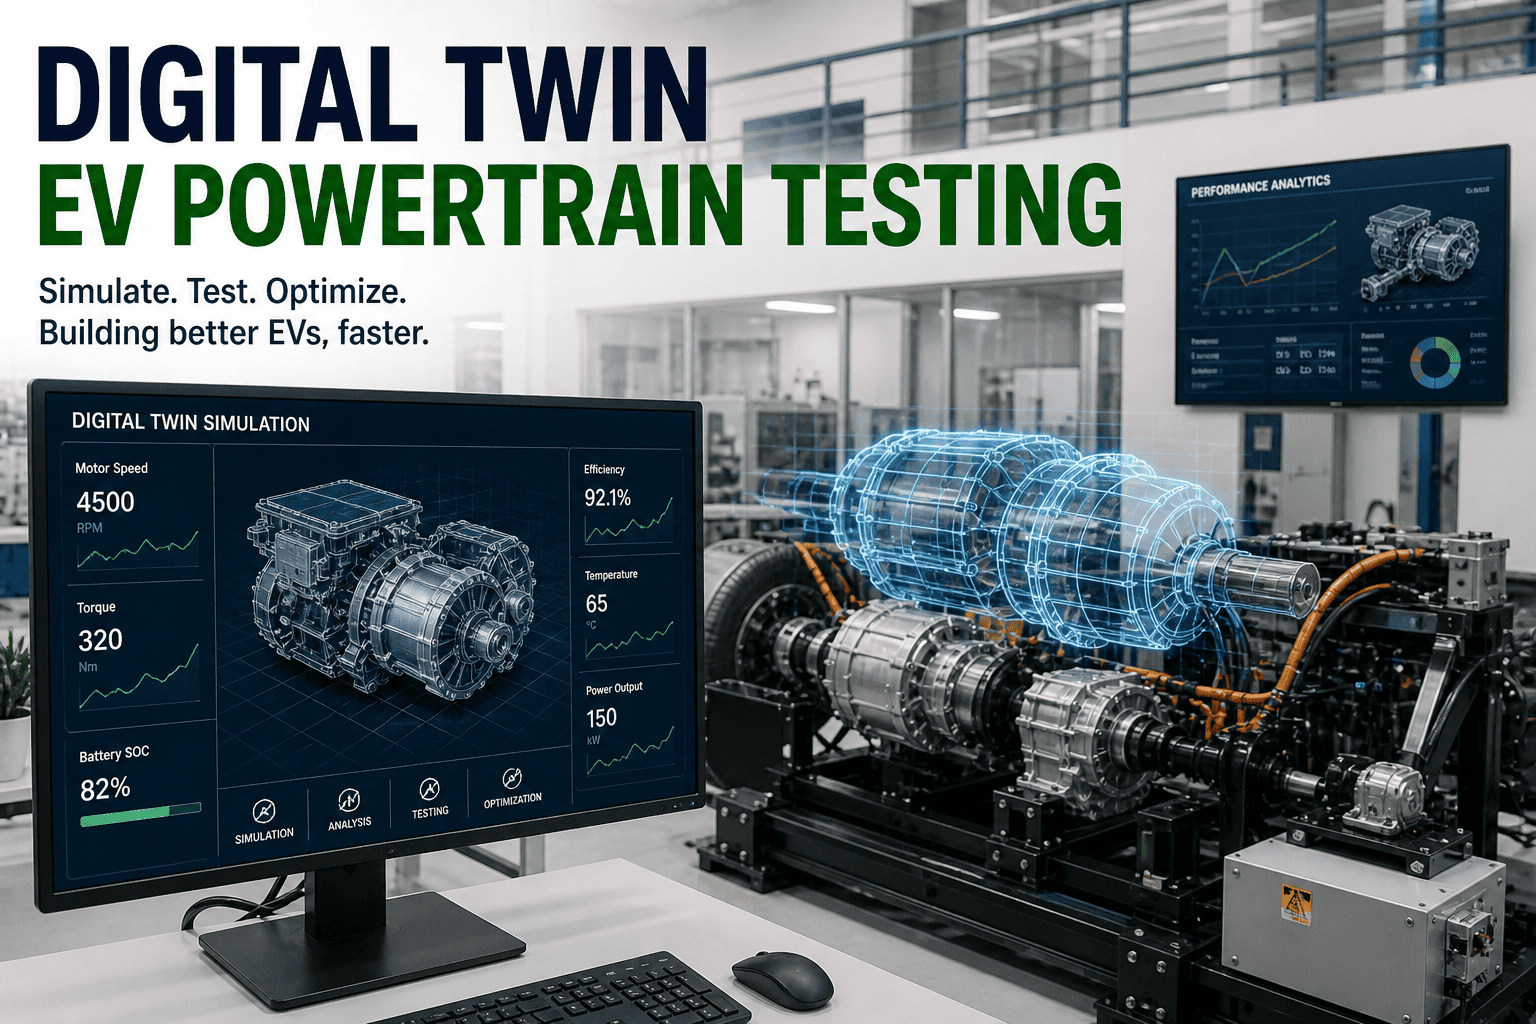
EV Powertrain Architecture: Motor, Inverter, Gearbox, Battery Thermal Interplay
A modern EV powertrain integrates five core subsystems, each generating complex physics that influences others. Motor performance depends on inverter characteristics. Thermal behavior depends on all five. Digital twins must capture physics fidelity while remaining computationally tractable enough for rapid iteration.
Typically 150-300 kW peak power, 8,000-20,000 RPM max speed. Efficiency varies 85-98% across operating range. Winding losses (copper) scale with current squared. Iron losses (hysteresis, eddy current) scale with speed and flux density. Rotor thermal time constant 5-15 seconds. Maximum winding temperature limit 180°C (insulation class H). Digital twin models torque-speed characteristic, efficiency map, and transient thermal behavior.
Switches battery voltage (up to 800V) at 10-20 kHz to drive motor current sinusoidally. Switching losses (turn-on, turn-off, body diode) dominant at high frequency. Conduction losses (on-state resistance) dominant at high current. Heat dissipation requires active cooling — liquid loop or direct immersion. Junction temperature limits 150-175°C. Digital twin predicts switching loss as function of current, voltage, and temperature.
Transfers motor torque to wheels at lower speed, higher torque. Bearing preload and gear mesh stiffness affect NVH and efficiency. Gear contact stress must stay below 1,400 MPa (limit for MnS steel) to prevent micropitting. Gear mesh damping affects vibration transmission. Gearbox losses 4-8% at high power. Digital twin models elastic deformation, contact stress, and fatigue damage accumulation.
100-150 cylindrical or pouch cells in parallel modules. Cell-to-cell thermal resistance varies with cell contact pressure and interface material. Coolant flow distribution across pack modules affects temperature uniformity. Cell terminal resistance generates heat during charge/discharge. Thermal runaway propagation risk if cell-to-cell temperature delta exceeds 10°C. Digital twin predicts temperature distribution, cooling effectiveness, and thermal runaway propagation.
Interconnects motor, inverter, battery, cooling pump, and accessories. Copper conductor sizing affects I²R losses and thermal rise. Connection resistance (crimp, solder) affects efficiency and generates hotspots. Shield effectiveness limits EMI radiation. Digital twin models current distribution and loss generation across all conductors and junctions.
Physics-Based Digital Twin Approach: Predicting Real-World Behavior Before Hardware
A physics-based digital twin models the underlying physics equations (Maxwell's equations for electromagnetic behavior, Fourier's law for heat transfer, Newton's laws for mechanics) rather than fitting empirical data to black-box models. This enables generalization beyond the test data — predictions of performance at operating points never tested physically. AI augmentation refines predictions as real test data accumulates.
Input: Motor geometry (stator/rotor dimensions, winding configuration, magnet material properties), inverter voltage/frequency, load torque, coolant temperature.
Output: Torque-speed curve, efficiency map, winding temperature, rotor temperature, magnetic flux distribution.
Physics: Finite element analysis (FEA) of magnetic field, coupled to thermal and mechanical solvers. Validates against motor dyno data (5-10 test points).
Input: Battery voltage, motor current demand, inverter switching frequency, MOSFET/IGBT parameters, heatsink thermal resistance.
Output: Switching losses, conduction losses, junction temperature rise, thermal time constant.
Physics: Detailed switching transient analysis, semiconductor physics models (charge storage, body diode behavior). Validated against inverter thermal bench testing.
Input: Gear geometry, material properties, bearing preload, input torque (from motor), speed ratio, lubrication viscosity and temperature.
Output: Gear tooth contact stress, bearing load, mesh damping, gear loss generation, predicted fatigue life.
Physics: Hertzian contact stress analysis, Miner's fatigue rule, tribological loss models. Validated against gearbox dyno data.
Input: Cell arrangement and spacing, cell internal resistance (chemistry-dependent), discharge current, ambient/coolant temperature, coolant flow rate.
Output: Cell-by-cell temperature distribution, coolant temperature rise, thermal hotspot locations, thermal runaway risk prediction.
Physics: Transient heat conduction (3D CFD for coolant, 1D conduction for cells), electrochemistry (cell resistance temperature coefficient). Validated against battery calorimetry tests.
Input: Complete powertrain architecture (all 5 subsystems), driving cycle (EPA, WLTP, real-world telemetry).
Output: End-to-end efficiency, thermal management feasibility, component temperature predictions, range estimate, design margin assessment.
Physics: Coupled multiphysics simulation. Motor drives inverter through load. Inverter loss heats coolant. Coolant cools motor and battery. Motor efficiency determines battery discharge rate.
Input: Real test data from motor dyno, battery thermal bench, gearbox test, vehicle field data.
Output: Updated model parameters, refined predictions, confidence intervals on predictions.
AI: Machine learning calibrates physics model to test data without overfitting. As more variants are tested, AI learns systematic model error and applies corrections.
How iFactory Enables Physics-Based Digital Twin Development
iFactory provides integrated physics models for motor (induction, PM, reluctance), inverter (SiC, IGBT, hybrid), gearbox (spur, helical, NVH effects), and battery thermal (cell-level, pack-level, thermal runaway). Models are parametric — configure once with your bill of materials, simulate across thousands of operating points instantly.
Design teams optimize for conflicting objectives: maximize efficiency (lighter motor, fewer turns), minimize temperature (larger heatsinks, more coolant), maximize durability (stiffer gearbox, larger bearings), minimize cost (smaller components, cheaper materials). iFactory's AI explores Pareto frontier — design variants that balance all objectives. Typically identifies 3-5 variants worth prototyping, eliminating 90% of candidates that would fail.
Powertrain behavior varies dramatically across driving cycles. EPA city cycle (low speed, frequent acceleration) favors efficiency at high torque. WLTP motorway (constant speed, light load) favors efficiency at low torque. Real-world driving (erratic, thermal transients) stresses thermal management. iFactory simulates across 10+ standard cycles plus customer-provided real-world telemetry. Identifies performance gaps missed by standard tests.
Traditional validation builds 30-50 instrumented prototype vehicles, accumulates 5,000+ hours of durability testing to establish that thermal management works. iFactory predicts thermal behavior with 2-3 prototype vehicles for calibration. Simulations predict cell-level temperature in 300+ real-world scenarios. Confidence interval on predictions shrinks with each prototype tested. Typically eliminates 15-20 prototype builds per program.
Gearbox durability is traditionally proven through 300-500 hour "torture test" on dynamometer — accelerated wear testing under extreme torque pulses. Failure point establishes gear and bearing design margin. iFactory predicts gear wear rate, bearing fatigue life, and failure mode through multibody dynamics simulation coupled to contact stress and material fatigue models. Reduces physical durability testing from 500 hours to 50 hours (validation only).
When battery chemistry changes (NCA → NMC → LFP), thermal characteristics shift dramatically. LFP cells have different internal resistance and thermal runaway behavior. iFactory recalibrates battery thermal model, re-simulates pack thermal performance across all scenarios, identifies cooling strategy updates needed. New motor design (higher speed, higher power density) requires re-analysis of electromagnetic, thermal, and mechanical behavior. iFactory enables rapid variant exploration — typically 4-6 weeks vs 6-12 months with physical builds.
Once vehicles enter production, real-world data (battery telemetry, motor temperature, inverter performance) flows back to iFactory. AI refines digital twin based on actual field performance. Systematic model error identified and corrected. Confidence in predictions improves with each vehicle variant deployed. Next generation design benefits from thousands of vehicle-hours of real-world validation.
Why iFactory is Different: Purpose-Built for EV Powertrain Engineering
Generic CAE tools (ANSYS, COMSOL, Simulink) require 4-8 weeks of model setup, parameter tuning, and validation before first useful predictions. iFactory's parametric models launch in days. Powertrain specifications input once. Simulation results generated immediately. No need to rebuild geometry or write new equations.
Generic CAE treats motor as black box (torque input, speed output). iFactory models motor electromagnetics, transient thermal behavior, and inverter-motor coupling. Gearbox models include electric torque pulse effects (not present in ICE). Battery thermal model includes cell-to-cell variation (critical for EV, not relevant for ICE). Every model built for EV-specific phenomena.
Engineering teams balance efficiency, thermal, durability, and cost. Most CAE tools optimize single objective. iFactory explores Pareto frontier automatically. Identifies design space regions where small trade-offs deliver large wins (lose 1% efficiency, gain 10°C thermal margin).
Once vehicles deploy, iFactory incorporates real-world performance data. AI refines model predictions. Next generation powertrain benefits from actual field validation of previous design. Most CAE tools cannot incorporate real-world data — predictions remain static once frozen.
Development Timeline Compression: 18 Months to 10-12 Months
AI Implementation Roadmap: 6-Step Path to Physics-Based Digital Twin
Gather motor geometry (stator/rotor dimensions, winding specs, magnet properties). Document inverter component values (MOSFET parameters, gate drivers). Specify gearbox (gear form, bearing types, lubrication). Input battery cell specs (chemistry, capacity, internal resistance).
Run motor dyno test across 50-100 operating points (torque-speed sweep). Measure winding temperature, rotor temperature. Use data to calibrate motor thermal model. Run inverter loss bench test. Calibrate power loss model. Similar for gearbox (loss measurement) and battery (thermal calorimetry).
Integrate motor, inverter, gearbox, and battery models into single system simulation. Validate against vehicle baseline data (if existing model exists). Predict end-to-end efficiency, thermal behavior, component temperatures across standard driving cycles.
Define optimization objectives (maximize efficiency, minimize thermal peaks, ensure durability, minimize cost). Run parametric design space exploration. iFactory's AI identifies Pareto-optimal designs — variants worth prototyping. Eliminates dead-end designs.
Build 2-3 selected design variants from optimization. Run dyno and thermal testing on prototypes. Collect real performance data. Compare to digital twin predictions. Refine model parameters based on discrepancies. AI learns systematic model error and applies corrections.
Deploy vehicles with telemetry. Real-world performance data feeds back to digital twin. AI refines predictions for next generation. Field issues traced to root cause via digital twin. Systematic improvements flow into future designs.
ROI Timeline: Cost Savings and Schedule Acceleration Within 12 Weeks
Real-World Impact: Digital Twin Success in EV Powertrain Development
Use Case 1: Tier 1 Supplier — Motor Winding Thermal Optimization Without 30+ Prototypes
A tier 1 automotive supplier developing next-generation motor for EV platform needed to reduce peak winding temperature by 8°C (design margin issue) while maintaining efficiency above 95%. Traditional approach: build 35 motor variants with different winding configurations, slot fill factors, cooling channel geometries. Physical dyno test each. Time: 18 weeks. Cost: $1.6M prototype builds.
Using iFactory digital twin, supplier built electromagnetic + thermal model of motor, calibrated against 3 prototype motors (8 weeks). Then ran parametric optimization across 2,000 possible winding and cooling configurations. AI identified 8 Pareto-optimal variants (high efficiency, low temperature). Built only 5. Tested them. Found one variant meeting all specs with 2°C additional margin. Total time: 12 weeks. Cost: $200K. Schedule compression: 6 weeks. Cost savings: $1.4M.
Use Case 2: OEM Battery Thermal Management — Predicting Cell Hotspot Without Field Failures
An OEM launching new EV platform with 100 kWh battery pack needed to validate that cell-to-cell temperature variation stayed below 10°C during fast charging. Field testing (first 5,000 vehicles) would reveal thermal issues only after purchase. Digital twin: 3D CFD model of battery pack with 144 cells, coolant flow paths, thermal interface materials. Simulation predicted worst-case temperature distribution across 30+ fast-charge scenarios (ambient temp -20 to 60°C, charge rate 10% to 100%).
Result: Digital twin identified thermal hotspot on pack edge (predicted 12°C cell-to-cell delta under high-ambient fast charge). OEM redesigned coolant flow distribution and added local cooling channel before prototype build. First field vehicles showed measured delta of 8°C — matching digital twin prediction. No thermal issues. Field failure risk prevented. Time savings: OEM avoided 9-12 month investigation cycle. Cost savings: prevented battery thermal runaway incident and warranty replacement program (potential $50M+ cost).
Use Case 3: Gearbox Durability Prediction — Eliminating 200-Hour Torture Tests
A powertrain supplier designing single-speed reduction gearbox for EV needed to prove durability under electric torque pulses (0-500 Nm in <100 ms). Traditional validation: 500-hour accelerated durability test on dynamometer with electric torque profile. Cost: $80K. Time: 12 weeks. Digital twin approach: multibody dynamics simulation of gearbox under electric torque pulses, coupled to contact stress and material fatigue models. Simulation predicted gear wear rate and predicted failure point.
Physical testing (50 hours) validated simulation predictions. Measured wear matched simulation within 8%. Gearbox design proved durable. Time savings: 10 weeks. Cost savings: $60K (avoided full 500-hour test). Additional benefit: simulation identified micro-pitting risk on bearing outer race under certain transient conditions. Design was refined (bearing preload increase) before prototype build. Field durability improved.
Competitor Comparison: Digital Twin Platforms for EV Powertrain
| Capability | iFactory | ANSYS Fluent/Mechanical | COMSOL | Simulink/SimDriveline | Custom In-House |
|---|---|---|---|---|---|
| Motor EM + Thermal Model | Purpose-built for EV motors, parametric setup | Generic mechanical, requires custom EM setup | Powerful but steep learning curve | Transient only, limited EM physics | Labor-intensive, uncertain physics fidelity |
| Inverter Loss Model | SiC/IGBT switching loss & junction temperature | Not included, requires custom development | Possible but not standard | Simplified loss model only | Often inaccurate or incomplete |
| Gearbox Durability Model | Contact stress + fatigue, EV torque pulse effects | Possible via FEA, 8-12 week setup per design | Possible, steep learning curve | Kinematics only, no detailed mechanics | Usually conservative, over-designs |
| Battery Thermal (Cell-to-Cell) | 3D CFD pack + 1D cell thermal runaway | CFD possible but 4-6 week setup per geometry | CFD possible, complex setup | 1D thermal only, no CFD | Often lumped-parameter, inaccurate |
| Multi-Objective Optimization | Automatic Pareto frontier exploration | Manual iteration required | Manual iteration required | Design space exploration possible but labor-intensive | Manual design iteration only |
| Time to First Prediction | 2-4 weeks (parametric, minimal setup) | 8-12 weeks per design variant (geometry required) | 6-10 weeks (modeling required) | 4-6 weeks (if already in Simulink) | 16-24 weeks (development + validation) |
| Field Data Integration & AI Learning | Native AI refinement, automatic parameter updating | Not available (static simulation) | Not available (static simulation) | Manual refinement required | Manual refinement required |
| EV Powertrain Specialization | Purpose-built for EV motor, inverter, gearbox, battery | Generic CAE, no EV-specific models | Generic multiphysics, no EV models | Generic controls/dynamics, no EV physics | Often ICE-centric, EV adaptations ad-hoc |
EV Powertrain Testing by OEM Platform Segment
| Powertrain Segment | Development Challenge | Digital Twin Application | Typical Benefit |
|---|---|---|---|
| Premium/Performance EV (300+ kW, High Speed) | Motor efficiency at 15,000+ RPM, thermal control under sustained high power, inverter SiC switching optimization | EM + thermal coupling, inverter loss optimization, coolant flow CFD across high-power scenarios | Range improvement 8-12%, peak temperature reduction 15°C, efficiency peak shift to real-world operating points |
| Mass-Market EV (150-200 kW, Efficiency Focus) | Cost reduction without sacrificing efficiency or thermal margin, gearbox optimization for efficiency, motor design for low-speed torque ripple minimization | Cost-performance optimization trades (smaller motor, derated inverter, simplified cooling), gearbox ratio optimization across WLTP + real-world cycles | BOM cost 8-12% reduction, efficiency 3-5% gain, no design validation cycle delay |
| Commercial Vehicle EV (50-100 kW, Rugged, Long Life) | Component durability over 500K-1M mile life, thermal management without frequent maintenance, predictable degradation for fleet operators | Long-term thermal cycling simulation (1M cycles), bearing fatigue under duty cycles, battery calendar degradation correlation | Predicted durability 5-year life confidence, warranty cost reduction 25-40%, fleet operator satisfaction (no surprise failures) |
Frequently Asked Questions
Physics-based digital twins typically predict motor efficiency within 1-2%, thermal behavior within 2-3°C, and gearbox durability within 8-10%. Accuracy improves with calibration data. After 2-3 prototype builds, systematic model error is identified and corrected. iFactory's AI applies these corrections to future variants automatically.
No. Digital twins eliminate 60-80% of prototype builds (validation prototypes only, not discovery prototypes). Physical testing validates digital twin accuracy and certifies performance for production. Typical program: 2-3 prototype builds for calibration, 5-10 for final validation, vs 30-50 without digital twin.
Yes. Digital twin models are parametric. Battery chemistry change (NCA to LFP): update cell thermal properties and internal resistance parameters, re-calibrate with 2-3 bench tests. Motor topology change (PM to induction): update electromagnetic parameters, re-calibrate with motor dyno. Typically 4-6 weeks per major component change.
iFactory includes EPA, WLTP, CLTC, and custom drive cycles. Thermal scenarios span ambient temperature -30 to +60°C, high-altitude operation, fast-charge transients, sustained high-speed driving, cold-soak startup. Over 50 standard scenarios plus customer-provided telematics data from real vehicle fleets. Book a demo to customize scenarios for your platform.
iFactory accepts geometry exports from CAD (STEP, IGES), integrates with ANSYS Fluent/Mechanical via data exchange, connects to vehicle simulation platforms (Simulink, IPG CarMaker, TESIS vsDYN) via FMI/FMU standards. Data flows both directions — powertrain parameters feed vehicle simulation, vehicle loads feed powertrain optimization.


.png)