Automotive manufacturers implementing digital twins reduce unplanned downtime by 34% and increase equipment OEE by 18% within 6 months. A production line digital twin captures real-time data from PLCs, SCADA systems, and MES platforms, enabling predictive maintenance, process optimization, and compliance tracking before failures occur. Book a demo to see how iFactory builds digital twins for your assembly lines and robotic systems.
34%
Reduction in unplanned downtime within 6 months of digital twin deployment
18%
OEE improvement through real-time process optimization and anomaly detection
$2.1M
Average annual savings per plant from predictive maintenance and supply chain optimization
8 wks
Typical deployment timeline for data integration, asset configuration, and AI setup
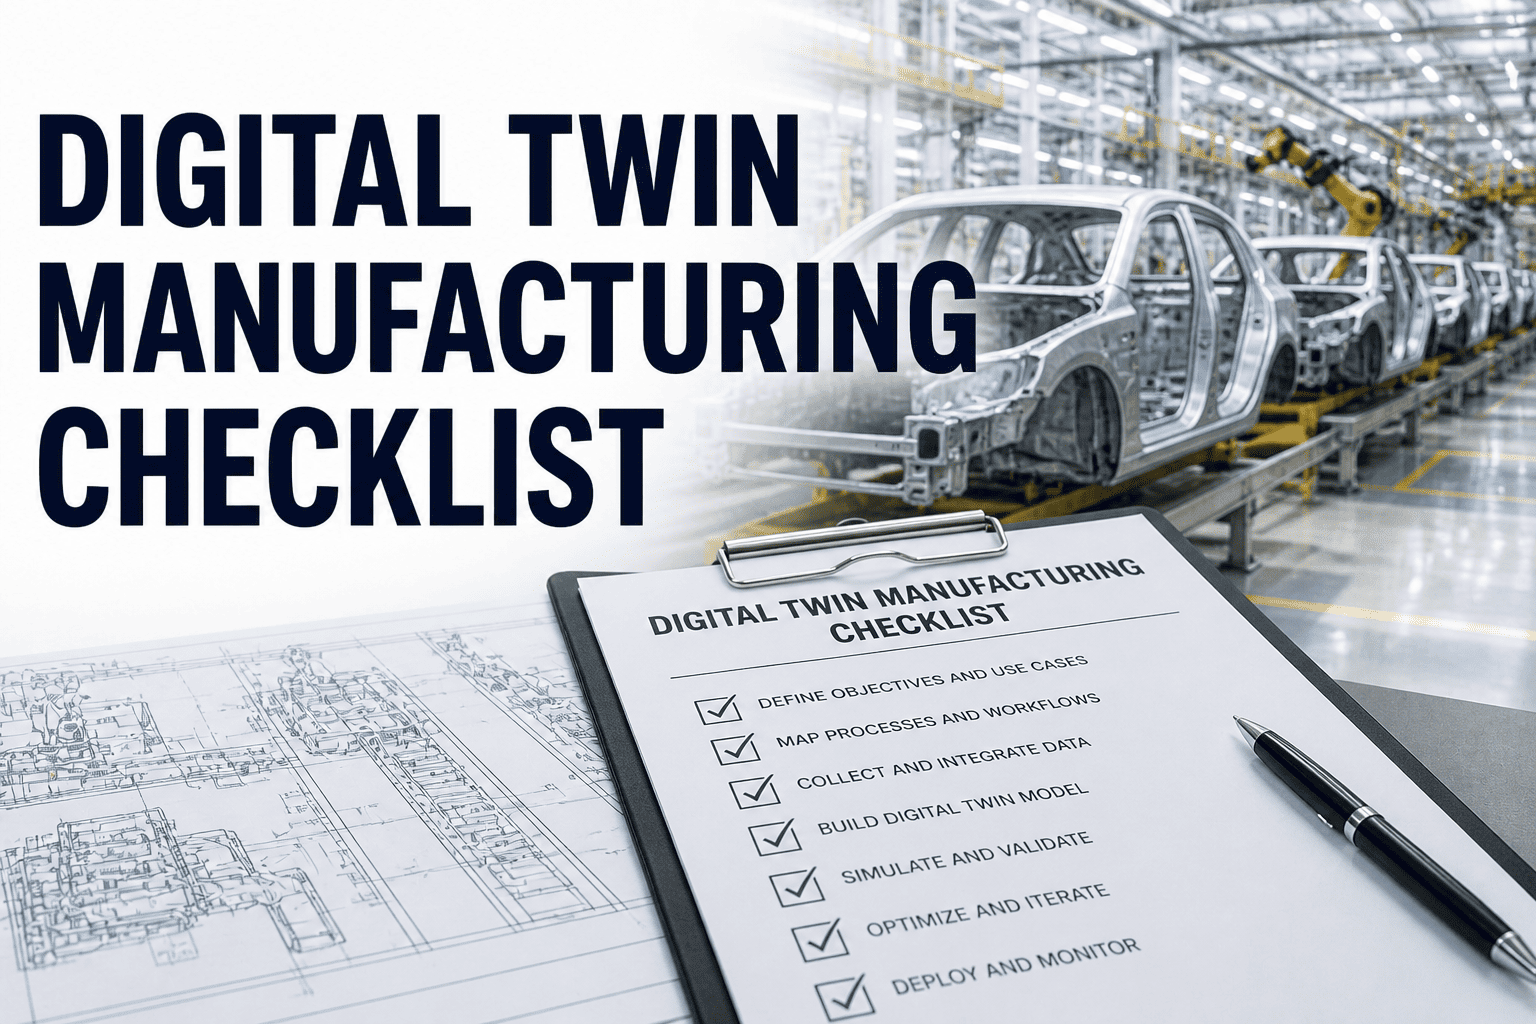
Digital Twin Checklist Scope
A manufacturing digital twin synchronizes live production data with a real-time simulation model covering equipment condition, process parameters, throughput, and supply chain status. This checklist covers five implementation phases: data integration, asset hierarchy setup, sensor configuration, AI model training, and live monitoring deployment. Each phase includes critical success criteria, integration validation steps, and deployment gates.
Digital twin accuracy depends entirely on data fidelity. Your production line generates hundreds of real-time signals from PLCs, SCADA systems, and MES platforms covering equipment status, cycle times, temperature, pressure, vibration, throughput, and downtime events. Phase 1 establishes the data pipeline before any simulation or AI model is built. Book a demo to see how iFactory integrates your specific SCADA and MES architecture.
PLC and SCADA Connection Setup
MES Integration and Work Order Data
Data Quality and Validation
Phase 2 — Asset Hierarchy and Equipment Master Data
Every sensor and control signal belongs to a specific piece of equipment. Your digital twin simulation requires a structured asset hierarchy mapping equipment genealogy (plant line station robot gripper sensor) with technical specifications, maintenance intervals, performance baselines, and compliance requirements. A poorly organized asset hierarchy causes wrong signals to be correlated, making the digital twin unreliable. Book a demo to see how iFactory structures multi-level asset hierarchies for your production lines.
Equipment Classification and Master Data
Sensor Inventory and Signal Mapping
Phase 3 — Sensor Configuration and Signal Processing
Raw sensor data is noisy. A thermistor reading may fluctuate 2 degrees within seconds due to environmental variation. Vibration sensors contain both meaningful machine degradation signatures and electrical noise. Digital twins require signal conditioning and feature engineering to separate real process anomalies from sensor noise. Phase 3 establishes real-time signal processing pipelines that feed clean data to simulation and AI models.
Signal Conditioning and Filtering
Feature Engineering for AI Models
Alert Thresholds and Fault Detection
Build Your Digital Twin in iFactory — Real-Time Data Integration at Scale
Phase 4 — AI Model Training and Predictive Maintenance
With clean data and structured asset hierarchies in place, AI models can now learn equipment degradation patterns. Machine learning algorithms analyze the correlation between sensor readings, cycle times, temperature trends, and actual equipment failures documented in maintenance work orders. The goal is to identify anomaly signatures 7 to 30 days before failure occurs, allowing predictive maintenance scheduling instead of reactive repairs.
Historical Data Preparation for Training
Model Development and Validation
Predictive Maintenance Roadmap
Phase 5 — Live Digital Twin Deployment and Optimization
With data pipelines validated, asset hierarchies complete, signals conditioned, and AI models trained, your digital twin now goes live to production. Real-time monitoring dashboards display equipment condition, anomaly scores, and remaining useful life predictions. Simulation models predict the impact of failures on downstream production and identify optimization opportunities. Operations teams use the digital twin to make faster, data-driven decisions on maintenance scheduling and process changes.
Live Deployment and Monitoring
OEE Optimization and Process Tuning
Continuous Improvement and Model Retraining
Implementation Checklist Summary — Phases and Critical Gates
Implementation Phase
Duration
Critical Items
Success Criteria
Gate
Phase 1 — Data Integration
2-3 weeks
7
30+ days continuous data, <1% loss
Validate
Phase 2 — Asset Hierarchy
1-2 weeks
7
100% signal mapping complete
Approve
Phase 3 — Sensor Config
2-3 weeks
6
Thresholds tested, alerts validated
Test
Phase 4 — AI Training
2-4 weeks
5
90%+ precision on test set
Validate
Phase 5 — Live Deployment
1-2 weeks
6
2-week pilot, zero false positives
Launch
Total Implementation
8-14 weeks
31 items
Full production digital twin live
Full Scale
iFactory Digital Twin Results at Automotive Plants
34%
Unplanned Downtime Reduction
Within 6 months of digital twin deployment through predictive maintenance and early fault detection
18%
OEE Improvement
From real-time process optimization and anomaly-driven root cause analysis
$2.1M
Annual Savings Per Plant
Combination of downtime reduction, predictive maintenance, and supply chain optimization
8 wks
Deployment Timeline
From data integration to live predictive maintenance with operations team trained
Frequently Asked Questions
QWhat is a digital twin and how does it differ from traditional monitoring systems?
A digital twin is a real-time simulation model that mirrors your physical production line, updated continuously with live data from PLCs, SCADA, and sensors. Traditional systems show you what is happening now; digital twins predict what will happen next. This enables proactive maintenance, process optimization, and what-if scenario planning impossible with static dashboards. Book a demo to see a live digital twin matching your production environment.
QHow long does it take to deploy a digital twin and when will we see ROI?
Typical deployment takes 8-14 weeks from data integration to live predictive maintenance. Most plants see 10-15% downtime reduction within the first month of operations, with full 34% improvement realized by month 6 as the AI model learns from accumulated maintenance events. Contact support to discuss your plant timeline.
QDo we need to replace our existing PLCs and SCADA systems?
No. iFactory integrates with your existing infrastructure through standard protocols like Modbus TCP, Profibus, and OPC-UA. We work with legacy systems installed 20+ years ago and modern Industry 4.0 platforms, adapting to whatever equipment your plant runs today.
QHow does the digital twin handle equipment diversity (stamping presses, robots, conveyors)?
Each equipment type has its own digital twin model trained on equipment-specific failure modes and operating signatures. A press failure looks different from a robot jam or conveyor blockage in the data. Our AI learns these distinctions and generates equipment-specific alerts and RUL predictions. Book a demo to see how we handle your equipment mix.
QWhat data security measures protect our production data?
iFactory uses end-to-end encryption, on-premise data options, and role-based access control compliant with IATF 16949 and ISO 27001. Your production data never leaves your facility unless you choose cloud deployment. All data transmission is encrypted and audit-logged.
QCan the digital twin predict failures 30 days in advance?
Prediction horizon depends on the failure mode. Bearing wear can often be detected 20-40 days before failure. Tool wear progression is visible weeks in advance. Sudden failures (electrical shorts, hydraulic ruptures) have shorter lead times. We typically achieve 7-30 day advance warning for 70-80% of maintenance-significant anomalies.
34% downtime reduction + 18% OEE gain. Digital twin widely adopted by operations team.
Month 13-24: Sustained$2.1M+ annual
Full ROI achieved. Continuous improvement from model retraining. Expansion to other lines considered.
Digital Twin Use Cases — Automotive Equipment Classes
Real examples of how digital twins prevent failures across automotive manufacturing equipment:
Stamping Press Bearing Failure Prevention
62% downtime reduction
A Tier 1 supplier's stamping line ran 5 press stations. Bearing failures occurred with no warning, causing 24-hour unplanned downtime each. Digital twin detected bearing preload loss through vibration signature analysis 18 days before catastrophic failure. Maintenance scheduled replacement during planned line stop, avoiding $180K emergency repair cost and 6-day customer shipment delay.
Prediction lead time: 18 daysDowntime avoided: 24 hoursCost saved: $180K
Robotic Arm Drift and Positioning Accuracy
28% quality improvement
Assembly line with 12 collaborative robots performing welding and fastening operations. Arm joint degradation caused gradual positioning drift, increasing rework rate to 3.2%. Digital twin detected arm drift signature from encoder data and force sensor readings. Predictive maintenance flag triggered joint calibration before rework exceeded 2%, saving recalibration labor and scrap material costs.
Defect prevention: 280 units/weekMaterial saved: $42K/monthLead time: 7 days
Battery Pack Assembly Line Thermal Management
41% energy consumption reduction
EV battery assembly plant with climate control and precision tooling consuming 40% of plant energy budget. Digital twin modeled thermal dynamics across 8 assembly stations. AI detected inefficient cooling cycle patterns and recommended zone-based temperature optimization. Implementation reduced energy use by 18% while maintaining temperature tolerance, generating $320K annual savings.
Stop reacting to equipment failures and start predicting them. iFactory builds digital twins for automotive manufacturers in 8-14 weeks, delivering predictive maintenance that reduces downtime by 34% and increases OEE by 18% within 6 months.
Start Your Digital Twin Pilot — Book a Demo Today
See how iFactory integrates with your production environment, models your equipment, and delivers real-time predictive maintenance alerts. We'll walk you through the deployment roadmap and show you the expected ROI for your plant.