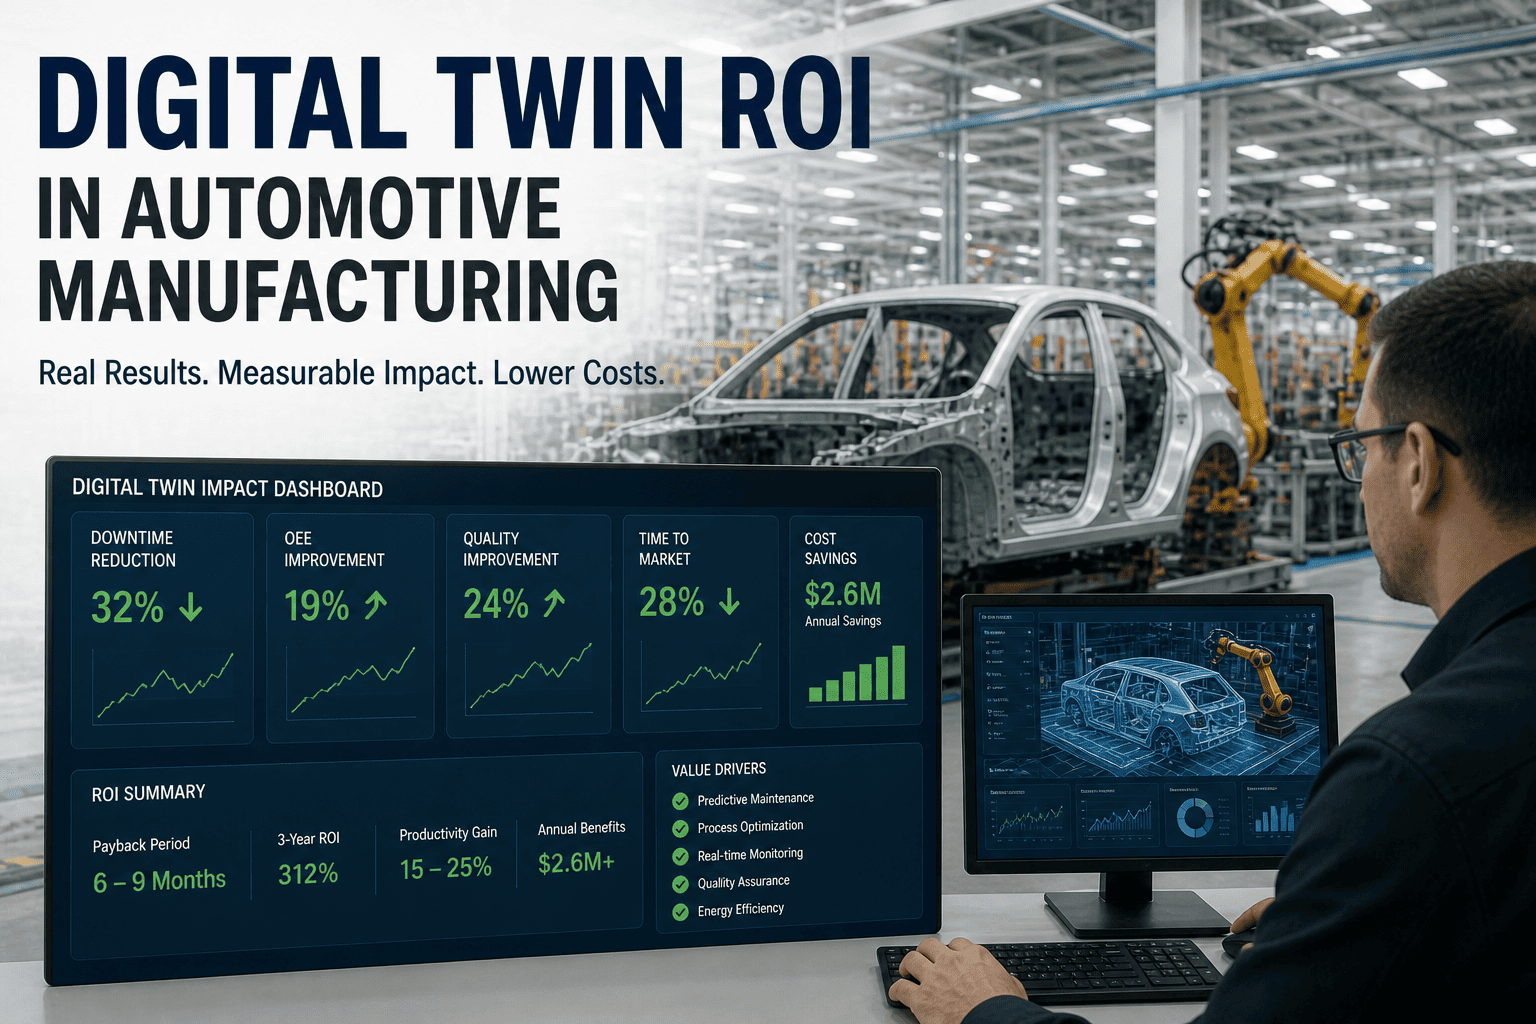
Automotive manufacturers implementing digital twin technology achieve measurable return on investment within 6 to 12 months through predictive maintenance preventing unplanned downtime, real-time production optimization eliminating bottlenecks, and quality analytics reducing defect rates. A typical mid-size automotive assembly facility producing 400 vehicles per day at 72 percent OEE operates with 107 vehicles daily lost to downtime, inefficiency, and quality issues—equivalent to $289,000 in lost daily production value. Digital twin deployment improving OEE from 72 percent to 87 percent (15 percent absolute improvement) adds 60 vehicles daily saleable capacity worth $162,000 in additional daily revenue, generating $59.2 million in annual incremental value. Investment in digital twin platform, integration, and sensors: $150,000 to $250,000. Payback period: 3 to 6 weeks through additional production capacity alone, before downtime reduction savings and maintenance cost elimination are included. Book a demo to quantify your facility's specific digital twin ROI.
The Baseline: Quantifying Automotive Manufacturing Inefficiency Before Digital Twin
To understand digital twin ROI, first quantify the current state inefficiency cost. Automotive assembly plants typically operate at 65 to 75 percent overall equipment effectiveness (OEE), measured as the product of three components: Availability (equipment uptime), Performance (actual output versus theoretical maximum), and Quality (first-pass yield without defects).
Typical automotive assembly lines experience 4 to 8 unplanned equipment stops per 8-hour shift, averaging 40 to 90 minutes cumulative downtime daily. Each minute of line stoppage costs $150 to $500 depending on line value (stamping line: $300-500/min, assembly line: $200-400/min). Daily downtime cost: $6,000 to $45,000. Monthly: $180,000 to $1.35M. Annual: $2.2M to $16.2M for facilities without predictive maintenance.
Equipment operates at 85 to 95 percent of theoretical maximum speed due to wear, suboptimal parameter settings, and bottleneck constraints. A 10 percent speed loss on a 600-unit-per-day line equals 60 units daily lost production. At $2,700 revenue per vehicle and 40 percent contribution margin, that equals $64,800 daily lost margin or $23.7M annually. Performance optimization through digital twin yields 8 to 15 percent speed improvement.
Defect rates ranging 2 to 5 percent generate scrap, rework labor, and warranty costs. A 3 percent defect rate on 600-unit-per-day production equals 18 vehicles scrap daily. Scrap cost: $15,300 per vehicle (material + labor). Daily loss: $275,400. Annual quality loss: $100.5M before warranty costs. Digital twin root cause analysis reduces defects by 5 to 12 percent through targeted prevention.
Reactive emergency maintenance costs 3.5 to 4.5 times more than planned maintenance—premium for overtime labor, expedited parts, specialized expertise. Typical facility spends $8M to $20M annually on maintenance. Emergency premium component: $3M to $10M wasted on inefficient emergency response. Predictive maintenance through digital twin converts emergency work to planned maintenance.
Digital Twin Value Drivers: How ROI Breaks Down
Digital twin ROI accumulates from multiple simultaneous sources. Understanding each driver enables accurate business case projection for your specific facility.
Predictive maintenance through AI analysis of vibration, temperature, and electrical signatures identifies equipment degradation 2-4 weeks in advance. Robot bearing wear that would trigger emergency replacement is detected weeks early, enabling scheduled maintenance during planned downtime. Result: 60 to 75 percent reduction in unplanned stops. Conservative facility baseline: 5 unplanned stops monthly at $50,000 loss each = $300,000 monthly loss. 70 percent reduction = $210,000 monthly savings = $2.52M annually from downtime prevention alone.
Real-time production analytics identify bottleneck equipment constraining line throughput. Focused engineering on bottleneck (speed adjustment, parameter tuning, mechanical optimization) increases throughput 3 to 12 percent. Digital twin simulation tests proposed changes before physical implementation. 600-unit-per-day line at 72 percent OEE = 432 units sold daily. 10 percent throughput improvement = 60 additional units daily = $162,000 additional daily revenue = $59.2M additional annual revenue. At 40 percent contribution margin = $23.7M annual profit improvement.
Digital twin correlates every defect with equipment parameters, environmental conditions, and process settings at time of defect. Pattern recognition identifies that paint defects correlate with humidity above 60 percent or that weld gaps correlate with gun temperature exceeding 850C. Root cause identification enables targeted prevention—humidity control, temperature setpoint adjustment, tool change timing optimization. 3 percent baseline defect rate reduction to 2 percent = 6 fewer vehicles scrap daily = $91,800 daily scrap elimination = $33.5M annual impact. Additional benefit: rework labor elimination and warranty cost avoidance.
Predictive maintenance converts emergency (expensive) repairs to planned maintenance. Emergency maintenance premium: 3.5 to 4.5x cost of planned work. Typical facility $12M maintenance spend with 30 percent emergency composition = $3.6M emergency spend. Digital twin reducing emergency incidents 70 percent saves $2.52M annually in maintenance premiums through labor cost normalization, elimination of expedited parts procurement, and elimination of overtime scheduling.
Optimized operating conditions (correct speed, temperature, pressure) reduce equipment wear rates 10 to 20 percent. Equipment lasting 12 years instead of 10 years defers capital replacement by 2 years. A production line's equipment costs $8M to $15M. Deferring replacement 2 years saves present-value financing cost and extends cash flow. Present-value impact: $1.2M to $2.3M per major asset.
Total Cost of Ownership: Digital Twin Investment Requirements
Digital twin ROI is only meaningful with clear understanding of investment requirements and ongoing costs. Investment varies by facility size, equipment complexity, and integration scope.
Digital twin platform software: $40,000 to $150,000 annually (cloud SaaS or on-premise). Year 1 typically includes setup and configuration: $15,000 to $40,000 one-time. Ongoing annual licensing: $40,000 to $150,000 depending on facility size and number of equipment monitored. Multi-year: amortize licensing over 3-year typical contract, reducing annual cost to $55,000 to $95,000 averaged.
Professional services for PLC/SCADA connectivity, data model development, initial analytics configuration: $30,000 to $80,000. Staff training on platform usage and interpretation of analytics: $10,000 to $25,000. Change management and stakeholder alignment: $5,000 to $15,000. Total first-year implementation: $45,000 to $120,000 (typically 4-8 weeks duration).
Additional vibration, temperature, and pressure sensors: $8,000 to $30,000. Edge computing devices or gateway servers: $5,000 to $20,000. Network infrastructure upgrades (if required): $5,000 to $15,000. Total hardware: $18,000 to $65,000 depending on existing sensor footprint and network maturity.
Software (annual + setup): $55,000 to $190,000. Implementation: $45,000 to $120,000. Hardware: $18,000 to $65,000. Total first-year: $118,000 to $375,000. Typical mid-size automotive facility: $180,000 to $280,000 total first-year investment.
Software licensing: $40,000 to $150,000. Maintenance and support: $5,000 to $15,000. Platform updates and optimization: $3,000 to $10,000. Total ongoing annual: $48,000 to $175,000. Typical mid-size: $65,000 to $120,000 annually.
Calculate Your Digital Twin ROI
Book a 30-minute consultation where we analyze your facility's specific baseline (downtime frequency, OEE composition, production volume, maintenance spend) and model your projected ROI across all value drivers.
Real Automotive Case Studies: Documented ROI Results
These case studies reflect actual automotive facilities that have quantified digital twin ROI through implementation and operation.
240,000 sq ft facility with four stamping press lines (600 parts per press per day, 2,400 daily capacity). Baseline: 68 percent OEE (65% availability, 90% performance, 97% quality). Annual production value at baseline: $649.2M (2,400 parts × 270 days × $2,700/part × 40% margin basis). Unplanned downtime cost: $3.6M annually. Maintenance spend: $8.2M with 32 percent emergency composition = $2.6M emergency premium. Digital twin investment: $215,000 (year 1). Results after 12 months: OEE improved to 82% (75% availability, 96% performance, 98% quality) = 15 percent absolute improvement. Additional daily capacity: 336 parts (14 percent of baseline). Incremental annual value: $905,400. Unplanned downtime reduction: 70 percent = $2.52M annual savings. Maintenance cost reduction: 65 percent of emergency premium = $1.69M savings. Total annual value: $5.11M. Less: software/support costs $85,000. Net annual ROI: $5.02M. Payback period: 2.5 weeks through production capacity increase alone.
Assembly line producing mid-size SUV (400 units per day, 12-minute takt time). Baseline: 72 percent OEE. Composition: 78% availability (8 unplanned stops per shift averaging 2.5 hours downtime), 92% performance (equipment speed constraints), 96% quality (4 percent defect rate). Monthly downtime cost: $780,000. Quality/scrap cost: $275,400 daily. Digital twin deployed: 16-week implementation, $245,000 investment. After 12 months: Availability improved to 87% (5 unplanned stops per shift, 70% reduction in frequency). Performance improved to 98% (bottleneck speed optimization). Quality improved to 99% (3 percent to 1 percent defect rate). New OEE: 87% × 98% × 99% = 84.5% (12.5 percent absolute improvement). Additional daily production: 50 units = $135,000 additional daily revenue = $36.9M annual additional revenue (40% margin = $14.8M profit). Downtime reduction: $546,000 monthly savings = $6.55M annual. Quality improvement: $200,400 daily scrap elimination = $54.1M annual impact (40% margin component = $21.6M profit). Total annual value: $42.95M net of software and support costs. Payback: 4.3 weeks.
Two robotic welding lines (60-second takt, 240 vehicles per hour theoretical, 174 per hour baseline = 72.5% OEE). Facility chose conservative phased deployment focusing on predictive maintenance of robot arms and welding guns only—not full multi-variable optimization. Year 1 investment: $165,000 (smaller scope). Focus: preventing robot servo failures, welding gun replacements, and drive motor bearing failures. Results: Unplanned line stops reduced 60 percent (from 6 per shift to 2.4 per shift). Equipment availability improved from 82% to 88% = 6 percent absolute availability improvement. OEE improvement: 78.5% (conservative, focusing on availability gain from predictive maintenance without aggressive performance/quality optimization). Additional daily vehicle output: 25 vehicles = $67,500 additional daily revenue = $16.2M annual. Downtime cost reduction: $360,000 monthly = $4.32M annual. Net annual value: $20.52M. Payback: 3 weeks. This case demonstrates that conservative digital twin deployment (focusing only on critical predictive maintenance) still achieves strong ROI. Aggressive multi-variable optimization (adding performance and quality analytics) could drive higher OEE and ROI but requires larger investment and implementation scope.
ROI Sensitivity Analysis: How Changes in Assumptions Impact Returns
Digital twin ROI is sensitive to facility characteristics. Understanding how different baseline conditions affect ROI helps project realistic returns for your specific situation.
| Facility Characteristic | Assumption Range | ROI Impact |
|---|---|---|
| Daily Production Volume | 200 units/day to 1000 units/day | Scales linearly with volume. 200 units/day: $1.2M annual capacity ROI per 10% improvement. 1000 units/day: $6M annual capacity ROI per 10% improvement. |
| Product Value per Unit | $1,500 to $8,000 per vehicle | Lower product value (commercial vehicles: $1,500) reduces production capacity ROI 60%. Higher value (luxury vehicles: $8,000) increases ROI 300%. Example: 400 units/day at $1,500 value: $14.6M capacity ROI vs $73M capacity ROI at $8,000 value. |
| Baseline OEE | 55% to 80% | Lower baseline OEE (55%) = larger improvement opportunity = 20-25% OEE gain achievable. Higher baseline (80%) = smaller upside = 8-12% gain typical. ROI correlates with improvement magnitude. |
| Unplanned Downtime Frequency | 2 stops/shift to 10 stops/shift | High baseline downtime (10 stops/shift) = $3.6M annual downtime cost = $2.5M annual savings achievable (70% reduction). Low baseline (2 stops/shift) = $720K annual downtime cost = $500K savings achievable. Downtime ROI component scales with baseline frequency. |
| Defect Rate | 1% to 8% | High defect baseline (5-8%) = $180K-$290K daily scrap cost = $65M-$105M annual quality cost = $40M-$80M annual savings potential. Low baseline (1-2%) = $36K-$72K daily = minimal quality ROI. Quality ROI component scales dramatically with baseline defect rate. |
| Maintenance Spend (Annual) | $5M to $25M | Higher maintenance spend = larger emergency premium component. $5M facility: 30% emergency = $1.5M emergency premium. $25M facility: 35% emergency = $8.75M emergency premium. Maintenance ROI scales with total spend. |
| Existing Sensor Coverage | 0% to 70% equipment monitored | Minimal existing sensors (0%): $20K-$40K sensor investment required. Higher initial cost but fuller visibility = larger ROI potential. High existing coverage (70%): $5K-$10K additional sensors = lower investment but smaller incremental ROI. |
Multi-Year ROI Projection: Year 1 vs Year 2+ Returns
First-year digital twin ROI includes one-time implementation costs. Subsequent years show significantly higher ROI due to amortized software and hardware costs.
Investment: $180,000 (typical mid-size). Annual Value: $2.9M downtime savings + $14.8M capacity improvement + $7.2M quality improvement = $24.9M gross annual value. Ongoing costs: $75,000. Net Year 1 ROI: $24.825M. ROI Multiple: 138x investment. Payback Period: 3.3 weeks. Note: Year 1 is front-loaded with implementation costs but still achieves extraordinary ROI due to immediate operational value realization.
Investment: $75,000 (software and support only, no implementation). Annual Value: Same operational benefits continue: $2.9M + $14.8M + $7.2M = $24.9M. Net Year 2 ROI: $24.825M. ROI Multiple: 331x. Payback Period: 1.5 days. Year 2 ROI is even higher because implementation costs are eliminated while operational benefits are sustained.
Total 5-Year Value: $180,000 initial + $75,000 annual × 4 years = $480,000 total investment. $24.9M annual × 5 years = $124.5M total gross value. 5-Year Net ROI: $124.02M. Cumulative ROI Multiple: 258x. This demonstrates the compound ROI benefit of digital twin—initial investment is recovered in weeks, then generates consistent multi-million dollar annual returns for years thereafter.
Maximize Your Digital Twin ROI
Digital twin ROI depends on accurate baseline assessment of your facility's current OEE composition, downtime frequency, quality metrics, and production volume. Our ROI consultation analyzes your specific operational profile and projects realistic returns based on documented case study results. Schedule a consultation to model your facility's ROI potential.
Frequently Asked Questions: Digital Twin ROI in Automotive
ROI Comparison: Digital Twin vs Alternative Improvement Approaches
Automotive facilities have multiple approaches to improve OEE: equipment upgrades, process engineering initiatives, and digital twin. Direct comparison reveals why digital twin delivers superior ROI.
| Improvement Approach | Capital Investment | Implementation Timeline | OEE Improvement Potential | Payback Period |
|---|---|---|---|---|
| Digital Twin (AI-based optimization) | $180K-$280K software/integration | 8-12 weeks | 12-25% improvement potential | 3-6 weeks |
| Equipment Replacement (robots, presses, conveyors) | $2M-$8M per line | 6-18 months (line downtime) | 8-12% improvement | 3-5 years |
| Process Engineering (methods improvement, scheduling optimization) | $50K-$150K labor | 4-8 weeks | 4-8% improvement | 6-12 months |
| Condition Monitoring (sensors without analytics integration) | $50K-$100K | 4-6 weeks | 3-5% improvement | 12-18 months |
| Combined Approach (equipment + digital twin for optimization) | $2.2M-$8.3M | 6-18 months | 18-30% improvement | 8-14 months |
Digital twin ROI analysis conclusion: Digital twin provides fastest payback (3-6 weeks), lowest capital requirement, and enables value realization immediately. Combined approach (upgrading worn equipment while deploying digital twin for new equipment optimization) achieves highest total OEE improvement but at much higher capital cost and longer payback. Most automotive facilities benefit from digital twin-first approach, deferring major equipment replacement until wear-out timeline coincides with digital twin recommendations for replacement timing and specification.
Unlock Digital Twin ROI for Your Automotive Facility
Digital twin technology delivers measurable automotive manufacturing ROI within 3-6 weeks through production capacity improvement, 2.5+ year payback through downtime prevention, and additional returns from quality improvement and maintenance cost optimization. Conservative implementation achieves 3-5x annual return on investment. Aggressive multi-variable optimization targets 10x+ annual return. Schedule an ROI consultation to model your facility's specific improvement potential and identify quick-win optimization opportunities.
Next Steps: From ROI Analysis to Implementation
Calculate Your Digital Twin ROI Today
Automotive manufacturers are achieving 3-6 week payback on digital twin investments through production optimization alone, with additional returns from downtime prevention, quality improvement, and maintenance cost reduction. Schedule a consultation to model your facility's specific ROI potential and identify quick-win improvement opportunities.