Airports operate within one of the most data-intensive environments in global infrastructure — yet many operations teams still rely on spreadsheets, lagging reports, and gut instinct to manage performance. In the era of AI-driven airport analytics, tracking the right airport KPIs and performance metrics in real time is the difference between proactive operations management and costly reactive firefighting. This guide covers every critical aviation performance indicator your team needs — from equipment uptime and MTTR to regulatory readiness scores and cost per passenger. If you want a customized airport analytics dashboard built around your operations, Book a Demo and get a no-obligation performance audit today.
Why AI-Driven Airport Analytics Are Redefining Performance Management
Traditional airport performance reporting relied on monthly reviews, manual data entry, and siloed departmental metrics. Modern airport performance dashboards aggregate data from building management systems, CMMS work orders, energy meters, passenger flow counters, and baggage handling sensors — synthesizing them into a unified, real-time view of operational health. Airports that have made this transition report faster incident response, lower maintenance costs, and significantly improved audit readiness. Book a Demo to see how iFactory maps these metrics to your airport's specific asset profile.
The Core Framework: How to Structure Airport KPI Tracking
Effective airport operations metrics are organized across four performance domains: Asset Reliability, Maintenance Efficiency, Financial Performance, and Regulatory Compliance. Each domain contains lead indicators (predictive, forward-looking) and lag indicators (outcome-based). A mature airport analytics program tracks both — using lead indicators to prevent problems and lag indicators to validate that interventions are working.
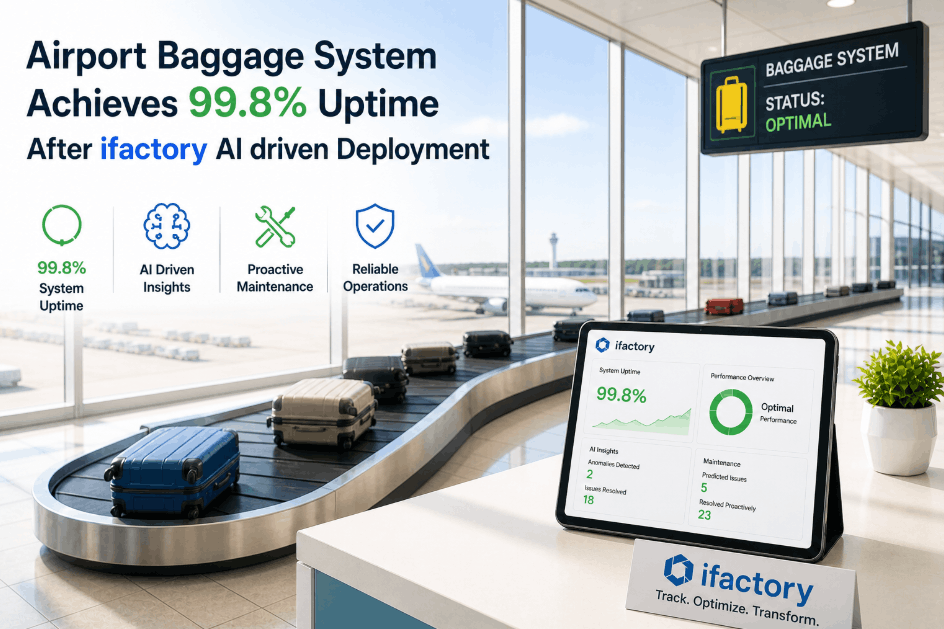
Airport Uptime KPIs: Measuring Equipment Availability Across Critical Systems
Airport equipment uptime is the foundational metric in aviation facility management. Downtime on a critical system — a baggage carousel, a jet bridge, a security screening lane — directly impacts passenger experience, airline SLA performance, and regulatory standing. Granular uptime KPIs segmented by asset class, terminal, and operational shift are the foundation of a credible airport performance dashboard. Book a Demo for a live walkthrough of uptime tracking in the iFactory aviation module.
| Asset Class | Target Uptime | Critical Threshold | AI Alert Trigger |
|---|---|---|---|
| Baggage Handling Systems | 99.5%+ | Below 98.5% | Vibration anomaly or jam detection |
| Passenger Boarding Bridges | 99.0%+ | Below 97.5% | Hydraulic pressure deviation |
| Security Screening Equipment | 99.2%+ | Below 98.0% | Throughput rate drop or sensor fault |
| Terminal HVAC Systems | 99.0%+ | Below 96.5% | Temperature deviation from setpoint |
| Escalators & Moving Walkways | 98.5%+ | Below 96.0% | Motor current anomaly or speed variance |
| Power & UPS Systems | 99.9%+ | Below 99.5% | Load imbalance or battery health flag |
MTTR Tracking: The Most Underrated Aviation Performance Indicator
Mean Time to Repair (MTTR) is the single most actionable maintenance KPI in airport operations. AI-driven airport analytics platforms calculate MTTR automatically from work order timestamps — capturing the exact interval between fault detection, technician dispatch, repair completion, and asset restoration. Airports using AI-driven MTTR dashboards typically reduce average repair response time by 25 to 40 percent within the first year, because the data makes inefficiencies visible for the first time. Book a Demo to see how automated MTTR tracking changes maintenance leadership conversations.
PM Compliance: The Airport KPI That Predicts Future Uptime
Preventive maintenance compliance rate measures the percentage of scheduled maintenance tasks completed on time within the defined frequency window. AI-driven airport analytics platforms automatically calculate PM compliance by comparing scheduled task dates against actual CMMS completion timestamps — then correlate compliance rates with subsequent failure frequency. Airports that track PM compliance in real time maintain uptime levels 15 to 22 percent higher than those reviewing compliance data monthly.
Work Order Backlog Analytics: Surfacing Hidden Operational Risk
The work order backlog metric is one of the most revealing airport operations metrics in facilities management. AI analytics platforms analyze backlog not just as a total count, but by age, priority classification, asset criticality, and resource assignment — turning a single number into an actionable operations intelligence report. Book a Demo to see how AI-driven work order backlog analytics can be configured for your airport's CMMS environment.
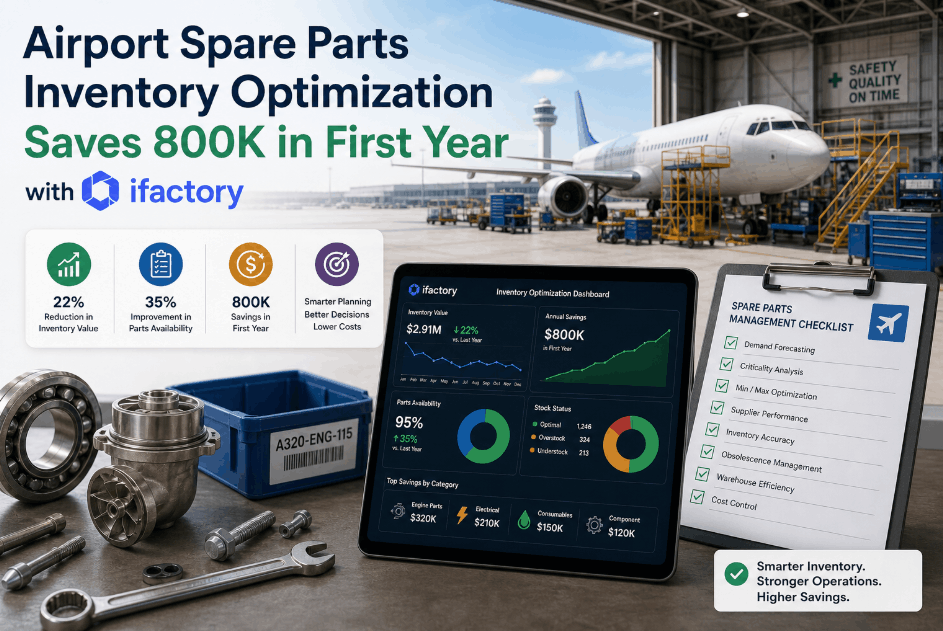
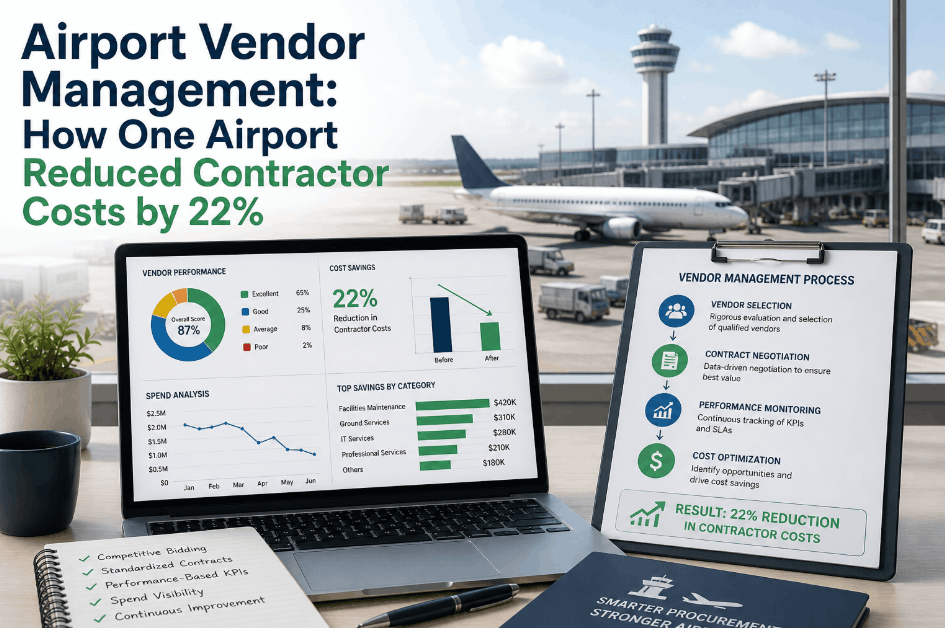
Cost Per Passenger: The Financial KPI That Connects Operations to Revenue
Airport cost per passenger directly connects operational expenditure to the revenue-generating passenger throughput that justifies the airport's infrastructure investment. AI-driven analytics platforms calculate cost per passenger automatically and disaggregate total cost into terminal-level, asset-class-level, and individual work order contributions — allowing CFOs and operations directors to identify exactly where per-passenger costs are rising and target efficiency interventions precisely.
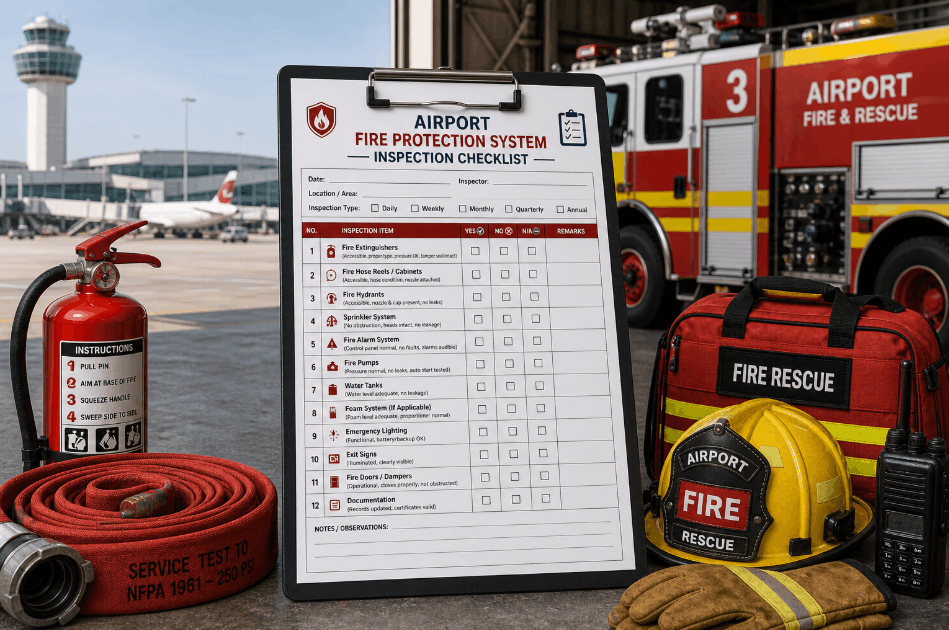
Regulatory Readiness Scores: AI-Driven Compliance Tracking for Aviation Facilities
Aviation facilities operate under stringent frameworks — ICAO standards, civil aviation authority requirements, fire safety certification cycles, lift and escalator inspection mandates, and environmental compliance obligations. AI-driven regulatory readiness scoring replaces fragile calendar-based systems with a continuously calculated compliance health index that reflects the real-time status of every inspection, test, and certification in your portfolio — eliminating weeks of manual data gathering before an audit cycle.
Building an Airport Analytics Benchmarking Framework
The highest-value use of airport benchmarking KPIs is comparative analysis: your asset performance versus your own historical baseline, versus peer airports of similar passenger volume, and versus AI-generated optimal targets based on asset age and operational profile. AI analytics platforms enable internal, historical, and sector benchmarking simultaneously — giving operations leadership a complete picture of where performance stands and where the most impactful improvement opportunities lie.