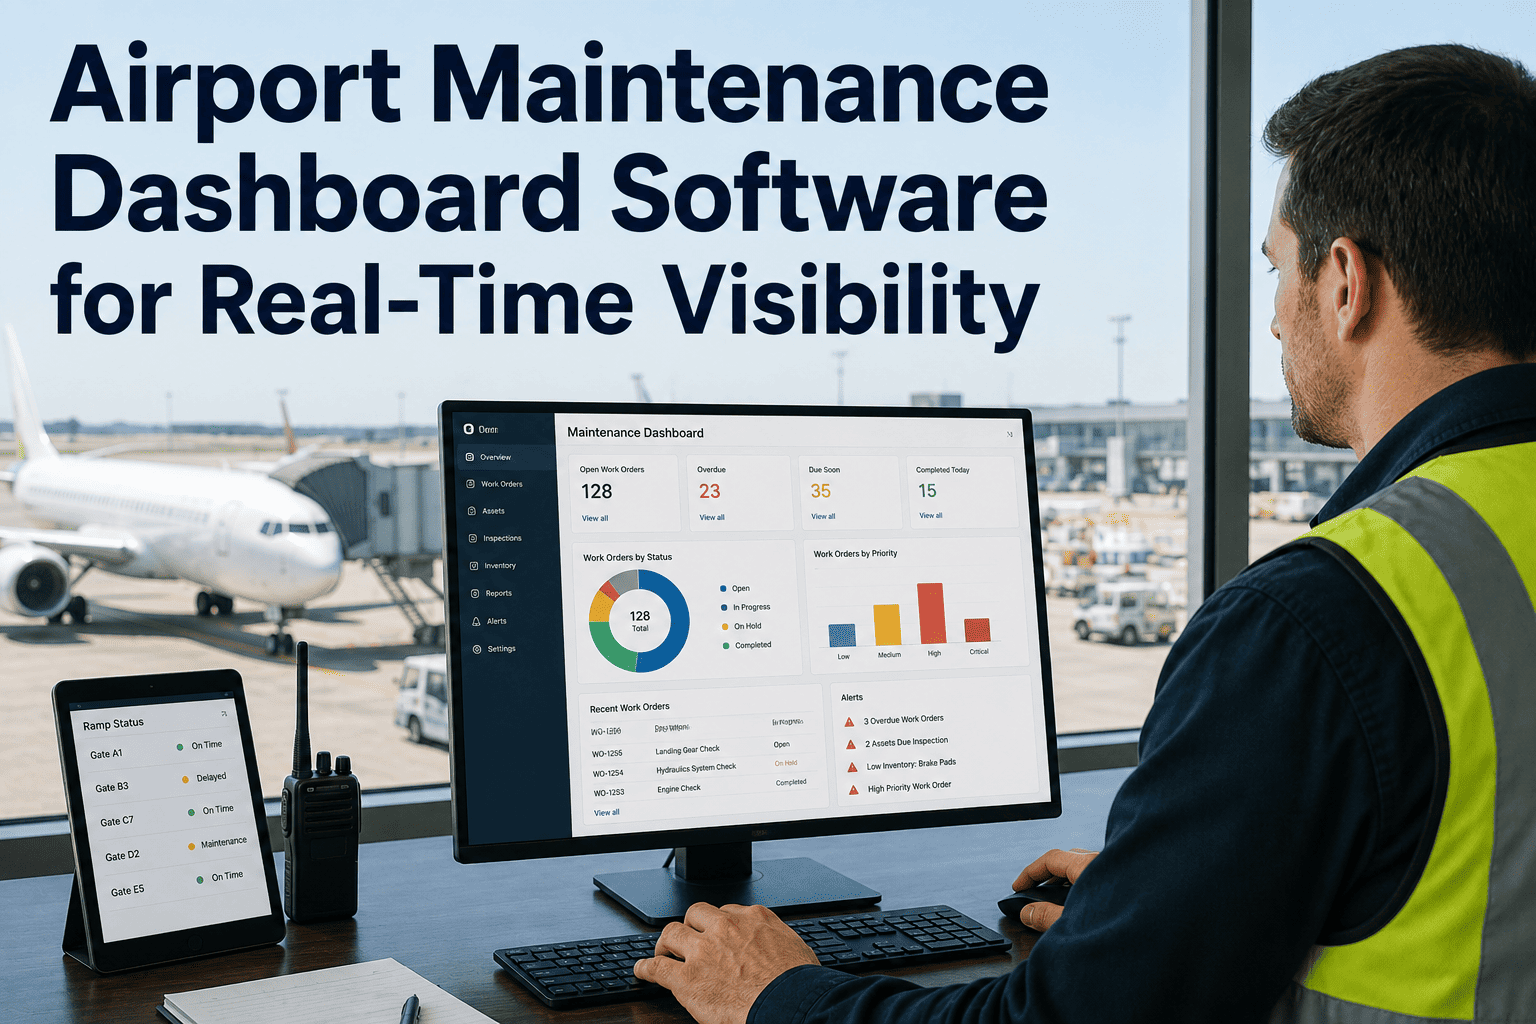
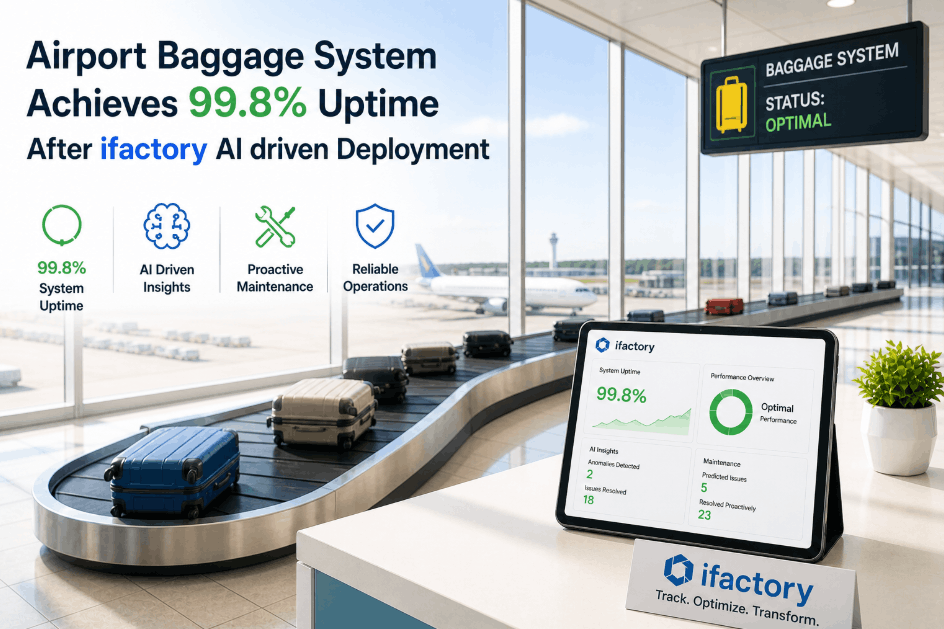
For a major international airport managing four passenger terminals, two cargo facilities, and a network of airside infrastructure spanning 11 million square feet, operational visibility had become a critical gap. Each terminal operated within its own siloed reporting environment — presenting data through disconnected SCADA screens, standalone FIDS feeds, and static weekly reports. Decision-makers lacked real-time cross-terminal awareness, and incidents in one terminal routinely cascaded into delays across the entire campus before operations staff even received notification. This is the account of how an international airport operations center achieved unified real-time visibility across all four terminals, reduced average incident response time by 64%, and improved on-time departure rates by 19% using ifactory's Multi-Site Dashboard platform with centralized AI-driven analytics. Book a demo to see how ifactory's Multi-Site Dashboard delivers real-time operations intelligence across multi-terminal airport environments.
Client Background
The airport operates four passenger terminals handling 38 million annual passengers, two dedicated cargo facilities processing 740,000 metric tons per year, and a 220-gate airside network across an 11 million square foot campus. Terminal operations run continuously across three shifts with peak throughput exceeding 1,400 aircraft movements per day. Prior to deployment, the airport's Operations Control Center (OCC) relied on fourteen separate monitoring screens displaying terminal-specific feeds with no integrated view, no cross-terminal KPI correlation, and no AI-driven anomaly detection. Book a demo to see how ifactory maps to complex multi-terminal airport environments.
The Challenge
International airports operating at scale face an inherent operational paradox: the larger and more complex the facility, the more critical unified visibility becomes — yet the legacy infrastructure that grows with that complexity actively prevents it. This airport's Operations Control Center managed four terminals with separate BMS systems, distinct gate management platforms, independent security feeds, and unconnected baggage monitoring systems. No single point of truth existed. Supervisors assembled situational awareness from memory, shift handoff notes, and radio communications rather than from integrated real-time data — creating a persistent gap between what was happening across the airport and what the OCC actually knew.
The Solution: ifactory Multi-Site Dashboard with Centralized AI-Driven Analytics
The airport deployed ifactory's Multi-Site Dashboard platform to unify data streams from all four passenger terminals, both cargo facilities, and the complete airside network into a single operations intelligence environment. The platform ingested real-time feeds from existing BMS, FIDS, gate management, baggage tracking, and security queue systems — eliminating siloed monitoring without replacing existing infrastructure. AI-driven analytics continuously processed cross-terminal data to detect developing anomalies, generate predictive alerts, and surface campus-wide KPIs on a single configurable OCC display.
- Single real-time view consolidating all four terminals, cargo facilities, and airside zones
- Configurable display layouts for OCC supervisor, shift manager, and executive views
- Live campus-wide KPI panels including on-time performance, gate utilization, and dwell time metrics
- Machine learning models analyzing cross-terminal passenger flow, gate activity, and equipment status
- Predictive alerts generated 12–22 minutes before threshold breaches occur
- Automated severity scoring directing OCC attention to highest-impact developing incidents
- Unified alert management routing all terminal events to OCC with prioritized severity classification
- Cross-terminal incident correlation identifying cascade risk across adjacent facilities
- One-click response dispatch and coordination tools integrated within the dashboard environment
- Live departure and arrival performance metrics tracked per terminal and campus-wide
- Gate utilization, turnaround time, and ground handling efficiency visible in real time
- Security queue depth and checkpoint throughput monitored with automated escalation triggers
- Daily, weekly, and monthly performance reports generated automatically from live data
- Executive dashboards providing on-demand operational intelligence without manual assembly
- Historical trend analysis enabling operational pattern identification and resource planning
- API-based integration with existing BMS, FIDS, gate management, and baggage systems
- No replacement of terminal control infrastructure — ifactory adds intelligence on top of existing systems
- Standardized data normalization converting incompatible terminal feeds into unified operational data
Implementation Approach
Deployment followed a phased terminal integration sequence over ten weeks, prioritizing the two highest-traffic terminals in the initial phase to validate data integration and dashboard accuracy before extending coverage to the full campus. All four terminals and both cargo facilities were live on the ifactory Multi-Site Dashboard within 68 days of project kickoff. Book a demo to walk through a deployment plan calibrated to your airport's terminal configuration and existing systems architecture.
API connections were established with Terminal 1 and Terminal 2 BMS, FIDS, gate management, and baggage tracking systems. The ifactory platform began ingesting and normalizing real-time data feeds, and initial dashboard configurations were built around the OCC's operational workflows. Baseline performance metrics were established for both terminals across all key KPIs during the first 15 days of data collection.
Integration extended to Terminal 3, Terminal 4, and both cargo facilities. The unified Multi-Site Dashboard was activated for full OCC deployment, replacing the 14-screen monitoring configuration with a single integrated environment. OCC supervisors and shift managers completed platform training and began operating from the centralized dashboard. AI-driven anomaly detection was activated across all integrated data streams.
Historical terminal performance data was used to calibrate the AI predictive models to the airport's specific operational patterns — seasonal passenger volumes, airline schedule clusters, and recurring congestion scenarios. Alert thresholds were configured with OCC leadership to ensure actionable specificity. Automated reporting templates were built and validated against manual reporting benchmarks from the pre-deployment period.
By month three, the ifactory platform was generating predictive alerts an average of 17 minutes before threshold events, enabling proactive OCC intervention across all terminals. Average incident response time had dropped to 10 minutes. On-time departure rates had improved 19% over the pre-deployment baseline, and cross-terminal delay cascade events had been reduced by 73%.
Results After Full Deployment
The transition from fourteen siloed terminal monitoring screens to ifactory's unified Multi-Site Dashboard delivered measurable improvements across every dimension of airport operations performance — response time, departure reliability, cost reduction, and leadership decision-making quality.
Performance Summary
| Metric | Before ifactory | After ifactory | Improvement |
|---|---|---|---|
| Average Incident Response Time | 28 minutes | 10 minutes | -64% |
| On-Time Departure Rate (Campus) | 71% | 84.6% | +19% |
| Annual Delay-Related Costs | $4.8M | $1.7M | -$3.1M (65%) |
| Cross-Terminal Cascade Events / Month | 34 average | 9 average | -73% |
| Performance Reporting Latency | 72-hour lag | Real-time | 100% elimination |
| OCC Shift Time on Data Collation | 61% of shift | Under 8% of shift | ~87% reduction |
| Predictive Alert Lead Time | None — reactive only | 17 min avg. lead time | From 0 to 17 min |
Key Benefits and Business Impact
The deployment of ifactory's Multi-Site Dashboard created operational and strategic value far beyond incident response speed — reshaping how airport leadership understands and manages campus-wide performance, enabling proactive resource allocation, and delivering a structural improvement in on-time performance that directly impacts passenger experience and airline relationships.
Unifying fourteen disconnected monitoring environments into a single real-time dashboard gave the OCC its first true campus-wide operational view. Pattern recognition that was previously impossible — cross-terminal congestion correlations, systemic gate allocation inefficiencies, recurring ground handling bottlenecks — became immediately visible and actionable.
Predictive alerts with an average 17-minute lead time converted the OCC from a reactive incident response function into a proactive operations coordination center. The shift from responding to developing incidents to intervening before they propagate reduced cascade delay events by 73% and freed OCC capacity for strategic coordination rather than crisis management.
The 64% improvement in incident response time and 73% reduction in cascade delay events translated directly into lower airline compensation exposure and reduced passenger service costs. The $3.1M annual reduction was achieved without adding OCC staffing — through intelligence enabling faster, more accurate intervention by the existing team.
The 19% improvement in on-time departure rates directly strengthened airline relationships by reducing the frequency and cost of delay events attributable to airport operations coordination failures. Airlines operating at the facility reported improved schedule confidence, and the airport's operational reliability metrics improved across all carrier scorecards for the first time in six years.
Eliminating the 72-hour reporting lag transformed strategic leadership decision-making from a retrospective review exercise to a real-time intelligence-driven process. Resource allocation, staffing adjustments, and gate planning decisions could now respond to current conditions rather than to conditions that existed days earlier — a structural improvement in management effectiveness.
Recovering 53% of OCC supervisor shift time from manual data collation created substantial capacity for the coordination, communication, and proactive planning activities that actually improve airport performance. The platform enabled the existing OCC team to deliver materially better operational outcomes — without headcount increases or process redesign beyond the analytics implementation itself.
Conclusion
For international airports managing multiple terminals at high passenger and aircraft movement volumes, operational fragmentation is not an inconvenience — it is a direct driver of delay costs, airline dissatisfaction, and passenger experience failures. When four terminals operate in information isolation, the cross-facility patterns that generate cascading delays remain invisible until they are already compounding. This case study demonstrates what becomes possible when multi-terminal operations converge on a unified real-time intelligence platform: incident response accelerates by 64%, on-time departure rates improve by 19%, $3.1M in annual delay costs are eliminated, and the OCC transforms from a reactive monitoring function into a proactive operations coordination center. Book a demo to see how ifactory's Multi-Site Dashboard applies to your airport's terminal configuration and operations environment.
For this airport, ifactory's Multi-Site Dashboard eliminated the operational blindness created by terminal information silos and replaced it with continuous, AI-enhanced campus-wide visibility. The outcomes — faster response, fewer delays, lower costs, and better decisions at every level — were not achieved by replacing terminal systems or adding OCC headcount. They were achieved by connecting existing systems through a unified intelligence layer that made the entire campus visible, measurable, and manageable in real time. Any airport operations center managing multiple terminals under fragmented monitoring conditions can achieve comparable results by making the same transition: from reactive screen-watching to proactive intelligence-driven coordination.