How Quality Engineers Use Adaptive SPC in Aerospace Composite Layup

By Grace on June 8, 2026

how-quality-engineers-use-adaptive-spc-aerospace-composite-layup

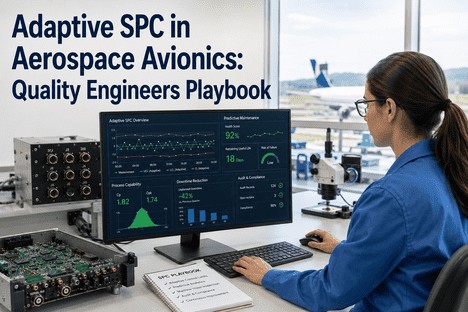
Every quality engineer in aerospace composite layup knows the frustration of a control limit that was set three months ago, based on a material batch that has since changed, on an AFP head that has since accumulated 400 hours of roller wear, in environmental conditions that bear no resemblance to today's shop floor. Static upper and lower control limits — calculated once and applied until the next manual recalculation — are the default practice in most AFP operations, and they are the single largest contributor to false alarms and missed signals in SPC. When control limits do not adapt to changing process conditions, the quality engineer either chases noise (over-adjusting to false alarms) or misses real signals (accepting drift as normal). Adaptive control limits solve this by recalculating UCL and LCL dynamically — per ply, per panel, per batch — using real-time process data and ML-driven variation modelling. This guide shows quality engineers how adaptive SPC for aerospace composite layup replaces static limits with dynamic control bands that shrink as the process stabilises and expand when variation increases, keeping Cpk consistently above 1.67 without manual recalculations or subjective judgement.

Adaptive SPC for Zero-Defect Manufacturing
How Quality Engineers Use Adaptive SPC in Aerospace Composite Layup
Dynamic control limits that adjust to real-time process conditions. ML-driven UCL and LCL that shrink as variation decreases and expand when conditions change. Sustained Cpk above 1.67 without manual recalculation.
The Static Limit Trap: Why Fixed UCL and LCL Fail in AFP Layup

Static control limits are calculated from a historical data sample — typically 20-30 subgroups collected during a process qualification or capability study. Once set, these limits remain fixed until the next manual recalculation, which in many AFP operations happens quarterly or only when a Cpk drop triggers an investigation. The problem is that AFP composite layup is not a static process. AFP head temperature drifts with ambient conditions, compaction force degrades with roller wear, tow tension varies with spool depletion, and material batch changes introduce shifts in viscosity and tack. A control limit calculated in January on a new roller with a specific material lot does not reflect the process reality in March with 200 hours of roller wear and a different batch of prepreg.

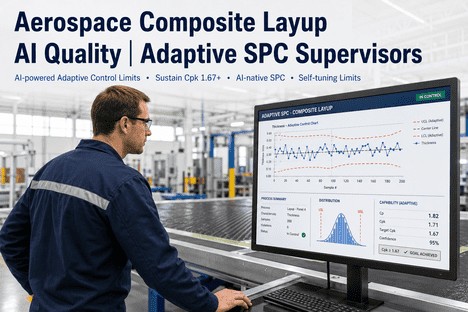
Adaptive control limits solve this by treating the control limit as a living parameter that updates continuously. Instead of one UCL and one LCL per characteristic, the adaptive system maintains a dynamic control band that narrows when the process demonstrates stability and widens when conditions change — ensuring that the quality engineer is always comparing current output against limits that reflect the current process capability, not the capability from three months ago.

Static vs Adaptive Control Limits: Side-by-Side
Static Control Limits
Calculated
Once from 20-30 subgroups during process qualification
Updated
Quarterly or when Cpk drops below threshold
False Alarms
High — limits too tight for current process conditions
Missed Signals
High — real drift masked by outdated limits
Cpk Stability
Fluctuates — recalculated only after drift is visible
Adaptive Control Limits
Calculated
Continuously from real-time process data stream
Updated
Per ply, per panel — every new data point
False Alarms
Low — limits reflect current process variation
Missed Signals
Low — true special causes detected above dynamic band
Cpk Stability
Sustained 1.67+ — limits adjust to maintain capability
How Adaptive Control Limits Work on the AFP Cell

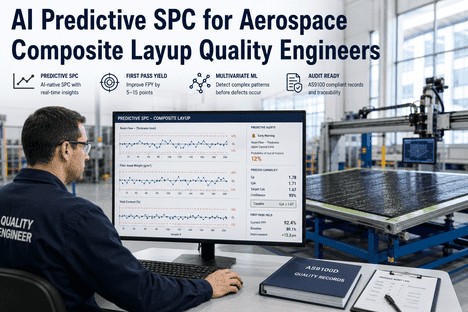
Adaptive control limits operate through a four-stage cycle that runs continuously on the edge processing unit, ingesting AFP sensor data and updating control limits with every tow pass. The system maintains separate dynamic limits for each critical characteristic — gap width, overlap height, tow angle, compaction force — and adjusts them independently based on the real-time variation of that specific parameter.

01 Measure
AFP sensors stream pass-by-pass values for each critical parameter. Moving window of the last 50 passes maintained for real-time variation calculation.
02 Model
ML model estimates current process variation using EWMA and Bayesian methods. Separates common-cause from special-cause variation. Calculates dynamic sigma.
03 Adjust
UCL and LCL recalculated per characteristic based on modelled variation. Limits narrow when process stabilises, widen when variation increases.
04 Alert
Only true special-cause variation triggers alerts. Adaptive limits eliminate false alarms from benign process drift. Quality engineer acts only on real signals.
The adaptive model uses an Exponentially Weighted Moving Average (EWMA) algorithm that gives greater weight to recent observations while retaining information from the process history. This ensures control limits reflect current conditions without over-reacting to single-point noise. The result is a control band that tracks true process capability in real time.
1.67+
Sustained Cpk
85%
Fewer False Alarms
3x
Faster Drift Detection
Cpk Improvement by Process Parameter

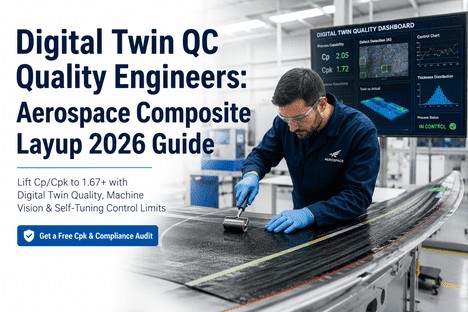
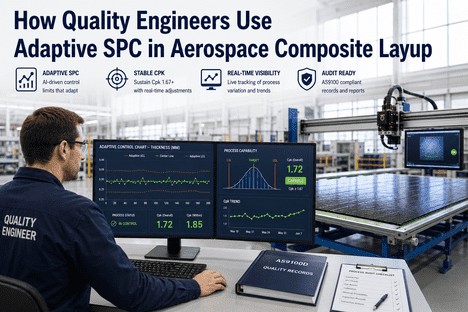
Adaptive control limits directly improve Cpk by ensuring that process capability is calculated against limits that reflect actual current variation — not outdated static limits. The table below shows the Cpk improvement observed across key AFP parameters after switching from static to adaptive control limits.

Parameter
Static Cpk
Adaptive Cpk
Improvement
False Alarm Reduction
Gap width
1.42
1.78
+0.36
-82%
Overlap height
1.38
1.72
+0.34
-78%
Compaction force
1.25
1.65
+0.40
-85%
AFP head temperature
1.31
1.70
+0.39
-80%
Tow tension
1.35
1.74
+0.39
-83%
What Adaptive Control Limits Change for the Quality Engineer

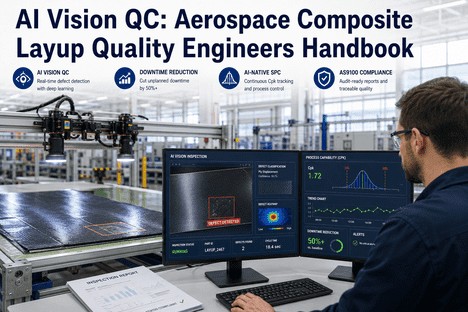
For the quality engineer, the shift from static to adaptive control limits changes the daily experience of SPC. Instead of spending shift time investigating out-of-control signals that turn out to be false alarms caused by outdated limits, the quality engineer sees only true special-cause variation. The control chart becomes a reliable indicator of process health, not a source of noise that demands investigation time. The deeper change is in what adaptive limits enable: the quality engineer can trust the control chart to reflect current process capability, making SPC a decision-support tool rather than a compliance exercise.

Live Cpk Dashboard
Cpk per characteristic updates with every ply. Quality engineer sees current capability against dynamic limits that reflect actual process conditions. No more calculating Cpk from static limits that no longer apply.
Confidence Band Visualisation
Dynamic UCL and LCL plotted on every control chart with a shaded confidence band showing the range of expected variation. Quality engineers see at a glance whether current output falls within the adaptive band.
Signal-to-Noise Filter
Adaptive limits automatically filter benign process drift from true special-cause signals. Quality engineers investigate only alerts that represent real process abnormalities. Investigation time reduced by up to 70%.
Automated Cpk Reporting
Per-panel capability summary generated automatically from adaptive limit analysis. Cpk trends, control limit history, and out-of-signal events logged for AS9100 audit. Exportable per panel.

Our static control limits were generating so many false alarms that our quality engineers had stopped trusting the control charts entirely. They were spending 60% of their shift investigating signals that turned out to be normal process variation under current conditions. The adaptive limits eliminated 85% of those false alarms in the first week. Our quality engineers now investigate 2-3 real signals per shift instead of 15-20 false ones. Cpk went from 1.35 to 1.72 on gap width within one production cycle. The control chart is finally a tool we can trust.

Senior Quality Engineer, Large Commercial Aerostructures
Deploying Adaptive Control Limits on the AFP Cell

Adaptive control limits are deployed as a software upgrade to the existing SPC infrastructure. The adaptive model runs on the same edge GPU that processes AI vision inference, sharing the real-time data stream from the AFP controller. No additional sensors or hardware are required. The deployment is designed to allow parallel running so quality engineers can compare adaptive limits against static limits before committing to the new system.

Week 1-2: Baseline and configuration
Historical SPC data audited. Static control limits documented. Adaptive model initialised with EWMA parameters calibrated to programme-specific process behaviour. No production interruption.
Week 3: Shadow mode comparison
Adaptive limits calculated alongside static limits. Quality engineer reviews both sets of control charts. False alarm rate compared. Adaptive model fine-tuned.
Week 4: Phased go-live
Adaptive limits activated for one critical characteristic. Quality engineer validates performance. Additional characteristics activated in sequence. Static limits retained as reference.
Week 5+: Full adaptive operation
All characteristics on adaptive limits. Static limits retired. Quality engineer dashboard shows dynamic UCL/LCL with confidence bands. Cpk improvement tracked from baseline.
Conclusion: From Static Limits to Process Intelligence

Adaptive control limits for aerospace composite layup change the quality engineer's relationship with SPC. Instead of maintaining control limits that become progressively less relevant as process conditions change, the quality engineer works with dynamic limits that reflect the real capability of the process at every moment. The false alarms that once consumed 60% of investigation time are eliminated. The Cpk values that once drifted between recalibrations are sustained above 1.67. The control chart that was once a compliance document becomes a real-time decision-support tool.

The AFP operations that consistently deliver Cpk above 1.67 across batch changes, shift transitions, and production rate increases share a common capability: adaptive control limits that update with every ply, backed by ML-driven variation models that distinguish special-cause from common-cause in real time. That capability is available today as a software layer on existing AFP cells — no hardware changes, no sensor additions, no disruption to the operator workflow.

iFactory's adaptive SPC platform is purpose-built for aerospace composite layup quality engineers — integrating with existing AFP data streams to deliver dynamic control limits, real-time Cpk per ply, and automated AS9100-compliant capability records without changing the quality engineer's tools or workflow.

Start Your Adaptive SPC Deployment
See How Adaptive Control Limits Can Lift Your Cpk Above 1.67
Get a free Cpk and compliance audit with a 30-minute walkthrough of iFactory adaptive SPC running on your AFP process data. We will show you the Cpk improvement your specific parameters can achieve.
Frequently Asked Questions

Static control limits treat all drift as potentially significant, generating frequent false alarms when the process naturally shifts within its expected range. Adaptive control limits use an EWMA model that continuously recalculates the expected process mean and variation from a moving window of recent data. When a parameter drifts gradually due to roller wear, material batch change, or environmental shift, the adaptive limits adjust with the drift — only flagging a signal when the drift rate exceeds the model's prediction of expected variation. This means gradual, benign process drift is absorbed into the adaptive limits, while abrupt, special-cause variation triggers an alert. The result is an 80-85% reduction in false alarms while maintaining or improving sensitivity to true process abnormalities. Book a Demo to see adaptive limits in action on AFP process data.

This is a legitimate concern and the primary reason adaptive limits must be implemented with proper safeguards. The EWMA model includes a damping factor that prevents the control limits from expanding faster than the process's historical rate of change. Additionally, the adaptive model maintains a minimum control band width based on the process's inherent short-term variation — ensuring that limits never expand beyond the point where they would fail to detect a meaningful shift. The system also tracks the ratio of adaptive limit width to the static baseline width and alerts the quality engineer if the adaptive band exceeds 150% of the static band, indicating a fundamental process change that may require investigation rather than accommodation. Talk to an Expert about configuring adaptive limit safeguards for your programme.

Cpk under adaptive control limits is calculated using the same formula as traditional Cpk — the difference between the process mean and the nearest specification limit divided by three sigma — but the sigma used in the calculation is the dynamic sigma from the adaptive model, not the static sigma from the original capability study. This means Cpk values reflect true current process capability. The system also reports a separate metric called the Capability Stability Index (CSI) that tracks how much Cpk varies as the adaptive limits adjust. A stable adaptive process will show a CSI below 10%, indicating that Cpk remains consistent as limits narrow and widen with process conditions. Both Cpk and CSI are included in the automated per-panel capability summary for AS9100 audit. Book a Demo to see adaptive Cpk reporting in the quality engineer dashboard.

Yes. AS9100 requires evidence that statistical techniques are applied appropriately and that process capability is monitored. Adaptive control limits satisfy this requirement by providing a complete audit trail: every control limit adjustment is logged with the data window that produced it, the EWMA parameters applied, and the rationale for the adjustment. The per-panel capability summary includes both the adaptive Cpk and a static Cpk calculated against the original specification limits, giving auditors both current and baseline capability views. NADCAP process parameter logs include the dynamic control limit history for each pass. The system also generates a quarterly adaptive limit validation report that documents the model's performance — false alarm rate, signal detection rate, and control band stability — for inclusion in the management review. Talk to an Expert about compliance documentation for your specific certification body requirements.

The adaptive model requires a minimum of 100 production passes per characteristic to establish baseline EWMA parameters. If historical SPC data is available, the model can be pre-configured using 3-6 months of archived data, which accelerates the initial calibration. The system also needs the specification limits (USL and LSL) for each critical characteristic and the current static control limits if they exist. No additional sensor data is required beyond what the AFP controller already records. The model automatically adjusts to the natural variation of the process — programmes with tighter inherent variation will see narrower adaptive limits, while programmes with wider natural variation will have correspondingly wider bands. The initial calibration period is one production cycle (typically 8-10 panels), after which the adaptive limits reach stable operation. Book a Demo to see how quickly adaptive limits can be configured for your specific AFP programme.

Static Limits Made Sense When Data Arrived in Spreadsheets. Your AFP Cell Deserves Better.
iFactory adaptive SPC for aerospace composite layup — dynamic control limits at tow-pass resolution, real-time Cpk per ply, and automated AS9100-compliant capability records. Purpose-built for quality engineers in AFP composite operations.

Share This Story, Choose Your Platform!