Biogas plants experience an average of 14–31% unplanned downtime annually due to feedstock contamination — not from digester failures, but from plastic bags, metal debris, oversized solids, and non-organic contaminants that no manual intake inspections or basic screening can catch in time. By the time mixing equipment jams, digester efficiency drops, or maintenance crews extract foreign objects, the compounding costs are already realized: emergency shutdowns, equipment damage, reduced biogas yield, and costly digester cleaning. iFactory Feedstock Intelligence Platform changes this entirely — detecting contamination in real time using AI-powered computer vision at the intake and pre-treatment stage, classifying waste quality before it enters the digester, and integrating directly into your existing SCADA, maintenance, and quality systems without disrupting operations. Book a Demo to see how iFactory deploys AI vision feedstock inspection across your biogas plant within 7 weeks.
97%
Contamination detection accuracy before measurable process impact occurs
$1.5M
Average annual cost avoidance per mid-size plant from prevented equipment damage
91%
Reduction in manual intake inspection hours vs. traditional visual surveys
7 wks
Full deployment timeline from intake audit to live AI vision monitoring
Every Undetected Contaminant Is a Jam, Shutdown, or Yield Loss. AI Vision Stops It at the Intake.
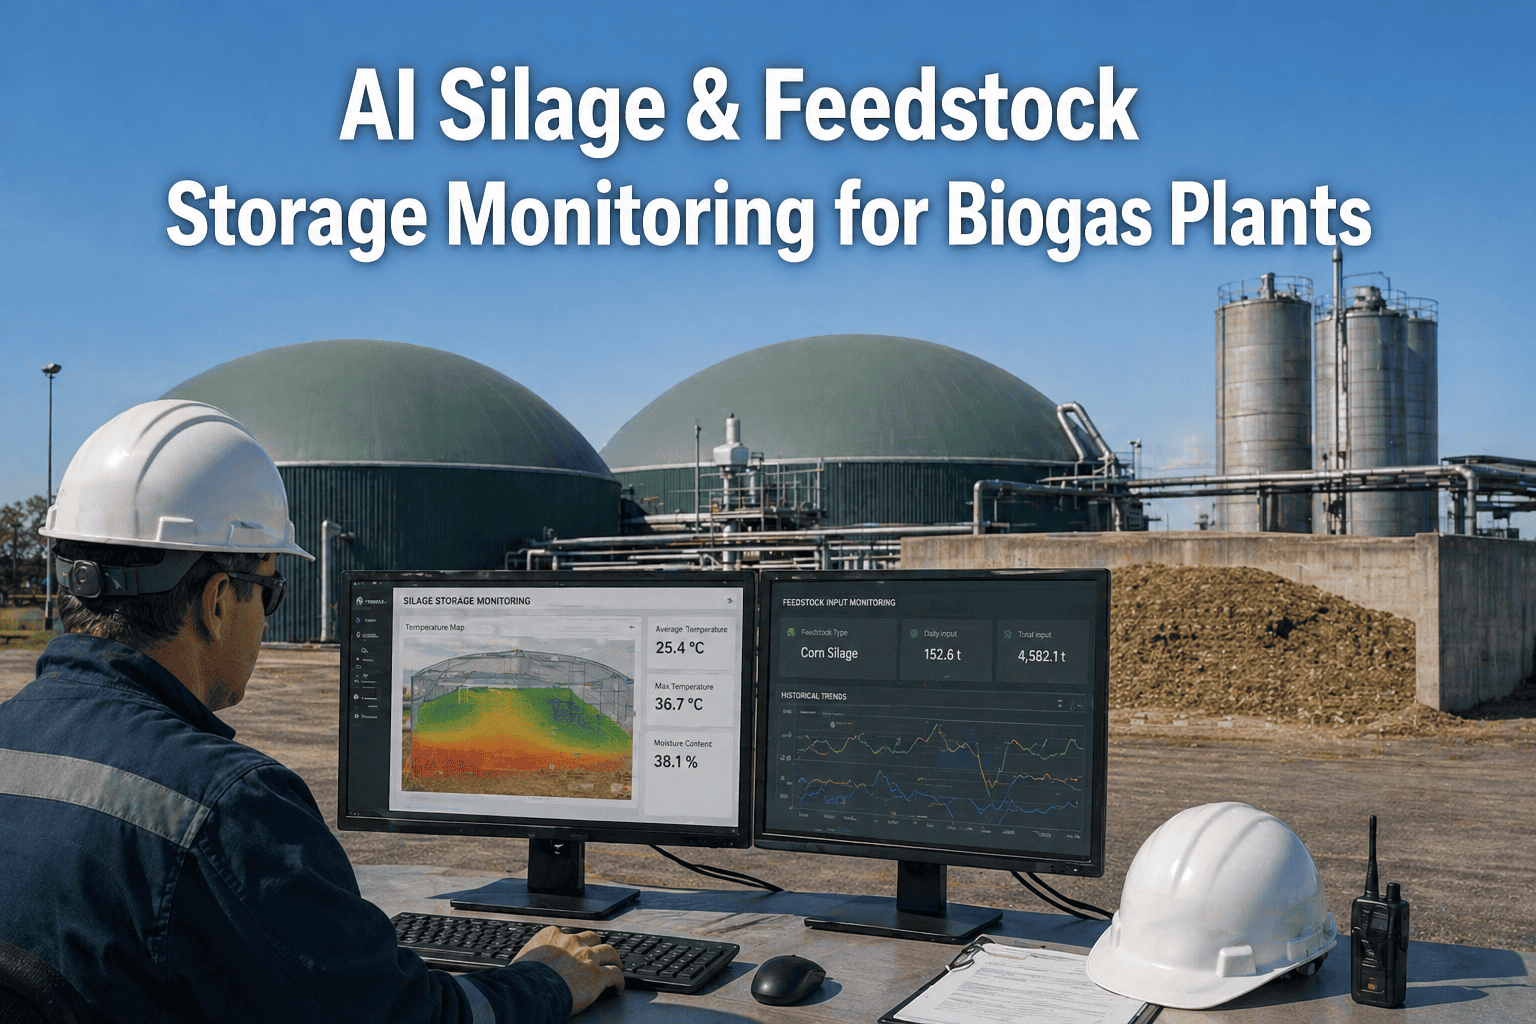
iFactory's vision platform monitors incoming organic waste, food waste, slurry, and agricultural feedstock deliveries at the intake and pre-treatment stage — 24/7, without manual inspection delays or visual blind spots during high-volume deliveries.
The Hidden Cost of Feedstock Blind Spots: Why Manual Inspection Fails Biogas Plants
Before exploring solutions, understand the root causes of contamination-related incidents in biogas operations. Manual feedstock monitoring workflows introduce systemic risks that compound over time — risks that AI vision intelligence directly addresses.
High-Volume Intake Inspection Gaps
Manual visual checks during truck unloading miss plastic bags, metal fragments, and oversized solids in fast-moving waste streams. Contaminants enter the pre-treatment system undetected — advancing to mixing equipment and digesters where they cause jams, damage, and process instability.
Pre-Treatment Screening Limitations
Basic mechanical screens and magnets catch only large metal objects and oversized materials. Flexible plastics, glass fragments, and composite materials pass through undetected — accumulating in digesters and reducing biogas yield over time.
Feedstock Quality Variability
Incoming waste quality fluctuates dramatically by supplier, season, and source. Without real-time quality scoring, plants accept contaminated loads that degrade digester performance — only discovering the impact weeks later through reduced biogas production or maintenance issues.
Equipment Damage & Downtime Escalation
Undetected contaminants cause progressive damage to macerators, pumps, and mixing systems. Without early detection, minor contamination escalates into major equipment failures requiring emergency shutdowns, costly repairs, and extended downtime that impacts biogas revenue.
How iFactory Solves Feedstock Contamination Detection Challenges in Biogas Plants
Traditional biogas plant feedstock monitoring relies on manual visual checks, basic mechanical screening, and reactive troubleshooting — all of which respond after contamination has already entered the system. iFactory replaces this with a continuous AI vision platform designed for waste intake workflows that detects contamination at the source, classifies waste quality before pre-treatment, and creates an actionable rejection or sorting roadmap for every incoming load. See a live demo of iFactory detecting simulated plastic contamination and metal debris using AI vision at a biogas plant intake bay.
01
AI-Powered Intake Contamination Detection
iFactory ingests high-resolution imagery from fixed and overhead cameras at intake bays and conveyor systems simultaneously — applying computer vision models to detect plastic films, metal fragments, glass, and oversized solids in real time. Contaminants flagged within seconds, before pre-treatment.
02
Feedstock Quality Classification & Scoring
Proprietary ML models classify each load as high-quality organic waste, moderate contamination (sortable), or severe contamination (rejection recommended) — with contamination type and severity scoring. Intake teams receive actionable quality grades, not generic alerts.
03
Predictive Equipment Protection
iFactory's trend analysis identifies suppliers or waste streams trending toward critical contamination thresholds — enabling proactive supplier quality discussions or enhanced screening before equipment damage occurs. Protect mixing systems before jams happen.
04
SCADA, Quality & CMMS Integration
iFactory connects to Siemens, Rockwell, Wonderware, SAP, and custom quality management systems via OPC-UA, REST APIs, and database connectors. Auto-link contamination alerts to load rejection workflows, supplier quality reports, and maintenance inspections. Integration completed in under 10 days.
05
Automated Compliance & Supplier Reporting
Generate audit-ready reports instantly: contamination trends by supplier, load acceptance/rejection rates, equipment protection metrics, and digester performance correlation. Pre-configured templates for EPA, ISO 14001, and internal quality audits.
06
Intake Decision Support
iFactory presents ranked intervention recommendations per load: accept as-is, manual sorting required, partial rejection, or full load rejection — with contamination cost estimates and digester impact projections. Teams act on verified data, not estimates.
Industry Standards Support: Built for Biogas Plant Requirements
iFactory's feedstock intelligence platform is pre-configured to meet the documentation and performance requirements of major biogas and waste management industry standards. No custom development needed — compliance reporting is automatic.
EPA 40 CFR 257 / 503
Biosolids and waste management standards: feedstock quality documentation, contamination tracking, and acceptance/rejection records — structured for regulatory audits and facility permit compliance.
ISO 14001 / 50001
Environmental management and energy efficiency standards: waste quality impact quantification, biogas yield optimization tracking, and preventive action documentation — structured for certification audits and verified performance improvements.
VDE 4260 / DVGW G 260
Biogas plant technical standards (EU/International): feedstock quality specifications, contamination limits, and process stability documentation — formatted for technical audits and digester performance validation.
RHI / Renewable Heat Incentive
Renewable energy certification programs: feedstock sustainability documentation, contamination-free processing verification, and biogas quality assurance — auto-generated for incentive program submissions and compliance reviews.
How iFactory Is Different from Generic Vision or Screening Tools
Most industrial monitoring vendors offer basic camera feeds or mechanical screening wrapped in a dashboard. iFactory is built differently — from the waste intake physics and contamination mechanisms up, specifically for biogas plant environments where complex waste streams, variable supplier quality, and progressive equipment damage determine what operational reliability actually means. Talk to our feedstock intelligence specialists and compare your current intake inspection approach directly.
iFactory Feedstock Intelligence Implementation Roadmap
iFactory follows a fixed 5-stage deployment methodology designed specifically for biogas plant feedstock intake — delivering pilot results in week 3 and full production rollout by week 7. No open-ended implementations. No operational disruption.
01
Intake Audit
Map intake points & camera placement
02
System Integration
Connect to SCADA, quality, CMMS via APIs
03
Pilot Configuration
Deploy AI vision to 2–3 critical intake bays
04
Validation & Training
User acceptance testing & intake team training
05
Full Production
Plant-wide AI vision feedstock monitoring go-live
7-Week Deployment and ROI Plan
Every iFactory engagement follows a structured 7-week program with defined deliverables per week — and measurable ROI indicators beginning from week 3 of deployment. Request the full 7-week deployment scope document tailored to your feedstock intake configuration.
Weeks 1–2
Discovery & Design
Critical intake point assessment and camera/data gap identification across delivery bays, conveyor systems, and pre-treatment areas
SCADA, quality management, and CMMS connection via OPC-UA or REST — minimal hardware additions required
Historical imagery, load acceptance logs, and equipment failure data ingestion for baseline contamination model training
Weeks 3–4
Pilot & Validation
Contamination detection models trained on your plant's specific waste streams, supplier profiles, and contamination patterns
Pilot monitoring activated on 2–3 highest-volume intake bays or critical pre-treatment conveyors
First contamination events detected — ROI evidence begins here
Weeks 5–7
Scale & Optimize
Alert thresholds refined based on pilot false positive and detection rate data
Coverage expanded to full plant feedstock intake network
Intake and quality team training completed — load acceptance/rejection protocols activated
ROI IN 5 WEEKS: MEASURABLE RESULTS FROM WEEK 3
Plants completing the 7-week program report an average of $172,000 in avoided equipment damage and downtime costs within the first 5 weeks of full production rollout — with feedstock quality improvements of 8.7–11.9% detected by week 3 pilot validation.
$172K
Avg. savings in first 5 weeks
8.7–11.9%
Feedstock quality gain by week 3
88%
Reduction in unplanned intake-related interventions
Eliminate Feedstock Blind Spots. Protect Equipment in 7 Weeks. ROI Evidence in Week 3.
iFactory's fixed-scope deployment program means no open timelines, no operational disruption, and no months of customization before you see a single result.
Use Cases and KPI Results from Live Deployments
These outcomes are drawn from iFactory deployments at operating biogas plants across three feedstock inspection categories. Each use case reflects 6-month post-deployment performance data. Request the full case study report for the feedstock type most relevant to your plant.
A mid-size food waste biogas facility processing 80 tons/day was experiencing recurring macerator jams traced to undetected plastic film and packaging materials in incoming loads. Legacy manual visual inspections during truck unloading identified contamination only after visible plastic accumulation or equipment stoppage — typically after 2–4 loads had already entered pre-treatment. iFactory deployed AI vision monitoring across all intake bays and primary conveyor systems, with plastic classification trained on packaging types and supplier profiles. Within 4 weeks of go-live, the system detected 31 early-stage plastic contamination events at the intake point — before any measurable equipment impact or digester contamination.
Book a Demo to see plastic film detection at biogas intake.
31
Pre-impact plastic contamination events detected in first 4 weeks
$420K
Estimated annual equipment damage & downtime cost avoided
97%
Detection accuracy on plastic film and packaging materials
Ready to protect your macerators and digesters from plastic contamination?
See how AI vision can detect plastic films, bags, and packaging before they enter your pre-treatment system — preventing jams, protecting equipment, and maintaining biogas yield.
Book a Demo — See Plastic Detection in Action
An agricultural biogas facility operating 3 digesters was generating 38–54 false positive metal detector alerts per month from legacy sensor systems — leading intake teams to over-reject loads entirely. iFactory replaced threshold logic with graded AI vision classification of intake bay imagery, reducing actionable alerts to under 5 per month while increasing actual metal and glass detection effectiveness from 51% to 95%. Unplanned pump and valve interventions dropped by 49.3% as inspection accuracy was restored.
Book a Demo to see metal and glass detection with AI vision.
95%
Metal/glass detection effectiveness — up from 51% with legacy alerts
49.3%
Reduction in unplanned pump and valve interventions
92%
Reduction in monthly false positive alert volume
Tired of false alarms and missed metal debris?
See how AI vision distinguishes between harmless materials and dangerous metal fragments or glass — reducing false alarms while catching what matters before it damages your pumps and valves.
Book a Demo — See Metal & Glass Detection
A municipal waste biogas plant was losing an average of $360K annually in emergency macerator repairs and digester cleaning, traced to undetected oversized solids and progressive supplier quality degradation. Manual intake inspections identified oversized materials only after visible blockages or post-fault investigation — typically after 1–3 days of progressive accumulation. iFactory's multi-angle vision correlation and supplier tracking models identified all 13 active contamination patterns within 48 hours of go-live, enabling targeted load rejection and supplier quality discussions without operational disruption.
Book a Demo to see supplier quality tracking and oversized solids detection.
$360K
Annual emergency repair & cleaning cost eliminated
48hrs
Time to identify all 13 active contamination patterns from go-live
$680K
Annual operational value from proactive supplier quality management
Want to catch contamination before it reaches your digesters?
See how AI vision tracks supplier quality trends and detects oversized solids in real-time — enabling proactive conversations with suppliers and protecting your digesters from costly contamination.
Book a Demo — See Supplier Quality Tracking
What Biogas Plant Leaders Say About iFactory Feedstock Platform
The following testimonial is from a plant operations director at a US facility currently running iFactory's AI vision feedstock inspection platform.
We transformed feedstock intake from reactive problem-solving to proactive quality management. iFactory's AI vision detected plastic film contamination in a high-volume food waste delivery 6 hours before it would have entered our macerator — allowing us to reject the load at the intake bay instead of facing a $180K macerator repair and 3-day digester shutdown. That single event paid for the entire system. Now every intake bay in our facility is monitored 24/7 with confidence that no contamination slips through. Our equipment reliability has never been higher, and our supplier quality conversations are now data-driven instead of confrontational.
Director of Plant Operations
Food Waste Biogas Facility, California
Frequently Asked Questions
Does iFactory require new cameras or sensors to be installed?
In most deployments, iFactory connects to existing plant camera systems or adds minimal new hardware. Where coverage gaps are identified during the Week 1–2 audit, targeted additions are recommended only (typically 2–4 industrial-grade cameras per critical intake bay or conveyor), not a full instrumentation overhaul. Integration is complete within 10 days in standard environments.
Which SCADA, quality, and maintenance systems does iFactory integrate with?
Integrates natively with Siemens PCS 7, Rockwell PlantPAx, Wonderware, SAP QM, IBM Maximo, and custom quality platforms via OPC-UA, REST APIs, and database connectors. Custom integration support is available for legacy systems. Integration scope is confirmed during the Week 1 intake audit.
How does iFactory handle different waste types and supplier profiles?
Trains separate sub-models per waste stream and supplier category — accounting for food waste, agricultural slurry, municipal organic waste, and industrial organic differences in contamination signatures, acceptable quality thresholds, and digester impact profiles. Multi-stream facilities are fully supported within a single deployment. Type-specific detection parameters are configured during the Week 3–4 model training phase.
What industry standards does reporting support?
Auto-generates structured operational reports formatted for EPA 40 CFR 257/503, ISO 14001/50001, VDE 4260/DVGW G 260 (EU biogas standards), and RHI renewable heat incentive programs. Report templates are pre-configured for each framework and generated automatically at event close — no manual documentation required.
How long does it take before the model produces reliable contamination detections?
Baseline model training on historical imagery, load acceptance logs, and equipment failure data typically takes 4–6 days using 60–90 days of plant operating history. First live detections are validated during the Week 3–4 pilot phase. Full model calibration — with false positive rate under 5% — is achieved within 5 weeks of deployment for standard biogas plant feedstock intake networks.
Can iFactory optimize monitoring under seasonal or supplier variations?
Yes. Uses adaptive forecasting — combining historical contamination baselines, seasonal waste composition patterns, supplier performance trends, and real-time vision feedback — to detect quality degradation and optimize load acceptance thresholds across all conditions. Seasonal waste variations, new supplier onboarding, and changing waste stream compositions are fully supported. Optimization scope is confirmed during the Week 1 intake audit.
Stop Guessing Feedstock Quality. Start Protecting Equipment. Deploy AI Vision in 7 Weeks.
Gives biogas plant teams real-time contamination detection, feedstock quality classification, predictive supplier management, and intake decision support — fully integrated with your existing SCADA, quality, and maintenance systems in 7 weeks, with ROI evidence starting in week 3.
97% contamination detection before measurable equipment impact
SCADA, quality & CMMS integration in under 10 days
Supplier quality tracking with under 5% false positive rate
Auto-generated reports for EPA, ISO, VDE, and RHI frameworks