Feedstock costs as share of total biogas plant operating expenditure — the largest single cost driver in AD operations
+25%
Biogas yield improvement achievable through optimized feedstock blending and real-time dosing adjustment based on substrate quality data
$180K
Annual cost savings per facility from reduced rejected loads, optimized storage management, and avoided contract penalties
85%
Top-quartile facilities consistently achieving feedstock consistency targets through systematic supplier management and quality verification
Ready to reduce feedstock variability and maximize biogas yield across your AD facility? Book a demo of iFactory's feedstock management platform and see how leading biogas operators are transforming substrate management.
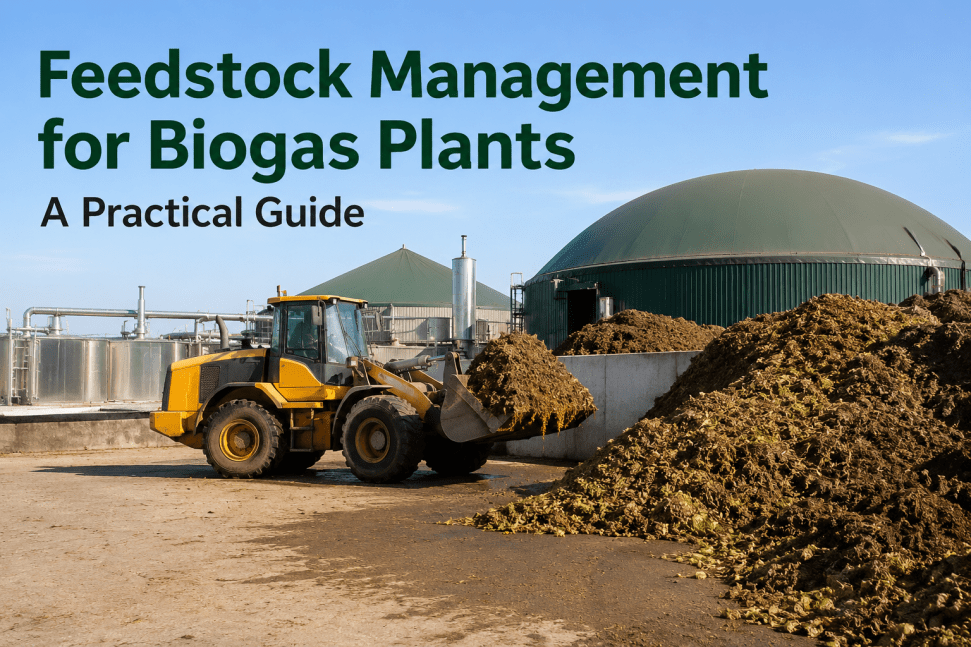
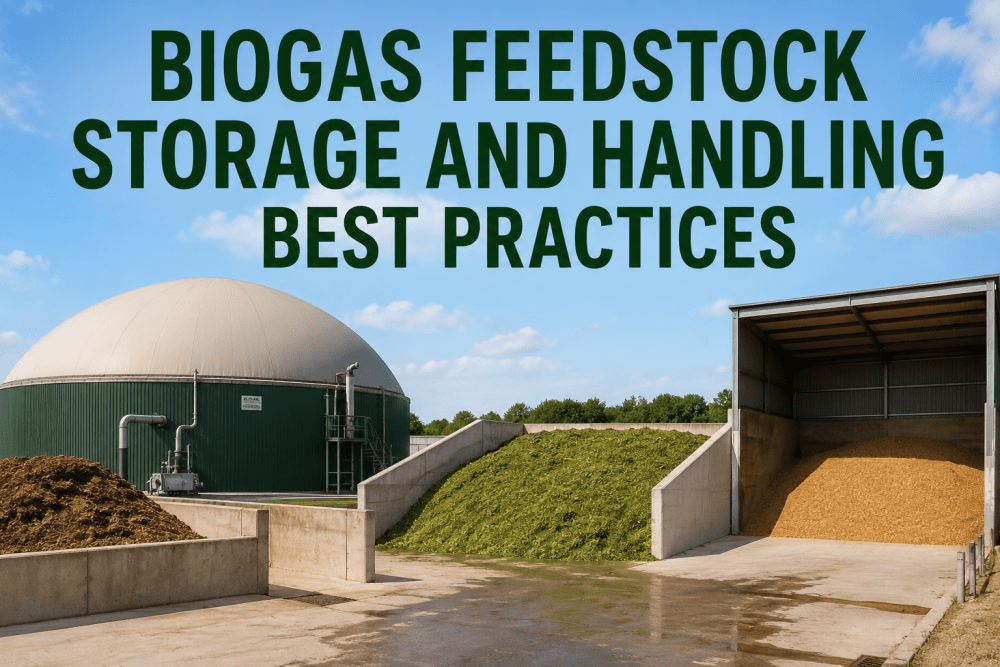
Every biogas plant is fundamentally a feedstock conversion system. The digester converts chemical energy in organic substrates into methane; the CHP engine converts that methane into electricity and heat; the digestate processing system converts residuals into fertilizer products. At every stage of that conversion chain, feedstock quality is the independent variable that determines output — and feedstock quality is not a fixed property. It varies by supplier, by season, by storage duration, by contamination level, and by the specific blend ratios used at the point of dosing. The difference between a facility that manages these variables systematically and one that manages them reactively is measurable in yield, uptime, and margin.
Variable Substrate Quality
Feedstock suppliers deliver material with unpredictable dry solids content, organic loading, and contamination levels. Without systematic quality verification at the weighbridge, inconsistent substrate quality propagates through the entire digestion process, reducing gas yield and increasing digester instability risk.
Supply Chain Disruption
Seasonal feedstock shortages, competing off-takers, and transportation disruptions create supply gaps that force suboptimal substitutions or reduced loading rates. Facilities without real-time inventory visibility and supplier performance tracking are consistently caught off-guard by avoidable shortages.
Storage Degradation Losses
Feedstock stored on-site loses methane potential over time through aerobic degradation, leachate generation, and dry matter loss. Facilities without active storage management — first-in-first-out rotation, temperature monitoring, and residence time tracking — lose 8–15 percent of feedstock methane potential before it reaches the digester.
Dosing Inaccuracy
Manual or timer-based dosing regimes cannot account for real-time variation in substrate quality arriving at the digester. Feed rate adjustments based on yesterday's laboratory analysis or weekly averages inevitably produce periods of overloading and underloading that reduce digestion efficiency and increase the risk of process upset.
Regulatory Compliance Burden
Digestate quality standards, feedstock traceability requirements, and waste acceptance criteria impose documentation and testing obligations that grow with each regulatory cycle. Facilities relying on manual record-keeping face disproportionate compliance labor costs and elevated audit non-conformance risk.
Contract Commitment Risk
Power purchase agreements, renewable heat incentive contracts, and digestate offtake agreements all depend on consistent output volumes. Feedstock variability that reduces gas production by 10–15 percent during a contract period directly impacts revenue through reduced generation, buyback penalties, or volume shortfall deductions.
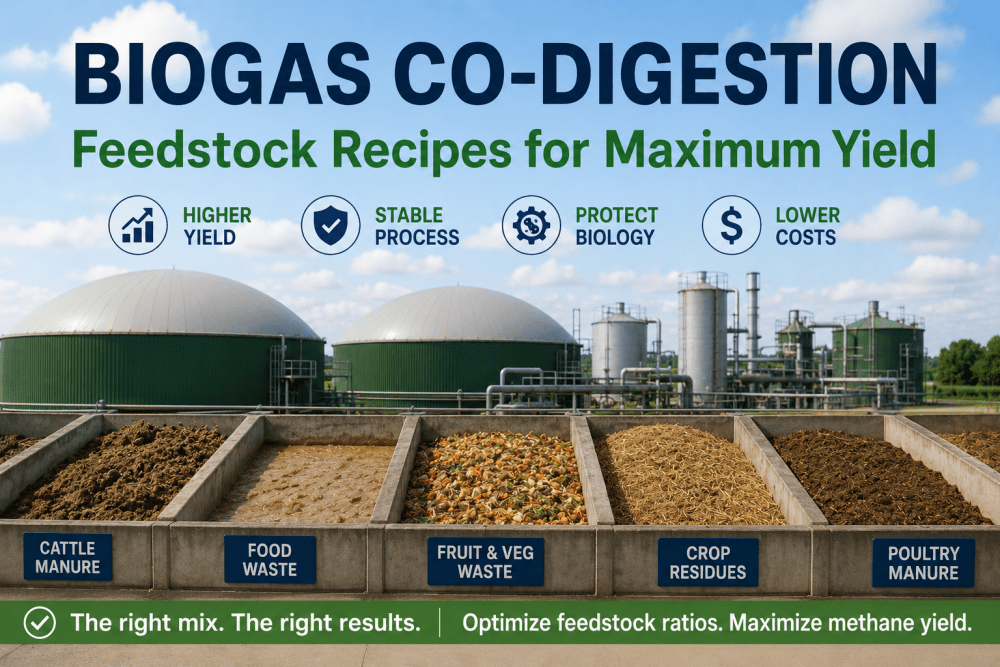
Feedstock Types and Characteristics Compared
Every biogas facility manages a unique feedstock portfolio shaped by regional agricultural patterns, local waste streams, and the plant's specific digestion process. Understanding the yield characteristics, storage behavior, and seasonal availability of each substrate type is the foundation of effective feedstock planning. The following comparison table maps the key parameters across the six most common AD feedstock categories used at North American biogas facilities.
Feedstock Type
Biogas Yield (m³/ton)
Dry Solids %
Methane Content %
Storage Stability
Seasonality
Contamination Risk
Dairy Manure
20–35
8–12
55–60
Moderate — rapid degradation in warm conditions
Year-round, consistent
Low — sand and grit only
Food Waste (Pre-consumer)
100–150
25–35
60–65
Low — rapid acidification within 24–48 hours
Year-round, moderate variation
Moderate — packaging, plastics, metals
Corn Silage
180–220
30–35
52–55
High — ensiled storage preserves yield for 12+ months
Harvest-dependent (Sep–Nov)
Low — soil and crop debris only
Poultry Litter
80–130
50–70
55–65
Moderate — nitrogen volatilization in storage
Year-round, bird flock cycles
Moderate — antibiotics, heavy metals
Wastewater Sludge
15–30
3–6
58–65
Low — rapid degradation within hours
Year-round, consistent
High — microplastics, heavy metals, pharmaceuticals
Energy Crops (Grass, Rye)
100–180
25–40
52–56
High — clamp storage preserves yield for 6–9 months
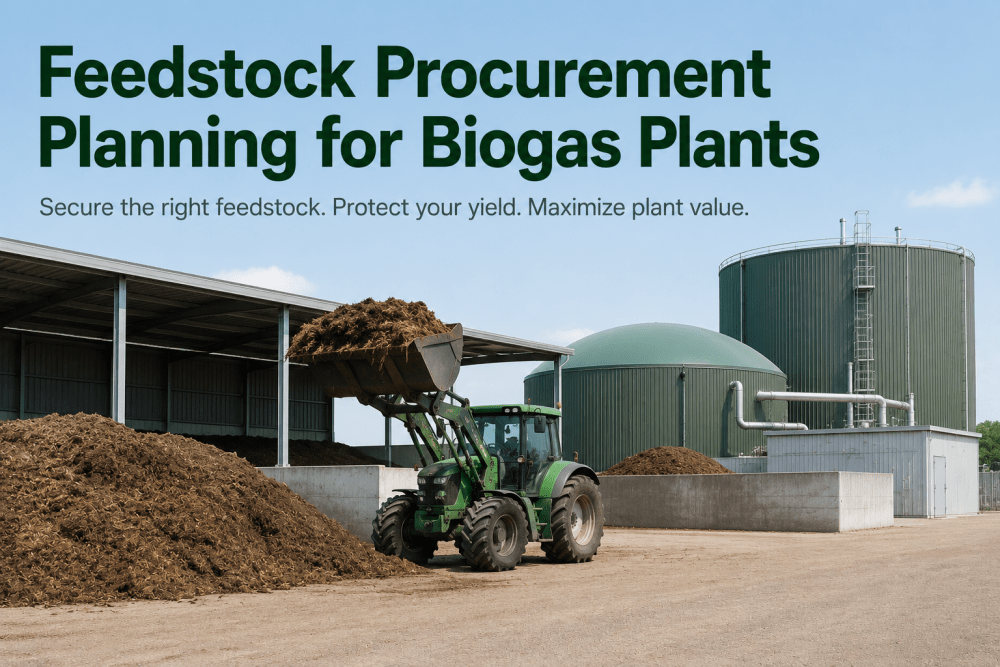
Effective feedstock management begins before the first delivery truck arrives. A systematic planning and sourcing framework — built on supplier qualification, quality specification, delivery scheduling, and inventory forecasting — creates the operational stability that allows downstream dosing and digestion processes to operate at peak efficiency. The following checklist maps the foundational planning and sourcing practices used by top-quartile biogas facilities across North America.
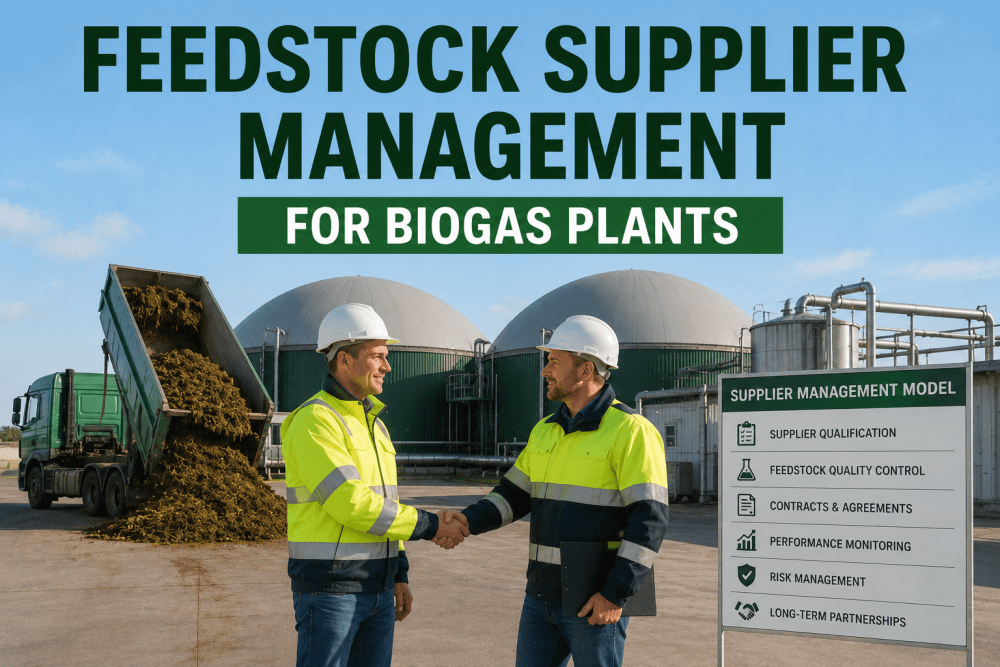
Feedstock Planning and Sourcing Best Practices for AD Facilities
Supplier Qualification Program: Establish minimum quality specifications for each feedstock type — dry solids range, organic content, contamination limits, and pathogen reduction status — and audit every supplier against these criteria before accepting deliveries.
Forward Supply Contracts: Secure 60–90 day forward supply commitments from primary feedstock suppliers with defined quality bands, delivery schedules, and rejection terms for out-of-specification material. Maintain a secondary supplier list for each feedstock type as a supply continuity buffer.
Weighbridge Quality Verification: Deploy near-infrared or FTIR analysis at the weighbridge for real-time feedstock quality assessment. Measure dry solids, volatile solids, and contamination levels before accepting each delivery rather than relying on supplier-provided specifications.
Inventory Forecasting: Maintain a rolling 30-day feedstock inventory forecast that accounts for confirmed deliveries, historical supplier reliability, seasonal availability shifts, and planned maintenance windows. Use the forecast to proactively identify supply gaps before they become operational problems.
Quality-Linked Pricing: Structure supplier contracts with quality-linked pricing tiers — premium rates for feedstock meeting target specifications, standard rates for acceptable quality, and rejection or discount rates for out-of-specification material. Align supplier incentives with your quality requirements.
Supplier Performance Scorecard: Track each supplier against on-time delivery rate, quality specification compliance, contamination incidents, and volume consistency. Review performance quarterly and use the scorecard data to guide contract renewal and allocation decisions.
Regulatory Compliance Documentation: Maintain complete traceability documentation for every feedstock delivery — source origin, transport chain, quality test results, waste classification codes, and acceptance/rejection records — in a single auditable system that satisfies federal, state, and local regulatory requirements.
Seasonal Buffer Planning: Build seasonal storage capacity for feedstocks with harvest windows — corn silage, energy crops, seasonal food processing waste — and plan storage utilization to maintain consistent digester loading through feedstock-constrained periods.
60 Days
Forward feedstock supply commitment required for reliable digester loading planning
8–15%
Methane potential lost per week of unmanaged on-site feedstock storage
92%
On-time delivery rate achieved by top-quartile feedstock supplier programs
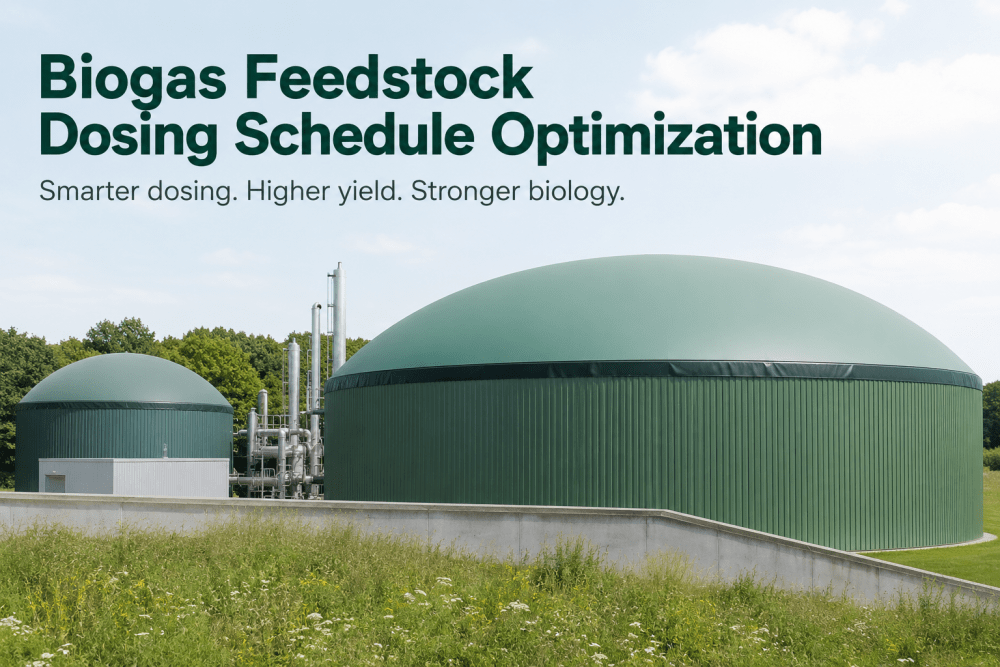
Storage and Dosing Best Practices
The gap between feedstock arriving at the plant gate and feedstock entering the digester is where the most preventable yield losses occur. Storage degradation, improper blending, and dosing inaccuracy collectively account for 15–25 percent of unrealized biogas potential at facilities relying on manual management. A systematic storage and dosing framework — built on residence time tracking, real-time quality measurement, and automated feed rate adjustment — closes that gap. The following process maps the key stages of a well-managed feedstock storage and dosing operation.
01
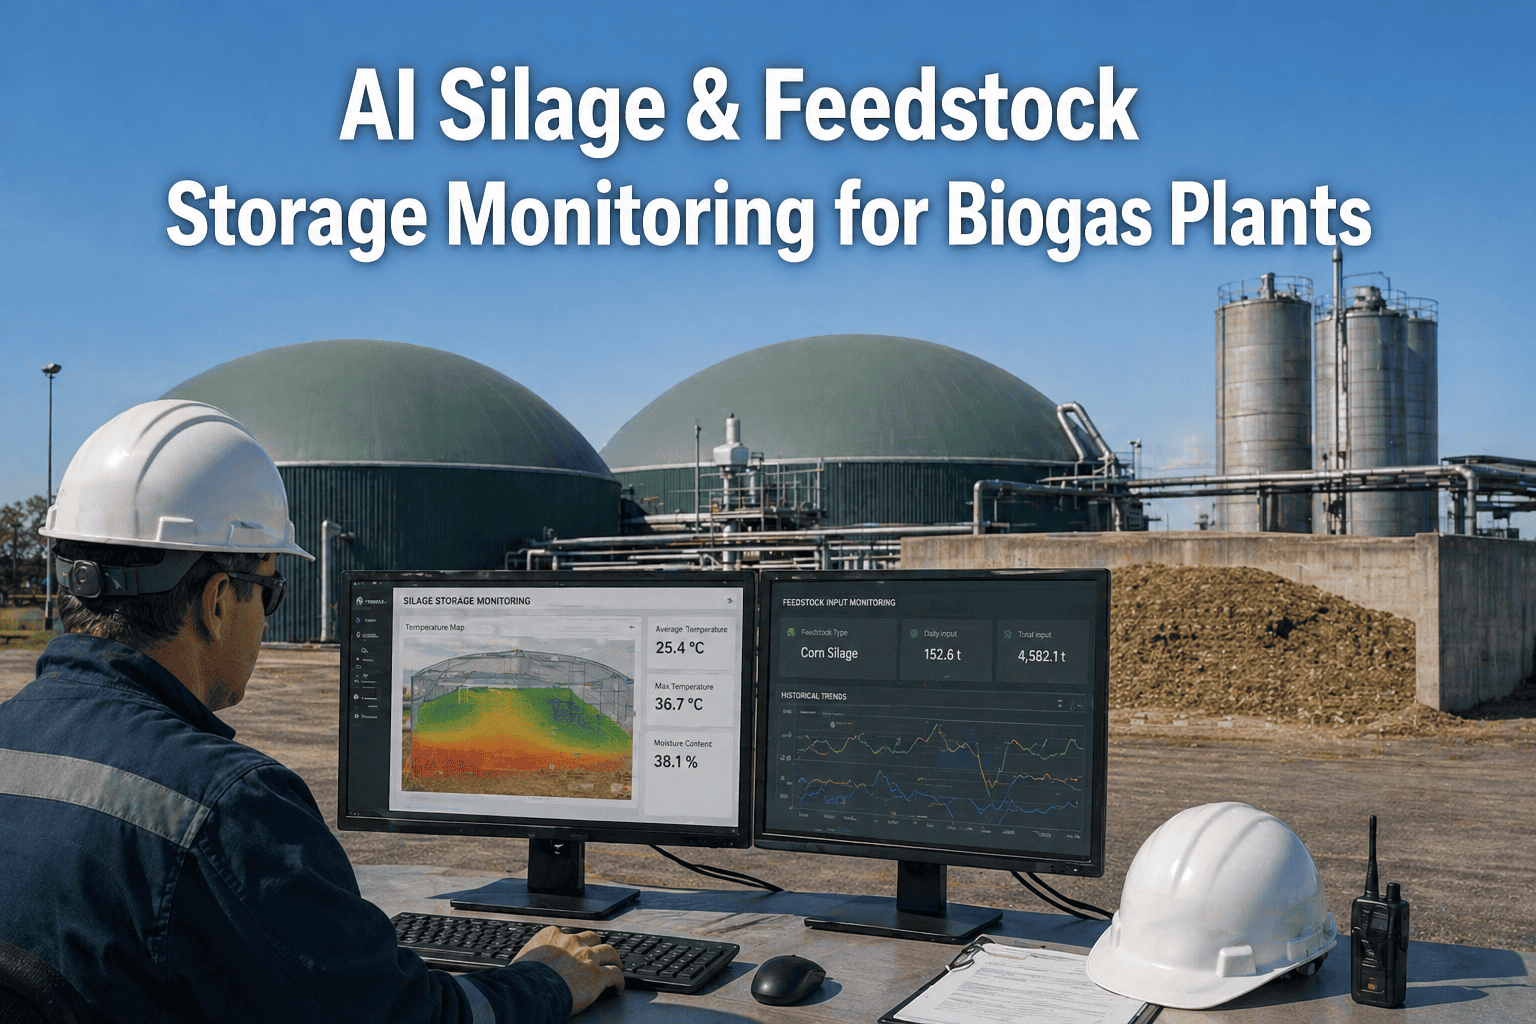
Receiving and Quality Verification
Every feedstock delivery is weighed and sampled at the weighbridge. Near-infrared analysis provides real-time dry solids, volatile solids, and contamination data within 60 seconds. The system compares measured quality against the supplier's declared specification and the plant's acceptance criteria. Out-of-specification loads are flagged for rejection or renegotiation before the truck enters the storage area.
02
Storage Assignment and Residence Time Tracking
Each accepted load is assigned to a specific storage location — silage clamp, slurry pit, food waste hopper, or covered bunker — based on its feedstock type, quality characteristics, and expected storage duration. The system tracks residence time for each storage location and generates alerts when any batch approaches its maximum recommended storage window, triggering first-in-first-out rotation.
03
Storage Condition Monitoring
Temperature sensors, gas detectors, and visual monitoring systems track storage condition continuously. Rising temperature in a silage clamp indicates aerobic spoilage initiation. Elevated hydrogen sulfide or ammonia in slurry storage signals degradation that will reduce methane yield. These alerts prompt immediate intervention — clamp sealing, mixing, or priority feeding — before significant methane potential is lost.
04
Blend Optimization
The system calculates the optimal feedstock blend for the next 24–48 hour dosing period based on available inventory, real-time quality data, current digester conditions, and target gas production. The blend is optimized for methane yield per ton, nutrient balance, and process stability — not simply for least-cost formulation, which often produces suboptimal digestion outcomes.
05
Automated Dosing Control
The optimized blend is executed through automated dosing equipment — screw feeders, slurry pumps, and mix tanks — that deliver each substrate at the calculated rate with precision within ±2 percent of target. Real-time feed rate adjustments are made automatically when weighbridge quality data or digester condition sensors indicate a need for blend modification.
06
Performance Feedback Loop
Actual biogas yield, methane content, digestate quality, and process stability data are continuously compared against the predicted outcomes for each blend formulation. The system learns from every dosing cycle and refines its blend optimization algorithms, improving yield prediction accuracy and dosing precision over time.
Transform Your Feedstock Operations with Real-Time Intelligence
iFactory's feedstock management platform connects weighbridge quality verification, storage tracking, blend optimization, and automated dosing control into a single operational system purpose-built for biogas facilities — delivering measurable improvements in yield, uptime, and margin from the first month of deployment.
What gets measured gets managed — and the most effective feedstock management programs are built on a defined set of key performance indicators that connect feedstock quality to plant-level outcomes. Tracking the right metrics at the right frequency transforms feedstock data from a record-keeping obligation into an operational decision tool. The following KPI framework is used by top-quartile biogas facilities to monitor, benchmark, and continuously improve their feedstock management performance.
94%
Feedstock Quality Conformance
Percentage of delivered feedstock tons meeting specified quality parameters — tracked weekly per supplier per feedstock type, trended monthly
3.2%
Storage Dry Matter Loss
Measured dry solids loss between weighbridge acceptance and digester entry — benchmark target below 5 percent for all storage configurations
96%
On-Time Dosing Accuracy
Percentage of dosing events within ±5 percent of calculated target feed rate — measured per dosing cycle, tracked per asset per shift
0.3%
Rejected Load Rate
Percentage of delivered feedstock tons rejected at weighbridge for quality non-conformance — early indicator of supplier quality deterioration
14 Days
Average Storage Residence
Mean feedstock residence time across all on-site storage — tracked per feedstock type to ensure timely rotation and minimize degradation losses
1.2%
Digester pH Variance
Standard deviation of digester pH from target range — directly correlated with feedstock consistency and dosing precision at the point of entry
Real-Time
Quality Verification
NIR analysis at weighbridge delivers feedstock quality data within 60 seconds of each delivery
Automated
Blend Optimization
System calculates optimal feedstock blend for maximum yield based on real-time quality and inventory data
±2%
Dosing Precision
Automated dosing equipment delivers each substrate at calculated target rate with industry-leading accuracy
Full
Regulatory Traceability
Complete feedstock provenance, quality, and acceptance records in auditable digital format
Expert Review: What Feedstock Managers Get Wrong About Substrate Management
The most expensive mistake I see across North American AD facilities is treating feedstock management as a procurement function rather than a process optimization function. Procurement teams negotiate price and delivery volume — which are important — but they rarely track quality variability across suppliers or connect feedstock quality data to digester performance. The result is that facilities pay different prices for different quality materials without knowing which suppliers actually deliver the highest methane yield per ton. I have audited facilities where the cheapest feedstock supplier was actually the most expensive in terms of yield loss, process instability events, and maintenance cost. A feedstock management system that tracks quality from weighbridge to digester and correlates that data with gas production output transforms procurement from a cost center into a profit center. The technology exists. The gap is that most facilities have not connected the data streams.
Senior Biogas Process Engineer
AD Operations and Feedstock Management Consulting, 22 Years
Storage management is the overlooked leverage point in biogas plant profitability. Operators focus intensely on digester conditions and CHP maintenance — correctly — but they accept 10–15 percent methane potential losses in storage as inevitable. They are not inevitable. I have worked with facilities that reduced storage dry matter loss from 14 percent to under 4 percent simply by implementing residence time tracking, temperature monitoring, and systematic first-in-first-out rotation..
Feedstock Management and Storage Specialist
Biogas Substrate Consulting Practice, 18 Years
Frequently Asked Questions
Energy-dense substrates with high volatile solids content and good methane potential per ton — such as corn silage (180–220 m³/ton biogas yield), pre-consumer food waste (100–150 m³/ton), and energy crops like grass or rye (100–180 m³/ton) — deliver the highest biogas yields per ton of feedstock. However, yield per ton is only one dimension of feedstock value. The optimal feedstock portfolio also considers cost per ton, storage stability, seasonal availability, contamination risk, and digestate quality impact. Many high-yielding feedstocks carry higher procurement costs, shorter storage windows, or greater contamination exposure that must be factored into the total cost-benefit calculation. iFactory's blend optimization engine evaluates all six dimensions simultaneously to recommend the optimal feedstock mix for each facility's specific conditions and contract commitments.
Storage methane potential loss varies significantly by feedstock type, storage configuration, and management practices. For uncovered slurry stores, dry matter losses of 8–15 percent per week are common during summer months due to biological degradation and ammonia volatilization. Well-managed silage clamps with proper sealing and compaction lose 3–6 percent of dry matter over 6–9 months of storage, while poorly managed clamps can lose 15–25 percent. Food waste stored in enclosed hoppers with temperature control typically loses 2–5 percent over 48–72 hours. The key variable is active management: facilities that track storage residence time, monitor temperature and gas indicators, and maintain systematic first-in-first-out rotation consistently achieve storage losses below half of those at facilities relying on passive management. iFactory's storage tracking module provides real-time residence time monitoring, degradation alerts, and automated rotation scheduling to minimize methane potential loss across all storage configurations.
Near-infrared spectroscopy analysis at the weighbridge represents the current best practice for real-time feedstock quality verification. A single NIR scan of each delivery provides dry solids content, volatile solids content, crude protein, crude fat, fiber fractions, and estimated methane potential within 60 seconds — replacing laboratory analysis that typically requires 24–48 hours for results. For facilities without NIR capability, rapid moisture analyzers and visual contamination screening at the weighbridge provide a practical minimum quality verification. Additional testing for specific contaminants — heavy metals in wastewater sludge, antibiotics in poultry litter, packaging fragments in food waste — should be conducted based on the known risk profile of each supplier.
Feedstock blend optimization improves profitability through three distinct mechanisms. First, yield optimization: blending high-yielding energy crops with lower-yielding waste streams in the correct ratio maximizes the methane yield per cubic meter of digester volume, increasing gas production without requiring additional feedstock procurement. Second, process stability: optimized blending maintains consistent nutrient balance, pH buffer capacity, and volatile fatty acid loading — reducing process upset events that cause production interruptions and recovery periods that can last days to weeks. Third, margin optimization: the system balances yield improvement against feedstock procurement cost, recommending blends that maximize the net margin per ton rather than simply maximizing yield. Facilities using systematic blend optimization report 15–25 percent improvement in biogas yield, 30–50 percent reduction in process upset events, and 8–12 percent improvement in net feedstock margin. iFactory's blend optimization engine evaluates available inventory, real-time quality data, digester conditions, and cost parameters simultaneously to recommend the optimal blend for each dosing period.
Regulatory requirements for feedstock management documentation vary by jurisdiction, feedstock type, and facility classification, but the core documentation framework is consistent across North American AD operations. The minimum documentation package includes: feedstock provenance records documenting source origin, supplier identification, and transport chain for every delivery; quality test results demonstrating compliance with waste acceptance criteria, contaminant limits, and pathogen reduction requirements; delivery acceptance records showing weighbridge weight, test results, and acceptance or rejection decisions for each load; feedstock inventory records tracking storage location, residence time, and condition monitoring data for all on-site material; and digestate quality records connecting feedstock inputs to digestate output characteristics for regulatory reporting.
From Weighbridge to Digester — Complete Feedstock Intelligence for Maximum Yield
iFactory's feedstock management platform connects weighbridge quality verification, supplier performance tracking, storage condition monitoring, blend optimization, and automated dosing control into a single system purpose-built for North American biogas facilities — delivering measurable yield improvement, cost reduction, and compliance confidence from month one.
Conclusion: Feedstock Intelligence Is Plant Profitability
Feedstock management is not a support function in biogas plant operations — it is the primary determinant of plant profitability, operational stability, and regulatory compliance. The difference between facilities that manage feedstock through systematic data and those that manage it through manual spreadsheets and operator experience is measurable across every dimension that matters: biogas yield per ton, process stability events per quarter, maintenance cost per MWh, and compliance audit findings per year. The technology to close that gap exists today — weighbridge NIR analysis, real-time storage monitoring, automated blend optimization, and precision dosing control — and the integration of these capabilities into a single feedstock intelligence platform has been proven across operating facilities at every scale.
The core insight that separates high-performing AD facilities from average ones is simple and consistently observed: feedstock variables determine plant outcomes. Facilities that measure those variables systematically, at the right frequency and resolution, and connect that data to operational decisions through real-time analytics and automation, achieve consistently superior results. Facilities that continue to manage feedstock through informal practices and disconnected data streams will find the competitive gap widening as feedstock costs rise, regulatory requirements tighten, and contract performance expectations increase. The question for every AD facility is not whether to invest in feedstock intelligence systems — it is whether the cost of not investing has become higher than the cost of implementation. For most facilities, that threshold has already passed.