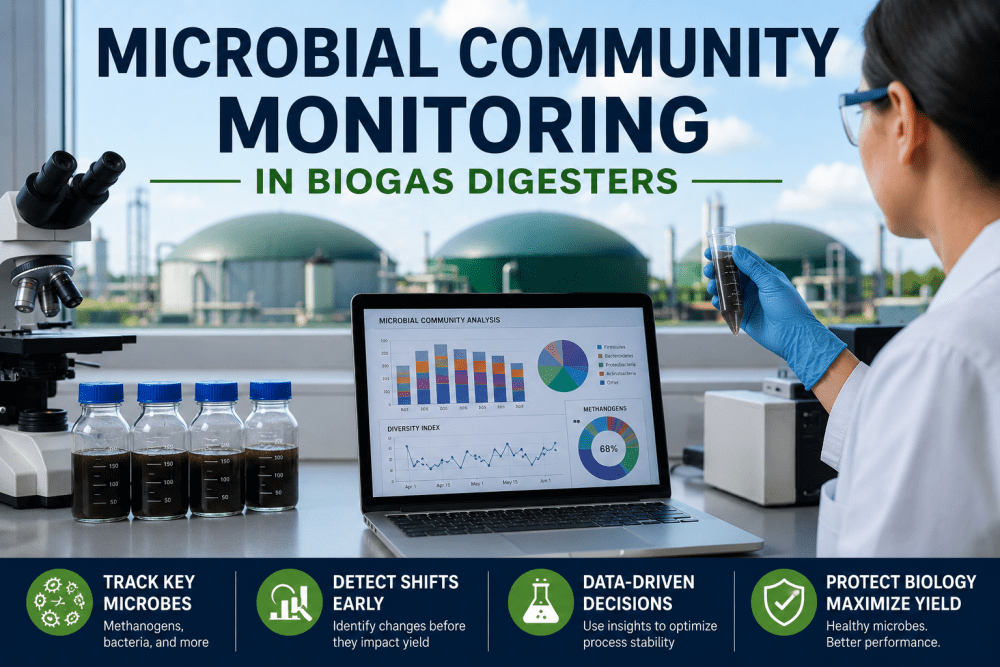
Every biogas plant operator knows that methane yield does not stay constant — it shifts with feedstock changes, organic loading rate adjustments, temperature swings, and ammonia accumulation. What drives those shifts is the microbial community living inside the digester: methanogens converting acetate and hydrogen to methane, hydrolytic bacteria breaking down complex polymers, and acetogens linking the two processes. Microbial community monitoring — tracking shifts in population abundance, metabolic activity, and syntrophic relationships — gives operators a direct window into digester biology that conventional chemistry-based monitoring cannot match. iFactory AI's integrated platform, spanning predictive analytics, digital twin simulation, AI vision, robotics orchestration, and automated compliance management, provides biogas plant operators with the data infrastructure needed to correlate microbial community data with process parameters and take corrective action before yield drops. Book a Demo to see how iFactory AI connects lab data to digester control in real time.
Is Your Biogas Plant Monitoring the Biology — or Only the Chemistry?
iFactory AI connects microbial community sequencing data with real-time process analytics — giving operators the tools to detect methanogen decline and syntrophic imbalance before VFA accumulation signals a digester in crisis.
Why Microbial Community Monitoring Matters for Biogas Yield Stability
Anaerobic digestion depends on a precisely coordinated microbial food chain: hydrolytic bacteria break down carbohydrates, proteins, and lipids into sugars, amino acids, and long-chain fatty acids; fermentative bacteria convert those monomers into volatile fatty acids, alcohols, and hydrogen; acetogens further break down these products into acetate, carbon dioxide, and hydrogen; and methanogens consume these substrates to produce methane. Each trophic group depends on the output of the group upstream — and each group has different sensitivity to pH, temperature, ammonia concentration, and substrate availability. When any link in this chain weakens, the downstream effects propagate through the entire community, and methane yield is the final output that suffers. Book a Demo to see iFactory AI's biogas analytics platform in action.
Hydrolytic Bacteria
Hydrolytic bacteria such as Clostridia, Bacteroidetes, and Firmicutes produce extracellular enzymes that break down cellulose, hemicellulose, starch, proteins, and lipids into soluble monomers. Their population abundance directly correlates with hydrolysis rate — a drop in hydrolytic activity signals that complex substrate breakdown is slowing, starving downstream trophic groups of the substrates they need for methane production.
Acidogenic & Acetogenic Bacteria
Acidogenic bacteria convert hydrolysis products into volatile fatty acids, alcohols, and hydrogen. Acetogens further convert propionate, butyrate, and longer-chain fatty acids into acetate, hydrogen, and carbon dioxide — the direct substrates for methanogenesis. Propionate accumulation is a classic indicator of acetogenic stress; its oxidation is thermodynamically unfavorable at elevated hydrogen partial pressure, making propionate a sensitive early warning of community imbalance.
Hydrogenotrophic Methanogens
Hydrogenotrophic methanogens such as Methanobacterium, Methanoculleus, and Methanothermobacter consume hydrogen and carbon dioxide to produce methane. They maintain the low hydrogen partial pressure that makes propionate and butyrate oxidation thermodynamically feasible — a critical syntrophic relationship. When hydrogenotrophic methanogen activity drops, hydrogen accumulates, propionate oxidation stalls, and the entire carbon flow to methane is disrupted.
Acetoclastic Methanogens
Acetoclastic methanogens such as Methanosaeta and Methanosarcina cleave acetate into methane and carbon dioxide, accounting for approximately 70% of methane production in most anaerobic digesters. Methanosaeta dominates at low acetate concentrations due to its high substrate affinity, while Methanosarcina predominates at higher acetate levels.
Methods for Monitoring Microbial Communities in Biogas Digesters
Microbial community monitoring in anaerobic digesters has evolved from research-focused metagenomic surveys to operational tools that plant operators can use for routine process surveillance. The selection of monitoring method depends on the information resolution required, the turnaround time for corrective action, and the laboratory infrastructure available at the plant site. The table below compares the principal methods available for biogas microbial monitoring, their information yield, time to result, and practical applicability for plant operations. Book a Demo to discuss which monitoring approach fits your plant configuration.
| Monitoring Method | What It Measures | Resolution | Turnaround Time | Operational Value |
|---|---|---|---|---|
| 16S rRNA Gene Amplicon Sequencing | Taxonomic composition — relative abundance of bacterial and archaeal genera | Genus-level identification of community structure | 24-48 hours from sample to result | Identifies population shifts that precede yield changes by 1-3 retention times |
| Quantitative PCR (qPCR) | Absolute copy number of specific functional genes — mcrA for methanogens, hyd for hydrogenotrophs | Targeted quantification of key functional groups | 4-6 hours | Enables rapid confirmation of suspected population decline for specific trophic groups |
| Metatranscriptomics | Gene expression levels — which metabolic pathways are actively being transcribed | Functional activity mapping of the entire community | 48-72 hours | Detects metabolic stress before population abundance declines — earliest possible warning |
| Flow Cytometry | Total cell count, viability, and metabolic activity staining | Population-level viability and activity metrics | 1-2 hours | Provides same-shift activity measurement for rapid operational response |
| Volatile Fatty Acid Profiling | Individual VFA concentrations — acetate, propionate, butyrate, valerate, isovalerate | Indirect community function indicator | 1-2 hours (HPLC or GC) | Standard process control parameter — correlates with community stress but detects decline 1-2 days after sequencing methods |
How to Interpret Microbial Shifts and Take Corrective Action
Detecting a microbial community shift is only valuable if the operator knows what the shift means and how to respond. The diagnostic framework below maps common microbial community patterns to their likely root causes and recommended operational interventions. iFactory AI's platform correlates these microbial signals with real-time process data — temperature, pH, VFA concentration, gas composition, and organic loading rate — to provide operators with integrated diagnostic recommendations rather than isolated lab reports. Book a Demo to see the integrated diagnostic dashboard configured for your plant.
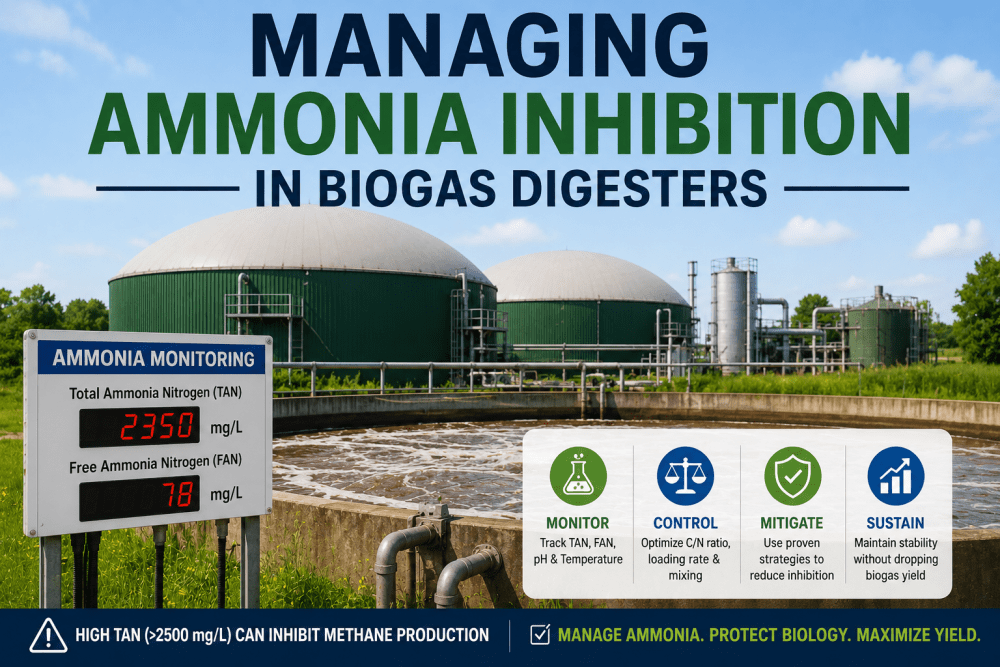
Drop in Methanosaeta or Methanosarcina abundance with stable or increasing VFAs. Indicates substrate-level inhibition — typically ammonia toxicity or free ammonia inhibition. Corrective action: reduce organic loading rate, adjust feedstock C:N ratio, or implement ammonia stripping if concentration exceeds 3000 mg/L total ammonia nitrogen.
Rising propionate concentration accompanied by declining Syntrophobacter and Smithella abundance. Indicates hydrogen partial pressure elevation due to hydrogenotrophic methanogen stress. Corrective action: reduce organic loading rate, increase mixing to improve hydrogen mass transfer, or supplement with hydrogenotrophic methanogen enrichment culture.
Decline in cellulolytic or proteolytic bacteria following a feedstock transition. Indicates that the existing microbial community lacks the enzymatic capacity to degrade the new substrate. Corrective action: implement gradual feedstock transition over 2-3 retention times, supplement with enzyme additives, or co-inoculate with digester sludge adapted to the new feedstock.
Simultaneous decline across multiple trophic groups with rapid VFA accumulation and methane yield drop. Indicates a systemic toxicity event — typically oxygen ingress, high sulfide concentration, or sudden pH excursion. Corrective action: identify and eliminate toxicity source, implement emergency feed reduction, and consider digester re-inoculation from a healthy parallel digester.
Methanogen abundance remains suppressed after corrective action was taken for an initial inhibition event. Indicates that recovery conditions — pH, VFA levels, ammonia concentration — have not returned to the tolerance range for acetoelastic or hydrogenotrophic methanogens. Corrective action: extend feed reduction period, adjust alkalinity supplementation, or evaluate temperature reduction to lower ammonia toxicity pressure.
Gradual but persistent shift in community composition over weeks to months as feedstock composition changes seasonally. Not a crisis event but a signal that population adaptation is occurring. Corrective action: adjust feedstock blending ratios to maintain community diversity, monitor for early warning signs of trophic imbalance, and use iFactory AI's predictive models to forecast yield impact of continuing drift.
iFactory AI's predictive analytics platform correlates microbial community data with real-time process parameters to deliver integrated diagnostic recommendations — Book a Demo to see the diagnostic framework configured for your plant's specific feedstock and digester configuration.
Industry Expert Perspective on Microbial Monitoring in Biogas Operations
"I have spent fifteen years managing biological processes across agricultural, municipal, and industrial biogas plants in North America and Europe. For the first ten of those years, we operated digesters using the same process control toolkit that was standard in the 1990s: weekly VFA and alkalinity titrations, daily biogas composition measurement, and periodic organic loading rate calculations. We knew that the biology was what ultimately determined plant performance, but we had no practical way to see what the biology was actually doing between those weekly lab results. The VFA and alkalinity indicators had been telling us about problems that had already occurred. The microbial data was telling us about problems that were going to occur — and giving us enough time to intervene with feed rate adjustments, trace element supplementation, or alkalinity dosing before the yield loss materialized. The operational value of having a seven-day early warning system for digester instability is difficult to overstate. We reduced unplanned yield loss events by approximately 60% in the first year of routine microbial monitoring deployment."
Conclusion — Making Microbial Monitoring a Standard Operating Practice
Microbial community monitoring is transitioning from a research tool to an operational standard in biogas plant management. The data is clear: routine 16S rRNA sequencing, qPCR targeting functional genes, and metabolic activity assays provide early warning of digester instability that conventional chemical monitoring cannot match.
The barrier to adoption is not the biology — it is the data infrastructure required to convert sequencing lab results into actionable operational recommendations in time to prevent yield decline. iFactory AI provides that infrastructure: predictive analytics that correlate microbial community data with real-time process parameters, digital twin simulation that models the impact of corrective interventions before they are implemented, automated CMMS workflows that document corrective actions for compliance reporting, and unified dashboards that give operators a single view of biological and chemical process status. Book a Demo to discuss how iFactory AI can deploy microbial community monitoring infrastructure across your biogas plant portfolio.
Deploy Microbial Community Monitoring Across Your Biogas Plant
iFactory AI connects sequencing lab results with real-time process analytics, digital twin simulation, and automated corrective action workflows — giving biogas operators a seven-day early warning system for digester instability.
Microbial Community Monitoring in Biogas Digesters — Frequently Asked Questions
How does microbial community monitoring improve biogas plant operations compared to traditional VFA analysis?
Microbial community monitoring provides early warning of digester instability seven to ten days before volatile fatty acid accumulation signals a problem through traditional chemical analysis. While VFA and alkalinity measurements indicate that a process imbalance has already occurred, microbial population tracking — particularly declines in acetoclastic methanogen abundance — reveals that the biological conditions for imbalance are developing. This early warning window gives operators time to implement corrective interventions — feed rate reduction, trace element supplementation, or alkalinity dosing — before methane yield drops. Plants deploying routine microbial monitoring report 50-60% fewer unplanned yield loss events compared to VFA-only monitoring strategies.
What sampling frequency is needed for effective microbial community monitoring in anaerobic digesters?
The optimal monitoring frequency depends on digester feedstock stability and historical process variability. For digesters processing consistent feedstocks with stable performance, weekly 16S rRNA amplicon sequencing combined with daily qPCR targeting methanogen functional genes provides sufficient temporal resolution to detect developing community shifts before they impact yield. For digesters processing variable feedstocks — food waste, agricultural residues, or industrial co-substrates — or digesters with a history of instability, two to three sequencing runs per week with daily qPCR monitoring is recommended. The iFactory AI platform supports variable-frequency sampling schedules and automatically adjusts baseline models and alert thresholds based on the actual sampling cadence.
What specific microbial population changes should operators watch for as early warning signs?
The single most important early warning indicator is declining abundance of acetoclastic methanogens — Methanosaeta in low-acetate environments and Methanosarcina in higher-acetate conditions. A sustained decline of more than 20% in acetoclastic methanogen relative abundance across two consecutive sampling events typically precedes a measurable yield drop by seven to ten days. A second critical indicator is the propionate-to-acetate ratio combined with declining Syntrophobacter abundance — signals that hydrogen partial pressure is rising and the syntrophic propionate oxidation pathway is under stress.
Does microbial monitoring work for all digester types and feedstock configurations?
Yes — microbial community monitoring is feedstock-agnostic and digester-configuration-agnostic because the core trophic groups — hydrolytic bacteria, acidogens, acetogens, and methanogens — are present in all anaerobic digestion systems. The specific genera and species vary by feedstock type, temperature regime, and operating conditions, but the functional relationships between trophic groups are conserved across all anaerobic digestion systems. iFactory AI's platform uses functional-gene-targeted analysis rather than taxonomy-only profiling, enabling cross-plant comparisons and centralized monitoring across different feedstock configurations within a multi-plant portfolio.
What is the ROI of deploying routine microbial monitoring at a biogas plant?
The ROI of routine microbial monitoring is driven by avoided yield loss events, reduced parasitic energy consumption during instability recovery, and extended digester asset life through reduced biological stress. A typical medium-scale biogas plant processing 50,000 tons of feedstock per year experiences two to four significant yield loss events annually under VFA-only monitoring, each lasting three to seven days and reducing methane production by 20-40%. At current renewable natural gas prices, each avoided yield loss event saves $15,000-$40,000 in lost gas revenue. The annual cost of routine microbial monitoring — weekly sequencing combined with daily qPCR — is typically $15,000-$25,000 per digester when managed through an integrated platform like iFactory AI. The payback period is under six months for most plants, driven by the first one to two avoided yield loss events. Book a Demo to model the specific ROI for your plant configuration and feedstock profile.
Deploy Microbial Community Monitoring with iFactory AI
Biogas plant operators across North America trust iFactory AI's integrated platform to connect sequencing lab results with real-time process analytics, digital twin simulation, and automated corrective action workflows.