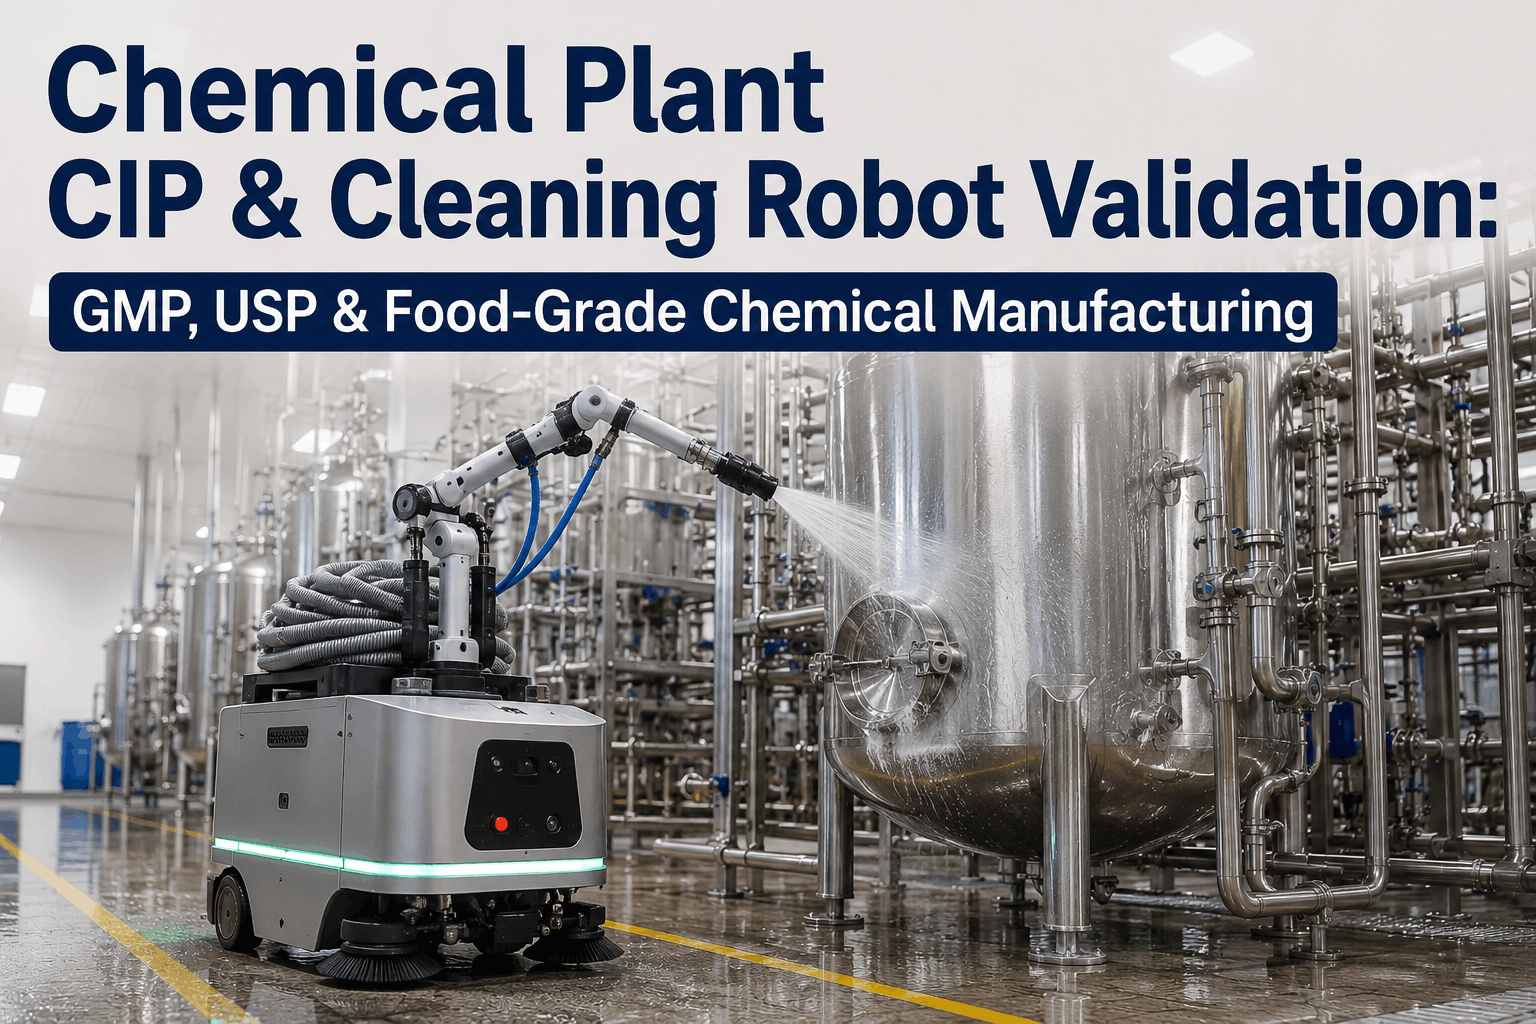
Chemical plants running multi-product manufacturing face a problem the pharmaceutical industry already solved a generation ago: every product changeover is a cross-contamination risk waiting to happen. The standard answer — Clean-in-Place (CIP) — works in theory, but in practice manual CIP cycles deviate from validated protocols at alarming rates. Studies of independently audited manual CIP execution show measurable deviations from validated parameters in a significant share of cycles, driven by shift handoffs, production pressure, and the impossibility of consistent timekeeping across operators. The 2026 inflection: CIP automation with robotic validation — sensor-instrumented spray balls, AI-monitored chemical concentration, TOC and conductivity verification, and full audit-trail documentation — eliminates manual variability, satisfies USP-grade and food-grade chemical requirements, and dramatically compresses multi-product changeover time. This guide breaks down chemical CIP validation under GMP-aligned frameworks, the IQ/OQ/PQ qualification path, residue acceptance criteria, and the automation architecture iFactory provides — delivered on-premise (air-gapped) and cloud (SOC 2 Type II) with identical capability. Book a CIP Validation & Automation Workshop to scope a compliant program for your facility.
IQ/OQ/PQ
Standard 3-phase qualification framework for CIP validation
<10 ppm
Typical residue acceptance limit for multi-product changeover
20–45 min
Automated CIP cycle vs 45–90 min manual cleaning
2 modes
iFactory deployment — on-premise + cloud, same validation rigor
Why Manual CIP Fails in Multi-Product Chemical Plants
Manual CIP cycles assume operator adherence to written procedures, accurate timekeeping, and consistent chemical dosing across every shift. In reality, none of these assumptions hold consistently. Three structural failure modes drive the majority of CIP-related contamination events. Read deeper context in our CIP validation analytics checklist.
M1
Shift Handoff Shortcuts
Operators under production pressure shave minutes from validated contact times. A documented case from a multi-product processing plant: 8 minutes shortened during a shift change dropped sanitization below 12-minute minimum, allowing biofilm survival.
CONSEQUENCE
72-hour shutdown, traceback through every downstream batch, recall risk
M2
Drifted Chemical Concentration
Conductivity sensors drift over weeks. Strainer blockage reduces flow. Caustic concentration falls below validated range — but the cycle still completes "successfully" on the operator log because no live verification exists.
CONSEQUENCE
Routine ATP swab triggers investigation reaching back to last verified clean
M3
Documentation Lag
Manual logbooks completed retroactively. Operators record completion times without verification. Validation studies don't reflect actual practice. Audit-day reconstruction depends on memory and paper trails.
CONSEQUENCE
FDA 483 observations for ALCOA "contemporaneous" violations; CAPA backlog
The pattern is consistent: manual CIP cycles complete "successfully" according to records — but independent audit reveals systematic deviation from validated protocols. Multi-product chemical plants pay the highest price because cross-contamination events affect downstream products from different campaigns.
CIP Validation Is Not About Writing Better Procedures. It's About Removing Human Variability.
Automated CIP with sensor-validated cycle parameters and immutable audit trails eliminates the gap between written protocol and actual execution.
The IQ/OQ/PQ Qualification Framework
GMP-aligned CIP validation follows the three-phase qualification framework adopted from pharmaceutical practice. Each phase has specific deliverables, acceptance criteria, and documentation requirements. Skipping or compressing any phase undermines the entire validation chain. Schedule a workshop to map IQ/OQ/PQ deliverables for your specific equipment.
PHASE 1
IQ — Installation Qualification
PURPOSE
Confirm the CIP system is installed correctly and matches design specifications.
DELIVERABLES
Equipment specs vs design verification
P&ID accuracy confirmation
Calibration certificates for all sensors
Material of construction verification
Spray ball coverage mapping
PHASE 2
OQ — Operational Qualification
PURPOSE
Demonstrate the CIP system operates within defined parameters across the full operating range.
DELIVERABLES
Riboflavin spray coverage test
Flow rate verification at min/max
Temperature ramp-up and hold
Chemical concentration cycling
Pressure verification at all spray points
PHASE 3
PQ — Performance Qualification
PURPOSE
Prove CIP consistently removes residues to acceptance criteria over 3+ consecutive runs.
DELIVERABLES
3 consecutive successful cleaning runs
Swab sampling at worst-case locations
TOC analysis below acceptance limit
Visual inspection acceptance
Final rinse water quality verification
Residue Acceptance Criteria — The Math Behind Multi-Product Limits
Acceptance criteria for residue limits are not arbitrary numbers. They derive from a science-based, risk-based calculation that depends on the next product's batch size, the toxicity of the previous product's active ingredient, and the safety factor applied by your QA program. Below are the three analytical methods and their typical detection ranges. Read more about iFactory's chemical quality control AI analytics approach.
A1
TOC (Total Organic Carbon)
Detection limit5–50 ppb
Typical limit<500 ppb organic carbon
Use caseBroad organic residue detection
Best forMultiple actives, screening tool
A2
Conductivity
Detection limit0.1 μS/cm
Typical limit<1.3 μS/cm final rinse
Use caseReal-time inline monitoring
Best forCaustic / acid rinse verification
A3
Compound-Specific (HPLC, GC)
Detection limit10–100 ppb (compound)
Typical limit<10 ppm of previous API
Use caseSpecific compound quantification
Best forHigh-potency chemical compounds
Multi-Product Changeover Time Is Where Plants Lose Margin. Automation Cuts It in Half.
Automated CIP completes in 20-45 minutes vs 45-90 minutes manual — and with documented validation evidence on every cycle.
The Automated CIP Cycle — 6-Phase Architecture
A properly validated automated CIP cycle runs through six distinct phases. Each phase has its own validated parameters (time, temperature, chemical concentration, flow rate) and verification checkpoints. The robot/sensor architecture monitors all six in real time and aborts the cycle if any parameter drifts out of range.
01
Pre-Rinse
Cold/ambient water rinse to remove gross product residue before chemistry contact
2–5 min
Ambient temp
→
02
Caustic Wash
Hot caustic solution (typically NaOH) removes organic residue, fats, proteins
10–20 min
70–85°C
1–2% NaOH
→
03
Intermediate Rinse
Water rinse to remove caustic chemistry before acid phase
3–5 min
Ambient
→
04
Acid Wash
Nitric or phosphoric acid removes mineral deposits, scale, and rust
10–15 min
55–70°C
0.5–1% HNO₃
→
05
Sanitize
Hot water or sanitizer kills any remaining microbial load
5–10 min
85–95°C
→
06
Final Rinse
Purified water rinse with conductivity verification proving chemistry removal
3–5 min
<1.3 μS/cm
Validation evidence captured on every cycle: Phase start/end timestamps, temperature traces, chemical concentration trends, flow rate at each spray point, pressure verification, and final rinse conductivity. Every parameter time-stamped, geo-tagged to specific equipment, and stored immutably for audit.
iFactory Deployment Models — On-Premise & Cloud, Identical Validation Rigor
CIP validation data has high regulatory sensitivity — every cycle parameter, every deviation, every CAPA record is potential FDA inspection evidence. iFactory delivers two deployment models — on-premise (air-gapped, plant-local) and cloud (SOC 2 Type II, multi-site managed) — with identical validation rigor across both. The choice depends on your IT governance, not on capability.
DEPLOYMENT MODEL A
On-Premise
Air-Gapped Plant-Local
ARCHITECTURE
Edge appliance on plant network. CIP cycle data, AI inference, and audit trail storage all within your firewall. Zero internet connectivity required.
BEST FIT FOR
Pharma-adjacent chemical plants, GMP-regulated facilities, plants under data sovereignty rules, sites preferring CapEx model.
KEY ADVANTAGES
Full data sovereignty — nothing leaves plant
Sub-50ms cycle abort latency on parameter drift
Offline-capable during WAN outages
Direct integration with on-prem LIMS/MES
DEPLOYMENT MODEL B
Cloud
SOC 2 Type II Managed Service
ARCHITECTURE
CIP cycle data flows to SOC 2 Type II / ISO 27001 certified cloud. Multi-site dashboards across plant fleet. Continuous AI model improvements.
BEST FIT FOR
Multi-plant operators, contract manufacturers running diverse product portfolios, sites preferring OPEX model with rapid scaling.
KEY ADVANTAGES
Multi-site centralized validation dashboard
Cross-plant CIP performance benchmarking
Rapid onboarding for new equipment
Zero infrastructure overhead
Same validation rigor across both modes. 21 CFR Part 11 electronic signatures, ALCOA++ data integrity, immutable audit trails, IQ/OQ/PQ documentation — identical across on-premise and cloud. The choice depends on your data governance posture, not on regulatory capability.
FAQ: Chemical Plant CIP Validation & Automation
Common questions from QA managers, process engineers, and validation leads evaluating CIP automation for multi-product chemical manufacturing. Question not covered? Reach our solutions team directly, or book a CIP Workshop.
How do CIP requirements differ between USP-grade chemical and food-grade chemical manufacturing?
USP-grade chemical manufacturing typically applies pharmaceutical CIP standards — tighter residue acceptance limits (often <10 ppm or below PDE-derived limits), full IQ/OQ/PQ qualification, electronic batch records, and compound-specific analytical methods (HPLC, GC). Food-grade chemical manufacturing aligns with FDA 21 CFR Part 117 (Preventive Controls) and 3-A standards — broader residue limits acceptable, conductivity and TOC are typically sufficient. iFactory supports both regulatory frameworks with the same automation platform; the difference is in qualification documentation rigor and analytical method specification.
What's the typical residue acceptance limit for multi-product changeover?
Limits are calculated using a risk-based approach: Acceptance Limit = (Therapeutic Dose × Safety Factor) ÷ (Daily Dose of Next Product × Shared Surface Area). Safety factors typically range from 1/1000 (low-risk products) to 1/10000 (high-potency compounds). The PDE (Permitted Daily Exposure) approach is increasingly required by EMA and FDA for cross-contamination assessment. Typical absolute limits land between <10 ppm and <100 ppb for compound-specific testing. Final rinse conductivity is typically <1.3 μS/cm. TOC limits typically <500 ppb organic carbon.
What happens to existing IQ/OQ/PQ documentation if we add automated monitoring?
Adding automated monitoring is a Change Control event under your QMS, not a re-validation from scratch. Existing IQ remains valid for the underlying CIP equipment. OQ requires partial re-execution to qualify the new sensor instrumentation and AI inference layer. PQ runs 3 consecutive cleaning cycles with automated monitoring to demonstrate equivalence (or improvement) over manual practice. Typical total qualification timeline: 4–6 weeks for partial re-qualification vs 12+ weeks for full new-system validation. iFactory provides qualification protocol templates as part of deployment scope.
Does iFactory offer both on-premise and cloud CIP automation?
Yes — both deployment models with identical validation rigor. On-premise runs the full sensor pipeline, AI inference, and audit trail storage on edge infrastructure within your firewall, fully air-gapped. Cloud delivers managed multi-site dashboards with SOC 2 Type II and ISO 27001 certification. Both modes satisfy 21 CFR Part 11, EU GMP Annex 11, and ALCOA++ identically. Pharma-adjacent and regulated chemical plants typically choose on-premise; contract manufacturers and multi-plant operators typically choose cloud. The choice depends on data residency rules and IT policy.
How do we validate spray coverage in tanks and vessels?
The standard method is riboflavin coverage testing — a fluorescent compound is applied to all internal surfaces, CIP cycle is run, and UV inspection confirms full removal indicating complete spray contact. This is part of OQ qualification. Automated systems add continuous spray ball rotation monitoring, flow rate verification at each spray point, and differential pressure tracking that catches blockages or coverage failures in real time during routine production cycles — not just at qualification milestones. Shadow zones from blocked spray balls are the leading cause of CIP contamination events; sensor monitoring catches them immediately.
Can CIP automation handle solvent cleaning, not just aqueous?
Yes — but with specific design considerations. Solvent CIP (used for oil-soluble residues, hydrocarbon-based products, certain APIs) requires ATEX-rated sensor instrumentation, intrinsically safe wiring, and explosion-proof enclosure for any electronics in contact with solvent vapor zones. The chemistry phases differ — typically a solvent flush, intermediate purge, aqueous rinse, and final drying. iFactory's CIP automation platform supports both aqueous and solvent CIP cycles; specifications differ by application and zone classification.
What's the typical changeover time reduction from CIP automation?
Typical reductions are 40–60% changeover time compared to manual CIP — manual cycles run 45–90 minutes including documentation, while automated cycles complete in 20–45 minutes with documentation generated automatically. For multi-product plants running 3+ product changeovers daily, this typically recovers 90–180 minutes of production time per shift. Annual value from changeover time recovery typically ranges from $400K–$1.5M per line depending on production rate and product margin. Chemical waste reduction adds another typical value stream of $50K–$200K per line annually.
How quickly can we book a CIP Validation & Automation Workshop?
Workshops are typically scheduled within 5–7 business days of request. The session is a
90-minute working call with your QA, validation, process engineering, and IT teams — we map your specific equipment, current CIP cycle definitions, IQ/OQ/PQ documentation status, and multi-product changeover pain points to a tailored automation plan. Output includes sensor specification, qualification timeline, deployment model recommendation (on-prem vs cloud), and ROI projection.
Book your workshop now.
Compress Changeovers. Pass Every CIP Audit. On-Premise or Cloud.
Manual CIP cycles in multi-product chemical plants deviate from validated parameters at rates that put cross-contamination compliance at constant risk. iFactory's CIP automation platform delivers sensor-validated cycle execution, immutable audit trails, and 21 CFR Part 11 + EU GMP Annex 11 compliance — across on-premise and cloud deployments with identical validation rigor.
On-premise OR cloud — same validation
40–60% changeover time reduction
IQ/OQ/PQ qualification framework
USP, food-grade, GMP-aligned
$400K–$1.5M annual value per line

.png)