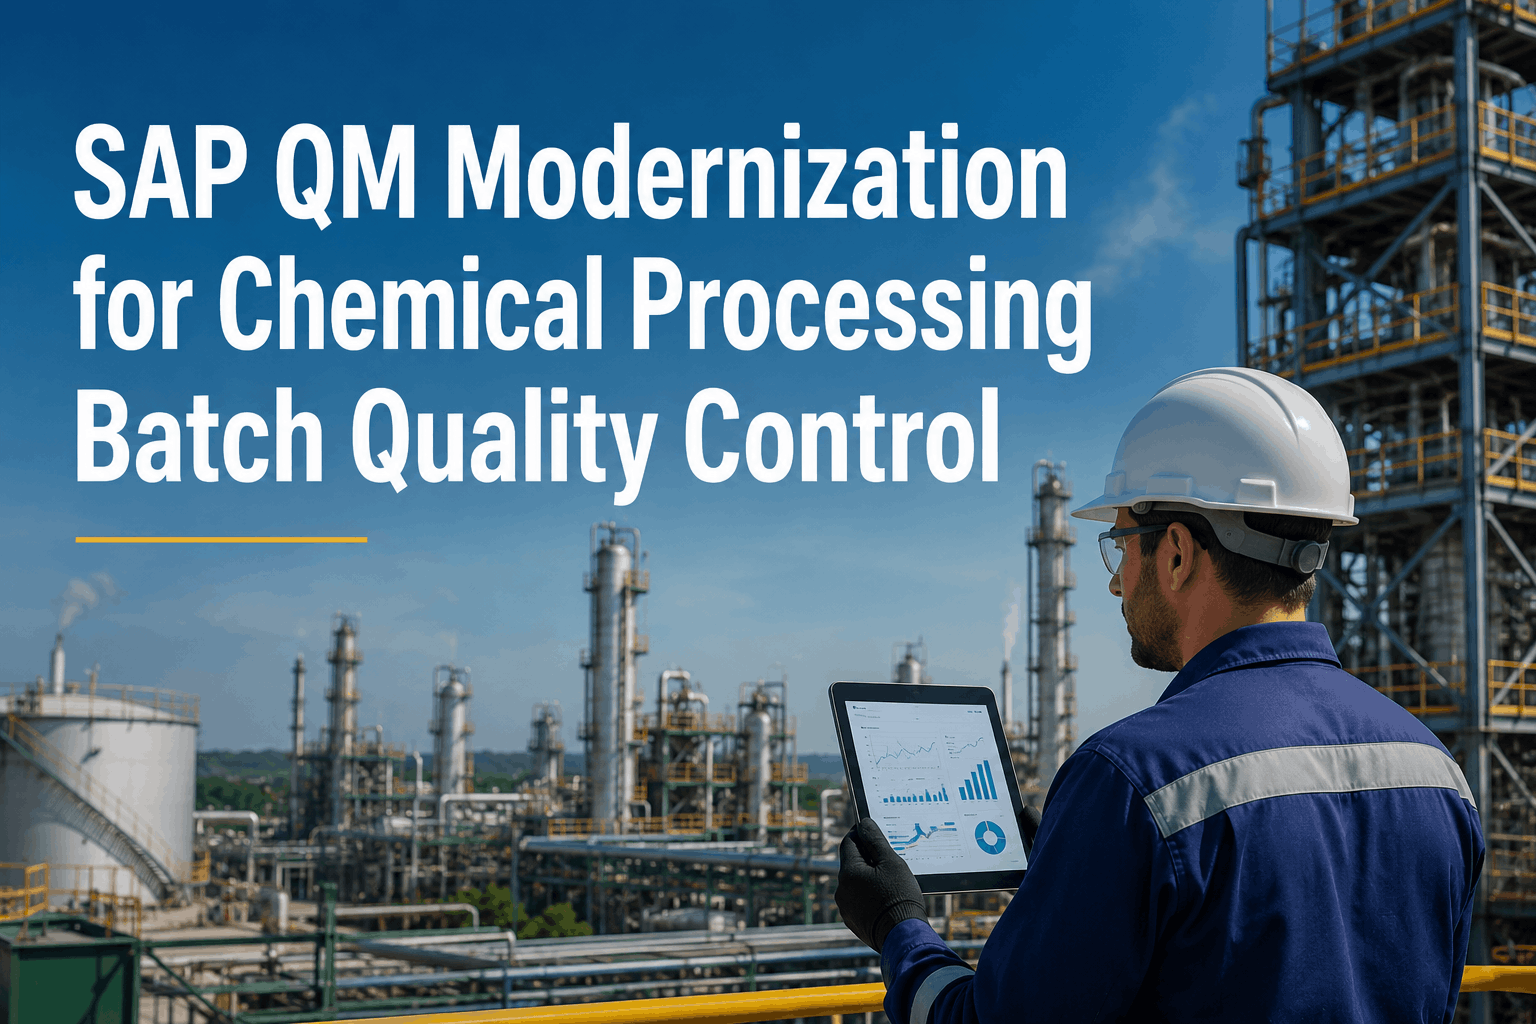
Chemical processing plants running batch quality control on legacy SAP QM and SAP xMII architectures face a quiet crisis — a recent industry survey found that 78% of manufacturers report legacy MES and quality systems are now actively blocking digital transformation, while 65% are actively seeking modernization paths that preserve their SAP investment. The reason is structural, not stylistic: traditional univariate SPC charts and post-batch laboratory verification cannot keep pace with modern multi-variable, time-varying batch chemistry. By the time a Shewhart chart flags a violation, the off-spec material is already in the tank. iFactory's AI-native SPC migration replaces reactive threshold monitoring with predictive, multivariate batch intelligence — fully integrated with your existing SAP QM, SAP xMII, and DCS environment, with no rip-and-replace and live in 8 weeks. Book an AI SPC Migration Workshop to map your modernization path.
78%
Manufacturers say legacy SAP xMII blocks digital transformation
4 hrs
Discovery-to-containment with AI SPC vs. 1 week legacy SPC
94%
Deviation catch rate vs. 51% legacy univariate SPC
8 wks
SAP QM and xMII modernization to AI-native SPC go-live
Why Legacy SPC Is Failing Chemical Batch Quality Control
Walter Shewhart published the first control chart in 1931. Ninety-five years later, the math hasn't changed — but chemical batch chemistry has. Modern reactors generate hundreds of correlated time-series variables across charge, reaction, mixing, and discharge phases. Univariate SPC charts inside SAP QM were never designed for this kind of multivariate, non-stationary, autocorrelated process data. The result: plants running Cpk 0.9 generate 2,700 defects per million units even when 97.3% of batches still pass inspection. The defects are invisible until lab confirmation — at which point the cost is already locked in.
01
Univariate Blind Spots
Legacy SAP QM SPC monitors one variable at a time. Batch reactors have 40–200 interacting parameters per recipe phase. Multivariate interactions that cause 60% of off-spec batches never appear on any single chart.
02
Reactive, Not Predictive
Shewhart, CUSUM, and EWMA charts only fire alerts after a process shift has already occurred. By the time an out-of-control signal appears, several minutes to hours of off-spec material is in the reactor.
03
Static Control Limits
Legacy SPC limits are fixed at recipe-validation time. Real batches drift with raw material lots, ambient conditions, and catalyst aging — but the limits never adapt. Alarms fire on healthy batches; real drifts slip through.
04
Lab-Latency Quality Loop
SAP QM's standard inspection-lot model creates a 4–48 hour gap between production and quality verification. Rework cost per off-spec batch in chemical processing now averages $18,000–$52,000.
05
Alarm Fatigue
Legacy SPC threshold logic generates 50–80 false-positive alarms weekly per plant. Operators learn to ignore them within weeks — the catch rate of actual deviations collapses to 51% in production.
06
Disconnected from Shop Floor
SAP xMII bridges ECC to plant systems but lacks real-time analytics depth. Discovery-to-containment time for batch deviations stays at 1 week — not the minutes modern Industry 4.0 plants require.
Your SAP QM Investment Doesn't Have to Be Replaced. It Has to Be Modernized.
iFactory's AI-native SPC layer connects natively to SAP QM and SAP xMII via OPC-UA and REST — preserving every inspection lot, characteristic, and master data record while adding multivariate AI intelligence on top.
What AI-Native SPC Actually Does Differently
The shift from legacy SPC to AI-native SPC is not a software upgrade — it is a change in what "control" means for a chemical batch. Traditional control charts ask: "Is this measurement outside the limit?" AI-native SPC asks: "Where is this entire multivariate batch trajectory heading, and what is the probability of an off-spec endpoint two hours from now?" The first question reacts. The second prevents.
1
Sample one variable at fixed intervals
↓
2
Plot against static control limit
↓
3
Wait for threshold breach
↓
4
Lab confirms after 4–48 hours
↓
5
Off-spec batch already produced
VS
1
Stream 40–200 variables continuously
↓
2
Multiway PCA + LSTM trajectory model
↓
3
Forecast endpoint 1–8 hours ahead
↓
4
Graded alert: Safe / Warning / Critical
↓
5
Adjust parameters mid-batch, prevent off-spec
The iFactory Modernization Architecture: Preserve SAP, Add AI
The most common objection chemical plants raise to SPC modernization is "we cannot rip out SAP QM." iFactory's architecture is designed around exactly that constraint. SAP QM remains the system of record for inspection lots, characteristics, master data, and regulatory documentation. SAP xMII remains the integration bus between ECC and the plant. iFactory plugs in as an AI analytics and predictive SPC layer — reading process and quality data, writing back enriched insights, and replacing only the reactive control-chart logic that was never fit for modern batch chemistry. Talk to our SAP integration specialists about your specific QM and xMII configuration.
ENTERPRISE LAYER
SAP S/4HANA
SAP QM
SAP PP
SAP MM
Preserved — system of record for inspection lots, master data, compliance
iFACTORY AI-NATIVE SPC LAYER
Multivariate Batch Models
LSTM Endpoint Forecasting
Graded Alert Engine
Compliance Auto-Reporting
New — replaces univariate SPC chart logic with predictive AI intelligence
PLANT FLOOR LAYER
SAP xMII
DCS (Honeywell, Yokogawa, ABB)
Batch Mgmt (DeltaV)
LIMS (STARLIMS)
Preserved — xMII remains as integration bus; DCS and LIMS untouched
Capability Comparison: Legacy SAP QM SPC vs. iFactory AI-Native SPC
Side-by-side, the gap is not subtle. The shift is from reactive single-variable charts to predictive multivariate intelligence — without losing any of the SAP QM compliance and master-data capabilities that audit teams depend on.
| Capability |
Legacy SAP QM + xMII SPC |
iFactory AI-Native SPC |
| Variable Coverage |
Univariate — one critical-to-quality parameter per chart, manual chart-by-chart review |
Multivariate fusion of 40–200 process tags per batch, single batch health score per reactor |
| Detection Mode |
Reactive — fires alarm after threshold breach has already occurred |
Predictive — forecasts endpoint deviation 1–8 hours ahead with LSTM trajectory models |
| Control Limits |
Static — set at recipe validation, never adapt to lot, ambient, or aging variation |
Adaptive — multiway PCA reference distributions recalibrate per batch family automatically |
| Alarm Quality |
50–80 false positives per week; operator catch rate drops to ~51% from alarm fatigue |
Under 6% false positive rate; graded Safe / Warning / Critical alerts; 94% catch rate |
| Quality Loop Time |
4 hours to 1 week from production to lab-confirmed quality verdict |
4 hours discovery-to-containment, with mid-batch parameter adjustment recommendations |
| SAP Integration |
Native — but limited to what QM master data structures can express |
Bi-directional — reads from QM/xMII, writes enriched inspection results back to QM |
| Compliance Output |
Inspection lots and usage decisions; manual batch report assembly |
Auto-generated batch reports for FDA 21 CFR Part 11, EU GMP Annex 11, ICH Q7, REACH |
| Migration Path |
N/A — current state |
8-week phased deployment, SAP QM preserved, no rip-and-replace |
The 8-Week SAP QM & xMII to AI-Native SPC Migration Path
iFactory's migration methodology is built around a single principle: the chemical plant must keep producing throughout. There is no offline cutover, no weekend go-live, no SAP QM downtime. The AI layer is built in shadow mode, validated against historical batches, then promoted to live alerting in measured stages.
Quality System Audit & Tag Inventory
Map every SAP QM inspection characteristic, every xMII transaction, and every DCS tag feeding your batch quality decisions. Identify multivariate dependencies traditional SPC has been blind to.
SAP QM & xMII Connection Layer
Establish bi-directional OData/REST connectivity to SAP QM and OPC-UA bridge to xMII. No SAP customizations required. No production interruption.
Multivariate Model Baseline
Train multiway PCA and LSTM models on 60–90 days of your historical batches and QM inspection lots. Shadow-validate predictions against known good and known off-spec batches.
Pilot on Highest-Variability Batches
Activate live AI-SPC monitoring on 3–5 batch processes with the highest historical off-spec rate. Legacy SAP QM SPC continues to run in parallel for confidence baseline.
Alert Calibration & Operator Training
Tune graded alert thresholds based on pilot precision and recall data. Train batch operators on the new Safe / Warning / Critical workflow inside the iFactory console.
Plant-Wide Rollout
Expand AI-SPC coverage to the full batch fleet. SAP QM inspection lots now receive enriched, AI-predicted quality data automatically.
Go-Live & ROI Baseline
Full 24/7 AI-native SPC live across the plant. Compliance reporting activated. First batch consistency report delivered with measured improvement vs. legacy baseline.
MEASURED OUTCOMES BY WEEK 8
Chemical plants completing the 8-week migration consistently report measurable batch consistency improvement and dramatic reduction in rework cost — without any SAP QM downtime or customization rework.
79%
Reduction in off-spec batches vs. legacy SPC
$2.9M
Avg. annual batch consistency value preserved
88%
Cut in weekly false-positive alarm volume
Keep Your SAP. Modernize Your SPC. See Results in Week 4.
The migration workshop is a 90-minute working session with your quality, process, and SAP teams — we map your specific QM and xMII configuration and deliver a tailored migration plan with timeline and ROI projection.
Real Outcomes from Chemical Plant Modernization Deployments
These results are from operating chemical processing facilities that completed the SAP QM and xMII modernization to iFactory AI-native SPC. Six-month post-deployment data, measured against pre-migration baselines.
An 8-reactor specialty polymer plant running SAP QM with univariate SPC charts was missing molecular weight drift caused by upstream monomer composition variability. Lab confirmation came 6–8 hours after batch completion — too late for any economical correction. iFactory's multiway PCA model fused monomer, catalyst, and thermal profile signals into a single batch health trajectory, detecting 8 pre-threshold drift events in the first 6 weeks of live monitoring.
26%
Batch-to-batch consistency improvement
$2.6M
Annual rework cost eliminated
96%
Early-stage drift detection accuracy
A fine chemical manufacturer operating 12 esterification batches inside SAP xMII was firing 50–80 SPC threshold alarms weekly. Operators had quietly stopped responding — the actual deviation catch rate had collapsed to 51%. iFactory replaced threshold logic with graded multivariate alerts. Within 6 weeks, weekly actionable alerts dropped to under 6, batch cycle time fell by 3.2 hours, and operator trust in the alerting system was rebuilt.
94%
Catch rate, up from 51% legacy SPC
3.2 hrs
Batch cycle time reduction
88%
False-positive alarm reduction
A biotech chemical facility was losing $540K annually to 4–6 small but persistent fermentation inefficiencies rotating across a 10-batch train. Manual endpoint determination identified suboptimal conversion only after visible purity deviation — 2–3 batches into the loss. iFactory's temperature and nutrient correlation models identified all 5 active inefficiency patterns within 48 hours of go-live, enabling targeted parameter adjustment without production interruption.
$540K
Annual yield loss eliminated
48 hrs
Time to identify all 5 patterns from go-live
$1.1M
Annual value from proactive optimization
What Plant Operations Teams Say After Modernization
We kept every SAP QM master record, every inspection lot definition, every characteristic. iFactory just added the predictive layer we always knew SPC was missing. The migration was the smoothest SAP-adjacent project we have ever run.
Director of Quality Systems
Specialty Polymer Plant, Switzerland
Our operators had stopped trusting the alarms. Within six weeks of the AI layer going live, they were acting on every alert again — because the prioritization was actually credible. That cultural shift alone justified the project.
VP of Manufacturing Excellence
Fine Chemical Plant, USA
SAP xMII connection took 10 days, including production sign-off. Past vendor projects of this scope took us 6 to 9 months. The iFactory team understood both batch chemistry and SAP integration — that combination is genuinely rare.
Head of Process Optimization
Biotech Chemical Manufacturing, Japan
The AI flagged a feed-composition drift 6 hours before our legacy SPC would have caught it. We adjusted during a planned window instead of running an emergency batch abort. That single event paid for the deployment.
Plant Batch Manager
Chemical Manufacturing Facility, Canada
Frequently Asked Questions
Does the migration require us to replace SAP QM or SAP xMII?
No. iFactory's AI-native SPC layer is designed to sit alongside SAP QM and SAP xMII, not replace them. SAP QM remains the system of record for inspection lots, characteristics, master data, and compliance documentation. SAP xMII continues to operate as the integration bus to your DCS and batch systems. iFactory connects via standard SAP interfaces (OData, REST, RFC) and writes enriched, AI-predicted quality data back into SAP QM inspection lots automatically.
How does AI-native SPC differ mathematically from traditional SPC charts?
Traditional SPC (Shewhart, CUSUM, EWMA) is univariate and reactive — it monitors one variable against fixed limits and alerts only after a breach occurs. AI-native SPC uses multiway PCA and PLS to fuse 40–200 correlated process variables into a single batch trajectory, then applies LSTM time-series forecasting to predict the endpoint quality before the batch is complete. The mathematical foundation is multivariate statistical process control extended with deep learning forecasting — a well-published approach in chemical engineering literature, now operationalized for production deployment.
Will this break our existing FDA 21 CFR Part 11 and EU GMP Annex 11 compliance posture?
No — it strengthens it. iFactory auto-generates structured batch reports formatted for FDA 21 CFR Part 11, EU GMP Annex 11, ICH Q7, REACH, and OSHA PSM. All SAP QM inspection lot records remain intact and audit-traceable. The AI layer adds enriched quality data with full provenance — every prediction is linked to the source process tags, the model version, and the confidence score, satisfying ALCOA+ data integrity requirements.
How much historical batch data do we need for the AI model to be reliable?
Typically 60–90 days of plant operating history, including SAP QM inspection lot results, DCS process tag data, and LIMS analytical results. Model baseline training completes in 5–7 days. First live detections are validated during the Week 3–4 pilot phase. Full model calibration with false positive rate under 6% is reached within 6 weeks for standard chemical batch environments.
Which batch chemistries does iFactory support?
iFactory's models are pre-trained on 9 batch types: polymerization, esterification, hydrogenation, oxidation, nitration, halogenation, fermentation, crystallization, and distillation. Plant-specific fine-tuning during Week 3–4 of the migration adapts these to your specific recipes, phases, and quality correlations. Multi-chemistry plants are fully supported within a single deployment.
What happens to our existing SAP QM inspection plans and characteristics?
They stay exactly as they are. The migration is additive, not destructive. Every inspection plan, characteristic, sampling procedure, and usage decision configured in SAP QM continues to function unchanged. iFactory enriches the inspection lots with multivariate AI predictions and confidence scores — your QA team still uses SAP QM as their working interface, but with predictive intelligence layered in.
Stop Running 1931 Math on 2026 Batch Chemistry. Modernize Your SPC in 8 Weeks.
iFactory's AI-native SPC migration preserves your SAP QM and SAP xMII investment, eliminates the false-positive alarm storm, and gives your plant operators predictive batch intelligence they can actually act on — fully live in 8 weeks, with ROI evidence by week 4.
No SAP rip-and-replace — additive modernization
94% deviation catch rate vs. 51% legacy SPC
Under 6% false positive rate, graded alerts
FDA 21 CFR Part 11, EU GMP Annex 11, REACH ready