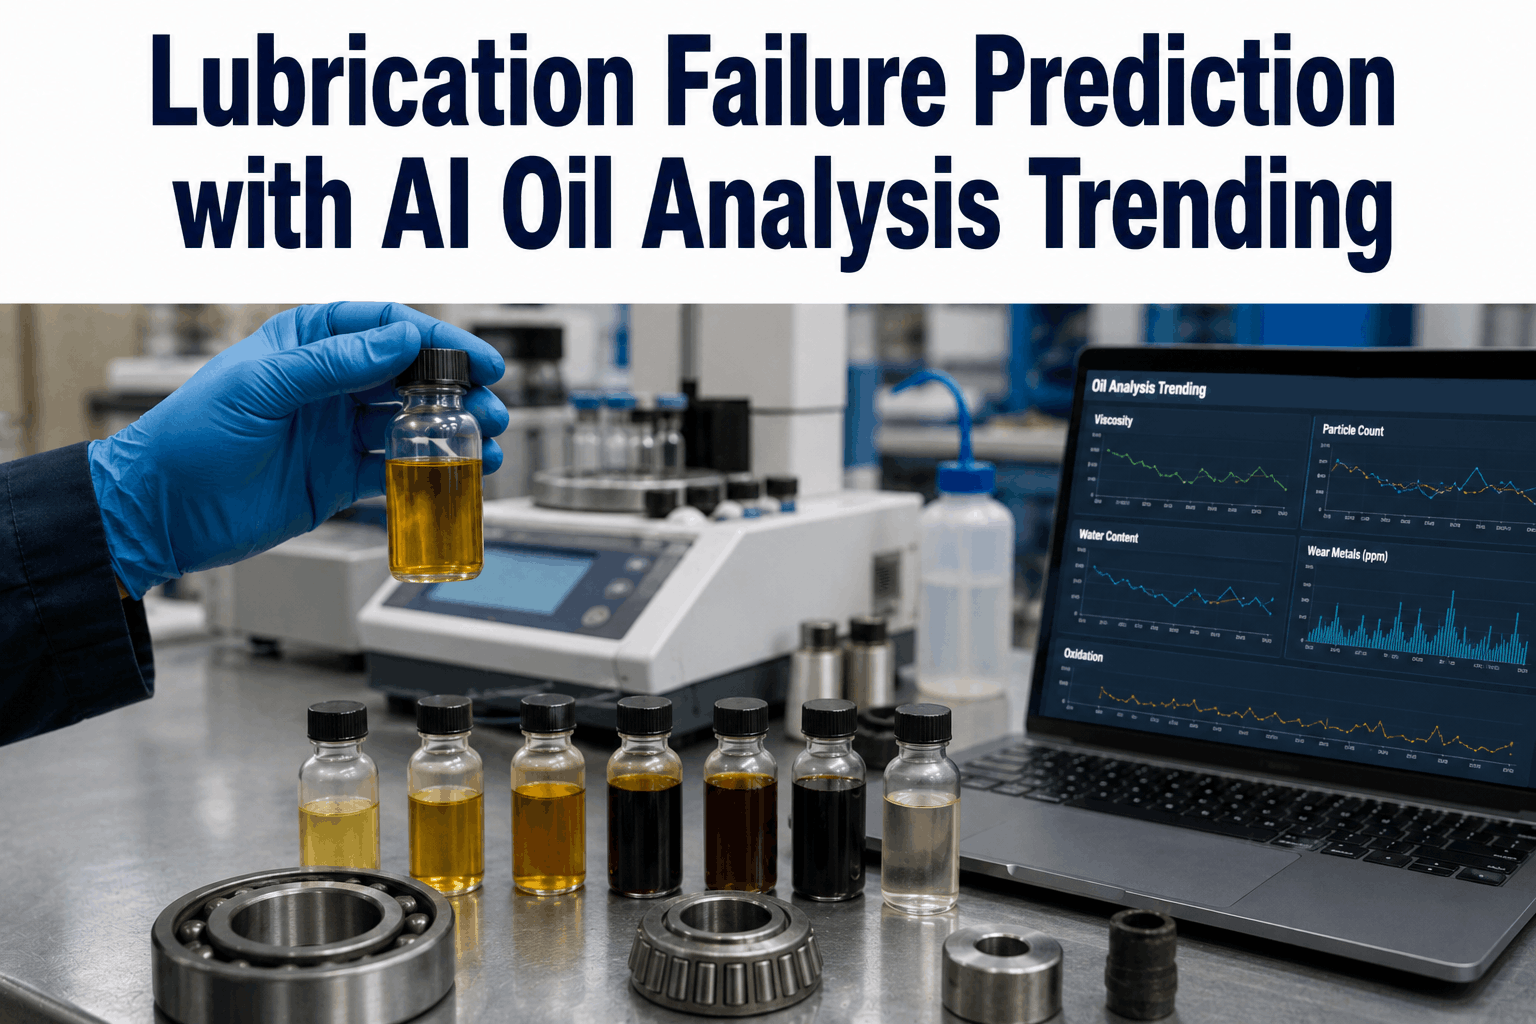
A bearing that fails from lubricant degradation did not fail suddenly — it failed over weeks or months as viscosity dropped, particle count climbed, water contamination crossed a threshold, and elemental analysis revealed copper and iron wear debris accumulating in the oil sample. Every one of these signals was present and measurable long before the bearing seized. AI oil analysis trending connects those signals across time, learning the normal degradation trajectory for each lubricated system and flagging the point where the trend deviates from expected behaviour before the lubricant reaches functional failure. The result is a predictive signal with weeks of lead time rather than an alarm at the moment of failure. Talk to an Expert to see how iFactory deploys AI oil analysis trending across your rotating equipment fleet.
Of mechanical failures in lubricated systems are preceded by detectable oil analysis signals that appear 2–6 weeks before functional failure — signals that manual threshold-based monitoring routinely misses
Average lead time between AI-detected lubrication anomaly and functional failure — sufficient for planned replacement rather than emergency repair in most lubricated system types
Reduction in unplanned lubricated equipment failures reported by facilities deploying AI oil analysis trending across their full rotating equipment population
Reduction in lubricant consumption through oil change interval optimisation — extending drain intervals on oil performing above specification and compressing intervals on oil degrading faster than expected
Predict Lubrication Failure Weeks Before It Becomes a Mechanical Event
iFactory's AI oil analysis platform trends viscosity, particle count, water contamination, and elemental wear data across time to identify degradation trajectories that manual threshold monitoring cannot detect — giving maintenance teams weeks of lead time rather than a failure alarm.
Why Threshold-Based Oil Analysis Misses the Failures That Matter Most
Standard oil analysis programmes compare each sample result against a fixed threshold — viscosity below X, particle count above Y, water content above Z — and flag the sample if any value exceeds the limit. This approach has two structural weaknesses that cause it to miss the majority of developing lubrication failures. First, a single sample that stays just below every threshold can still represent a severely degraded lubricant if every parameter has been trending steadily upward for six consecutive samples. The trend carries the predictive signal. The point-in-time comparison to a static threshold does not. Second, fixed thresholds are generic — they cannot account for the fact that a specific gearbox running in a high-temperature environment has a different normal viscosity range than the same gearbox model running in a cooler installation. AI trending learns each asset's individual baseline and flags deviations from that asset's specific normal trajectory rather than from a population-generic threshold. Teams that Book a Demo with iFactory see how this individual-asset baseline approach catches developing failures that threshold monitoring consistently passes as normal until the sample before failure.
Viscosity Degradation Trending
AI models track kinematic viscosity over time per asset, detecting gradual thinning from thermal degradation, oxidation, or contamination before the lubricant loses its film strength.
Particle Count and Size Distribution Analysis
Particle count trends by size class identify the transition from normal running wear to accelerated component degradation weeks before dimensional loss becomes detectable.
Water Contamination Trend Monitoring
Water ingress trends are tracked per asset with rate-of-increase modelling, distinguishing transient moisture events from systematic seal failures requiring immediate intervention.
Elemental Wear Debris Analysis
Iron, copper, chromium, aluminium, and other wear element trends identify which component is generating wear debris, enabling component-specific failure prediction rather than system-level alarms.
Oil Change Interval Optimisation
Drain intervals are extended for oil performing above specification and compressed for oil degrading faster than expected, reducing lubricant consumption without accepting increased wear risk.
ASTM-Aligned Analysis and Reporting
Analysis methods and reporting formats align with ASTM D4378, D6595, and D7418 oil analysis standards, producing documentation compatible with OEM and insurance audits.
Six AI Oil Analysis Capabilities That Predict Lubrication Failure
01
Individual Asset Baseline Learning and Deviation Detection
Core Predictive Capability
The foundational capability that separates AI oil analysis from threshold-based programmes is the learning of an individual baseline for each lubricated asset from its historical sample series. A specific gearbox in a hot environment might operate normally at a viscosity 15 percent below the OEM specification range — because the operating temperature is elevating baseline viscosity measurements. An AI model that has learned this asset's normal range flags a significant drop from its individual baseline, while a threshold-based system seeing a value within the OEM range does nothing. This per-asset baseline is calculated from the first 6 to 12 samples in the AI system and updated continuously as each new sample is ingested, adapting to seasonal variation, load changes, and equipment aging without requiring manual reconfiguration.
Threshold detection lead time: 0–1 week
AI trend detection lead time: 4–8 weeks
02
Multi-Parameter Correlation for Failure Mode Classification
Diagnostic Depth
No single oil analysis parameter predicts failure mode on its own — the failure signature is a pattern across multiple parameters simultaneously. A bearing developing a fatigue spall shows a specific pattern: iron particle count rising in the 15 to 25 micron range, ferrous debris concentration increasing, viscosity stable, and no change in water content. A gear tooth failure from micropitting shows a different pattern: iron concentration rising in the sub-5 micron range, viscosity dropping, and additive depletion accelerating. AI correlation models identify these multi-parameter patterns from historical confirmed failure cases and apply them to current trending data, classifying not just that a failure is developing but which component is failing and by what mechanism.
Single-parameter accuracy: 54%
Multi-parameter AI accuracy: 87%
03
Remaining Useful Life Estimation for Lubricant and Component
Prognostic Output
Beyond detecting that degradation is occurring, AI oil analysis models estimate two distinct remaining useful life figures: the remaining service life of the lubricant itself (how many more operating hours before the oil reaches functional failure) and the estimated remaining service life of the component generating the wear signal (how many more operating hours before the bearing or gear reaches functional failure). The lubricant RUL drives the oil change schedule. The component RUL drives the maintenance planning window. Both figures are updated with each new sample, narrowing the confidence interval as the failure approaches and giving maintenance planners increasingly precise scheduling targets as the intervention window approaches.
RUL estimate error (early): ±30%
RUL estimate error (late-stage): ±8%
04
Contamination Source Identification From Elemental Signature
Root Cause Diagnosis
Water contamination, coolant ingress, fuel dilution, cross-contamination with incompatible lubricants, and process fluid leakage each leave distinct elemental signatures in oil analysis results. AI elemental pattern matching identifies the probable contamination source from the combination of elevated elements — sodium and boron suggesting coolant ingress, silicon suggesting airborne dust ingress through a failed seal, glycol markers suggesting coolant bypass — so the maintenance team knows not just that contamination is present but where it is coming from before they open the system. This source identification prevents the common situation where contamination is detected, the oil is changed, and the same contamination reappears in the next sample because the ingress path was never addressed.
Contamination re-occurrence: 61% (no source ID)
Contamination re-occurrence: 14% (AI source ID)
05
Fleet-Wide Lubrication Performance Benchmarking
Portfolio Intelligence
When AI oil analysis is deployed across a fleet of similar assets — multiple identical gearboxes, a bank of similar compressors, a fleet of equivalent pumps — the degradation rates of individual units can be compared against the fleet average to identify outliers that are degrading faster than expected under similar operating conditions. An asset that is consuming its lubricant three times faster than comparable units is either operating under different conditions or has a developing mechanical problem that is accelerating lubricant degradation. Fleet benchmarking identifies these outliers automatically and flags them for investigation before the anomalous degradation rate produces a failure event.
Outlier detection rate (manual): 22%
Outlier detection rate (AI fleet): 91%
06
Condition-Based Oil Change Interval Optimisation
Cost Reduction
Fixed oil change intervals based on operating hours or calendar time are a conservative compromise that results in the majority of oil changes happening before the lubricant reaches its performance limit — wasting serviceable oil and increasing lubricant consumption and disposal costs unnecessarily. AI oil condition monitoring tracks the actual degradation rate of each lubricant sample and recommends the optimal drain point based on the oil's current condition trajectory — extending the drain interval when the oil is degrading slowly and compressing it when the oil is degrading faster than expected due to contamination or abnormal operating conditions. Facilities implementing condition-based drain intervals typically reduce lubricant consumption by 25 to 40 percent across the monitored fleet.
Lubricant wasted per fixed interval: 38%
Lubricant wasted per condition-based: 6%
Oil Analysis Parameters and AI Diagnostic Targets: Quick Reference
Scroll for more
| Parameter | ASTM Method | AI Detects | Failure Mode Indicated | Lead Time |
|---|---|---|---|---|
| Kinematic Viscosity | D445 | Degradation rate trend | Film strength loss, oxidation | 4–8 weeks |
| Particle Count (ISO 4406) | D7647 | Size class trend shift | Fatigue spall onset, abrasive wear | 3–6 weeks |
| Water Content | D6304 | Ingress rate modelling | Seal failure, corrosive wear | 2–5 weeks |
| Elemental Analysis (ICP) | D5185 | Wear element pattern | Bearing spall, gear micropitting | 4–10 weeks |
| Acid Number (TAN) | D664 | Oxidation rate trending | Additive depletion, acidic wear | 3–7 weeks |
How iFactory Powers AI Lubrication Failure Prediction
AI lubrication failure prediction requires both the analytical intelligence to detect degradation patterns and the operational integration to convert those predictions into maintenance actions before failure occurs. iFactory connects oil analysis laboratory results — whether from in-house FTIR and particle counters or external oil analysis laboratories — to a fleet-wide trending engine that maintains per-asset baselines, calculates multi-parameter failure signatures, and generates actionable maintenance recommendations ranked by predicted failure risk. When the AI flags a developing bearing failure on a critical compressor, iFactory creates a scheduled inspection work order, checks parts availability for the likely replacement component, and alerts the maintenance planner with the estimated intervention window — all before the analyst has reviewed the sample report. Teams can Talk to an Expert about connecting your oil analysis programme to iFactory's lubrication failure prediction engine.
Per-Asset Baseline Learning
iFactory learns individual degradation baselines for each lubricated asset, detecting deviations from that asset's specific normal trajectory rather than generic thresholds.
Lab Result Ingestion
Oil analysis results from external laboratories or in-house instruments ingest automatically, keeping trending models current without manual data entry.
Failure Risk Work Order Generation
Predicted failures generate scheduled maintenance work orders automatically, converting AI predictions into planned maintenance actions with no manual dispatch step.
Drain Interval Optimisation Engine
Condition-based oil change recommendations update with each sample, extending drain intervals on healthy oil and compressing them on oil degrading faster than expected.
Deploying AI Oil Analysis Trending: Six Steps
01
Audit Current Oil Analysis Programme and Data Coverage
Identify which assets are currently sampled, at what intervals, by which laboratory, and whether historical results are available in a format compatible with AI ingestion.
02
Ingest Historical Sample Series for Baseline Learning
Load at least 12 months of historical oil analysis results per asset into iFactory so the AI can establish per-asset baselines before the first live prediction is made.
03
Prioritise Critical Assets for Real-Time Monitoring
Identify the 20 percent of lubricated assets that account for the majority of failure consequence and configure them for the most frequent sampling and the tightest deviation detection thresholds.
04
Connect Oil Analysis Laboratory to Automatic Ingestion
Establish automatic ingestion of new laboratory reports into iFactory so trending models update within hours of each sample result, not when an analyst manually enters the data.
05
Configure Work Order Generation for Predicted Failures
Set the confidence threshold at which an AI degradation flag automatically generates a scheduled inspection or replacement work order in the CMMS.
06
Review and Extend Drain Intervals on Qualifying Assets
After 90 days of condition-based monitoring, identify assets where oil has consistently reached drain intervals in good condition and extend the sampling and drain interval to reduce lubricant cost.
Frequently Asked Questions
How is AI oil analysis trending different from standard threshold-based oil analysis?
Standard oil analysis compares each sample to a fixed threshold. AI trending learns each asset's individual degradation baseline and detects statistically anomalous rate changes across multiple parameters simultaneously — providing 4 to 8 weeks of lead time versus 0 to 1 week for threshold-based detection.
What oil analysis parameters does AI monitoring require to predict failure?
The minimum effective parameter set includes kinematic viscosity, particle count by size class, water content, and elemental analysis by ICP — all covered under standard ASTM D445, D7647, D6304, and D5185 methods available from any oil analysis laboratory.
How many historical samples are needed before the AI model generates reliable predictions?
The per-asset baseline requires a minimum of 6 samples from the same asset under similar operating conditions. With 12 or more samples, the model establishes statistically significant normal ranges that produce reliable deviation detection.
Can AI oil analysis predict which component is failing, not just that the oil is degraded?
Yes. Multi-parameter elemental pattern matching identifies the probable failing component from the combination of wear elements present — distinguishing bearing fatigue spall from gear micropitting from abrasive ingress from corrosive attack based on the specific elemental signature each failure mode produces.
How does iFactory integrate with existing oil analysis laboratory programmes?
iFactory ingests results from external oil analysis laboratories automatically when reports are delivered in standard formats, and connects to in-house instruments including FTIR spectrometers and particle counters via direct integration or file-based ingestion.
The Signals That Predict Your Next Lubrication Failure Are Already in Your Oil Samples. AI Trending Reads Them Weeks Before the Bearing Does.
iFactory connects AI lubrication failure prediction to your oil analysis programme, your maintenance workflow, and your parts inventory — converting degradation trends into planned replacements before failure forces an emergency response.