Steam trap failures are the silent energy tax every process plant pays without knowing exactly how much. DOE survey data consistently shows 15–30% of steam traps in an operating plant have failed at any point in time — either blowing live steam to drain (failed-open) or blocking condensate drainage (failed-closed). Both modes waste energy and damage processes, yet most plants have no systematic detection program and survey traps manually on multi-year cycles. Get iFactory Support to deploy continuous AI steam trap monitoring across your steam system today.
Detect Every Failed Steam Trap — Failed-Open, Failed-Closed, and Leaking
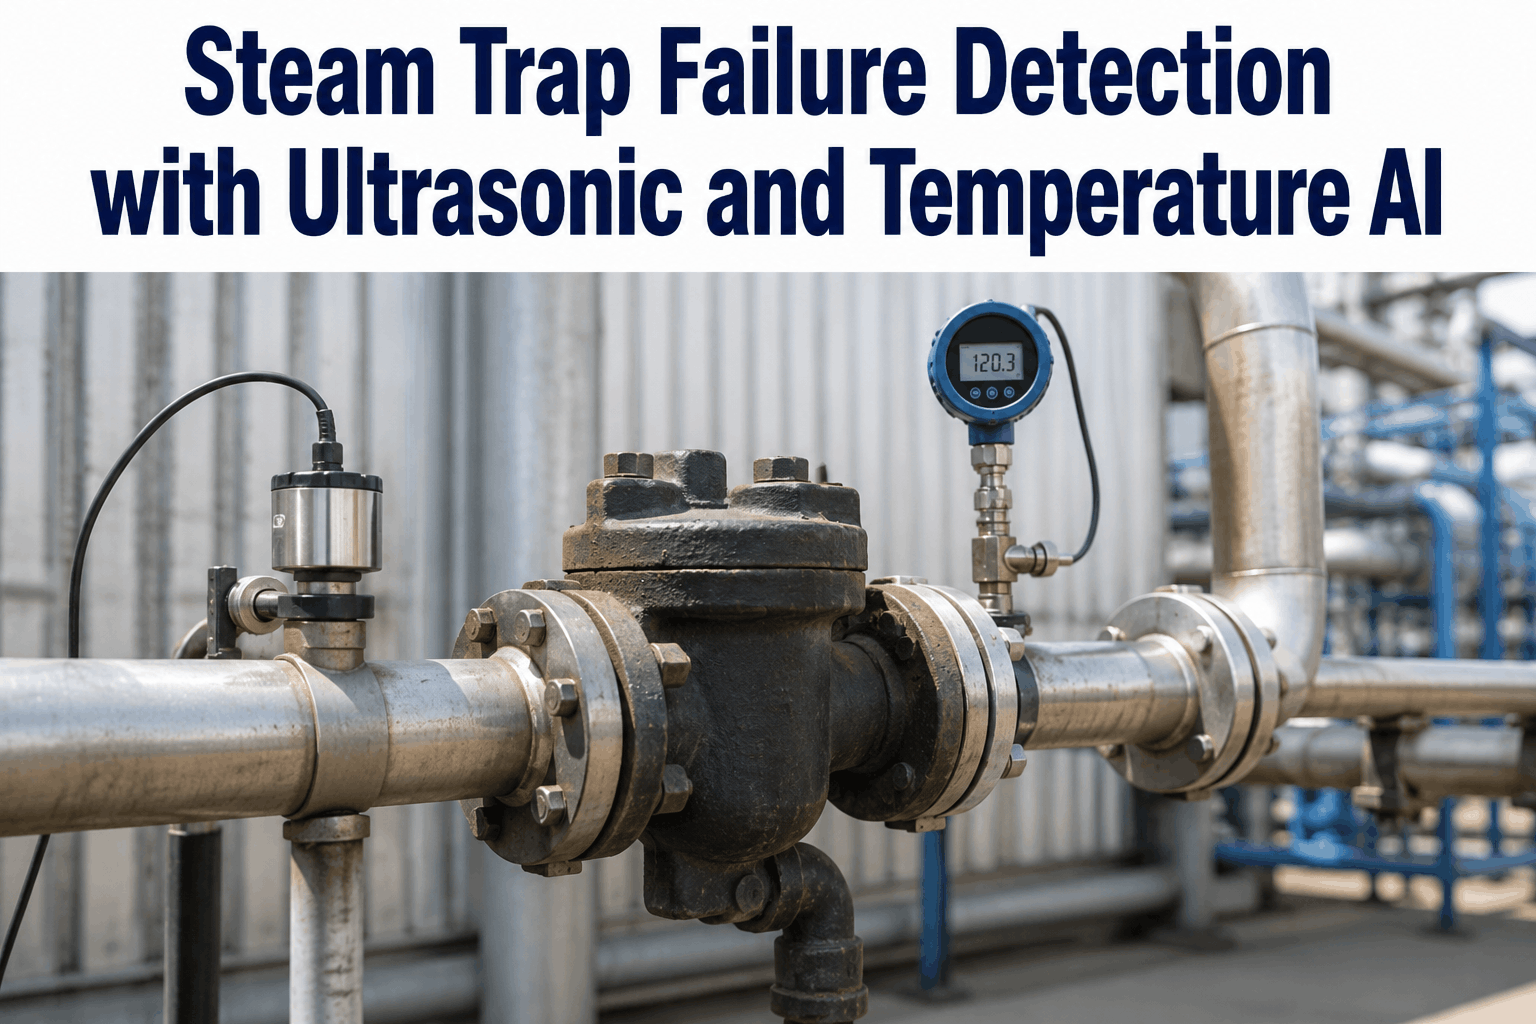
iFactory AI combines ultrasonic and temperature sensors to classify steam trap operating state continuously — identifying every failure mode across your entire steam system without manual survey walkdowns.
The Three Steam Trap Failure Modes and Their Energy Consequences
Steam trap failure analysis starts with understanding that the three failure modes — failed-open, failed-closed, and leaking — have completely different energy and process consequences, requiring different detection approaches and producing different urgency levels for corrective action. iFactory AI classifies each trap by failure mode, not just "pass/fail." Contact iFactory to build a failure mode-aware monitoring program for your steam system.
Mode 1
Failed-Open (Blowing Steam)
A trap stuck open allows live steam to pass continuously to the condensate return or drain system. Energy loss per failed-open trap ranges from 5 to 500+ kg/hr of steam depending on trap orifice size and system pressure. Detection signature: continuous ultrasonic sound level above the condensate noise floor with constant high downstream temperature.
Mode 2
Failed-Closed (Waterlogged)
A trap stuck closed prevents condensate drainage, causing condensate to accumulate in process equipment. Consequences include heat transfer reduction, water hammer, corrosion, and in steam-heated processes, product quality degradation. Detection signature: no acoustic activity at the trap outlet, upstream temperature approaching saturation, downstream temperature dropping.
Mode 3
Leaking (Partial Steam Loss)
A trap leaking live steam passes condensate normally but allows continuous low-level steam bypass. Harder to detect than complete failures, leaking traps typically account for the majority of total steam system losses by count. Detection signature: elevated ultrasonic frequency content above the condensate baseline combined with higher-than-expected downstream temperature.
Mode 4
Flooding (Partial Blockage)
A partially blocked trap discharges condensate intermittently at reduced rate, causing equipment to operate partially waterlogged without complete trap failure. Condensate levels fluctuate rather than stabilizing at fully flooded. Detection signature: irregular acoustic discharge intervals with upstream temperature cycling as condensate periodically backs up and clears.
Mode 5
Short Cycling
A trap opening and closing more frequently than its design cycle rate indicates oversized trap selection for the load, trapped air preventing proper operation, or degraded internal components. Short cycling accelerates mechanical wear and leads to premature failure. Detection signature: discharge cycle frequency significantly above the expected rate for the trap type and load.
Mode 6
Correct Operation
A correctly operating trap shows periodic acoustic discharge as condensate accumulates and is expelled, with discharge intervals consistent with the expected load and trap type. Upstream temperature matches steam saturation temperature at system pressure. AI maintains baseline acoustic and thermal profiles for each trap to detect drift from correct operation as early as possible.
The Steam Energy Loss Calculation: Why Every Trap Matters
The financial case for continuous steam trap monitoring is straightforward once you quantify the energy loss per failed trap. The calculation depends on orifice size, system pressure, and steam cost — but even modest trap failure rates represent significant annual losses at typical industrial steam costs. Book a demo to see iFactory calculate the energy loss estimate for your specific steam system configuration.
Scroll for more →
| Trap Orifice Size | Steam Loss Rate (failed-open) | Annual Cost @ $25/1000 kg | Monitoring Priority |
|---|---|---|---|
| Small (DN15, 3/8″) | 5–15 kg/hr @ 7 bar | $1,100–$3,300/yr per trap | Medium — rapid ROI at scale |
| Medium (DN25, 1″) | 25–60 kg/hr @ 7 bar | $5,500–$13,000/yr per trap | High — single trap pays monitoring cost |
| Large (DN50, 2″) | 100–300 kg/hr @ 7 bar | $22,000–$66,000/yr per trap | Critical — immediate detection required |
| High-Pressure Small | 15–40 kg/hr @ 30 bar | $3,300–$8,800/yr per trap | High — pressure multiplies loss rate |
| High-Pressure Large | 200–600 kg/hr @ 30 bar | $44,000–$130,000/yr per trap | Critical — continuous monitoring mandatory |
AI Detection Performance Across Steam Trap Failure Modes
Failed-Open Detection Accuracy
97% Accuracy
Failed-open traps are the highest-loss failure mode and the easiest for AI to detect reliably. Continuous ultrasonic sound above the condensate noise floor combined with constant elevated downstream temperature produces an unambiguous signal that iFactory AI classifies with 97% accuracy across validated steam system deployments.
Leak Detection Sensitivity
Detects From 5% Steam Loss
Leaking traps — the hardest failure mode to detect — are identified by iFactory AI at steam leak rates as low as 5% of full-flow loss. This sensitivity threshold catches traps that pass manual survey because the acoustic signature is ambiguous to a human operator but statistically distinguishable from condensate-only baseline by the AI model.
Monitoring Coverage Frequency
Continuous vs 2-Year Survey Cycle
Most industrial plants conduct manual steam trap surveys on 2–3 year cycles. A trap that fails the day after a survey operates in the failed state for up to 3 years before detection. Continuous iFactory monitoring detects every failure within hours of onset — the average detection delay is under 4 hours across deployed systems.
Energy Recovery ROI
Typical: 8–18 Month Payback
Plants deploying iFactory AI steam trap monitoring consistently achieve 8–18 month payback periods from steam energy recovery alone, before accounting for avoided process downtime from failed-closed traps and water hammer damage from waterlogged equipment. For plants with 500+ traps, first-year energy savings often exceed the full program cost.
How iFactory AI Classifies Steam Trap Operating State
Dual-Sensor Data Acquisition Core Architecture
Each monitored trap receives two sensors: an ultrasonic transducer clamped to the trap body or outlet pipe, and a surface-mount temperature sensor on the downstream pipe. The ultrasonic sensor captures acoustic activity in the 20–200kHz frequency range — above audible noise from piping systems — while the temperature sensor provides the thermal context that resolves ambiguous acoustic signals.
Trap-Specific Baseline Establishment
AI builds a unique acoustic and thermal baseline for each trap during a 7–14 day commissioning period. Baselines capture the normal discharge cycle pattern for thermodynamic, thermostatic, float-and-thermostatic, and inverted bucket trap types — which produce distinctly different acoustic signatures during correct operation. No generic baseline is applied across trap types.
Acoustic Feature Extraction
AI extracts multiple acoustic features from the ultrasonic signal: RMS sound level, spectral centroid frequency, discharge cycle frequency, discharge duration, and inter-discharge interval statistics. The combination of these features provides the diagnostic fingerprint that distinguishes the six operating states — correct operation, failed-open, failed-closed, leaking, flooding, and short cycling — with high confidence.
Temperature-Acoustic Fusion Classification
Temperature data resolves classification ambiguities in the acoustic signal alone. A trap showing elevated acoustic activity could be either a normally discharging trap under high condensate load, or a leaking trap. If downstream temperature is also elevated above the saturated water temperature at system pressure, the classification resolves to leaking — the thermal data provides the discriminating information the acoustic signal cannot.
Energy Loss Quantification
For traps classified as failed-open or leaking, iFactory AI calculates instantaneous steam loss rate using the acoustic amplitude, downstream temperature, and system pressure to estimate orifice flow conditions. Estimated loss rates are expressed in kg/hr of steam and converted to financial loss at your site steam cost — providing economic context for maintenance prioritization decisions.
Prioritized Work Order Generation
Traps classified as failed-open or leaking generate CMMS work orders automatically, sorted by estimated energy loss rate — the highest-loss traps appear first in the repair queue. iFactory tracks repair completion and resets the trap baseline post-maintenance, verifying that the repair resolved the classified failure mode rather than creating a new condition. Get iFactory Support to configure CMMS integration for automatic work order generation.
Sensor and Network Architecture for Steam Trap Monitoring
Ultrasonic Transducers
Contact ultrasonic sensors rated for steam piping environments — 300°C, 100 bar — with magnetic or clamp-on installation requiring no pipe penetration
Surface Temperature Sensors
RTD or thermocouple sensors bonded to downstream pipe surface provide the thermal context for AI classification of every acoustic signal
Wireless IoT Gateway
LoRaWAN or ISA100 wireless gateways collect data from up to 200 trap sensors per gateway — designed for industrial environments with ISA/ATEX certification for hazardous area deployment
Steam System Dashboard
Live status map of every monitored trap with failure classification, energy loss estimate, and total system loss summary — updated continuously
Deployment Pathway: Steam Trap Monitoring in 6 Phases
01
Steam Trap Inventory and Criticality Ranking
Compile a complete steam trap inventory: location, trap type, orifice size, design pressure, and process function. Rank traps by criticality using orifice size (energy loss potential) and process function (failed-closed consequence) as the primary ranking factors — these determine sensor deployment priority.
02
Baseline Survey Before Sensor Deployment
Conduct a manual ultrasonic survey of all traps in the deployment scope before installing continuous sensors. This establishes the starting condition of each trap — identifying traps already failed that need repair before monitoring begins — and provides the initial pass/fail data that the AI baseline will subsequently track for drift.
03
Sensor Installation
Install ultrasonic and temperature sensors at each trap location without process shutdown. Sensor installation per trap takes 15–30 minutes in accessible locations. iFactory provides certified intrinsically safe sensors for Class I/II hazardous area installations and provides installation guidance documentation for each trap type.
04
AI Baseline Commissioning
Allow 7–14 days for AI baseline development per trap. During commissioning, iFactory flags any trap showing suspicious patterns for human review — traps that are already failed but not definitively classifiable from the baseline period are escalated for inspection before baseline lock.
05
CMMS Integration and Alert Configuration
Configure alert routing: failed-open and leaking traps above a configurable energy loss threshold generate immediate CMMS work orders; failed-closed traps on critical process equipment generate urgent alerts to the process engineer as well as maintenance. Alert thresholds are configurable per trap based on process criticality.
06
Energy Loss Reporting and Program Expansion
iFactory generates monthly energy loss reports showing total steam loss by failure mode, traps repaired and energy recovered, and program ROI to date. These reports build the business case for expanding sensor coverage to the full trap population. Book a demo to see a sample energy loss report from an active deployment.
Frequently Asked Questions
What percentage of steam traps fail in a typical industrial plant?
DOE survey data across industrial steam systems shows 15–30% of steam traps are in a failed state at any point in time in plants without active monitoring and repair programs. Plants with annual manual survey programs typically reduce this to 8–15%. Continuous AI monitoring with rapid repair response drives failure rates below 3% in well-maintained systems.
Can iFactory detect steam trap failures on high-pressure superheated steam lines?
Yes. iFactory sensors are rated for applications up to 300°C and 100 bar. High-pressure traps are actually easier to classify than low-pressure traps because the acoustic and thermal differential between failed-open and correct operation is more pronounced at higher pressures. High-pressure traps also represent the highest energy loss per failure — making them the highest priority for continuous monitoring deployment.
How does AI distinguish between a correctly operating thermodynamic disc trap and a failed-open trap?
A thermodynamic disc trap produces a distinctive repetitive "click" — the disc seating and unseating — at intervals that vary with condensate load and system pressure. A failed-open thermodynamic disc produces either a continuous steam flow sound (disc not seating at all) or an abnormally short inter-discharge interval (disc unable to hold against steam pressure). AI baseline models per trap type capture the expected discharge pattern and flag deviations statistically.
What happens to AI classification accuracy when steam system pressure changes?
iFactory integrates with plant DCS or SCADA systems to receive real-time system pressure data. The AI classification model uses instantaneous pressure as an input variable — recalculating saturation temperature references and expected acoustic signatures at each pressure condition. Plants with frequent pressure variation during startup, shutdown, or load changes see no classification accuracy degradation because pressure context is always current.
How many steam traps can iFactory monitor and what does deployment cost?
iFactory scales from pilot deployments of 20–50 traps to enterprise programs covering 5,000+ traps across multiple facilities. Each IoT gateway supports up to 200 trap sensor nodes. Deployment cost per trap decreases significantly at scale — large programs achieve per-trap monitoring costs that are recovered from energy savings within the first year at typical industrial steam prices. Contact iFactory for a site-specific cost and ROI estimate.
Stop Losing Steam — Start Monitoring Every Trap Continuously
iFactory AI detects failed-open, failed-closed, and leaking steam traps within hours of failure onset — across your entire steam system, without annual survey walkdowns or missed failures between inspection cycles.