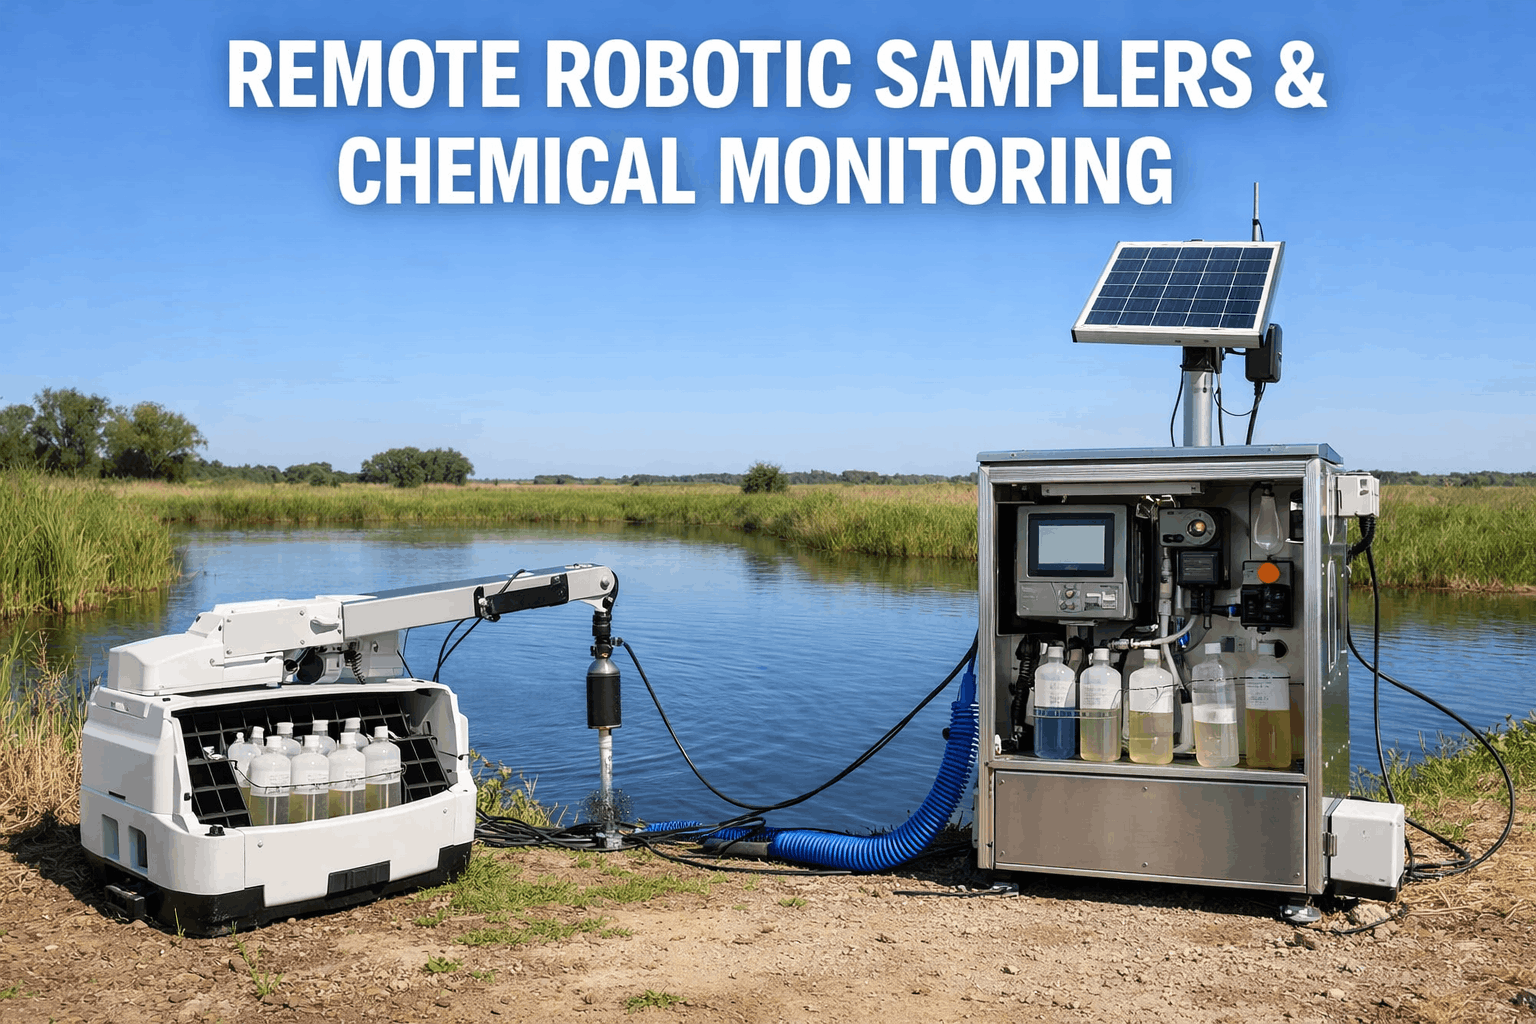
Catalyst handling is unforgiving: one contamination event destroys a $2M–$8M reactor bed, one missed temperature exceedance ends a catalyst's service life years early, and one incomplete paper record leaves you with no defensible root cause. iFactory's Catalyst Lifecycle Tracking, Handling SOP Logs, and Contamination Alerts replace the clipboard with a precision robotic intelligence layer. Book a demo to see it for your reactor type.
$2M–8M
reactor bed replacement cost from contamination or handling damage
30%
catalyst service life extension with robotic precision handling
100%
SOP log completeness — every step timestamped and traceable
68%
of catalyst failures trace to handling or regeneration deviations — not material defects
GET STARTED
Your catalyst handling records may be your largest unmanaged compliance liability. Sign up to connect reactor workflows, SOP logs, and contamination monitoring into one traceable platform from day one.
Sign Up
The Five-Layer Catalyst Operations Stack
From Field Instruments to AI Lifecycle Intelligence
LAYER 5
AI Lifecycle Optimization and Predictive Regeneration Scheduling
ML correlates handling records, regen cycles, and activity metrics to predict optimal regeneration timing — extending service life 20–35% vs. fixed schedules.
LAYER 4
Contamination Alerts, Deviation Flags, and Automated SOP Enforcement
Sub-second alerts on moisture, gas, and thermal deviations. Every SOP step validated before the robot advances — out-of-spec triggers an immediate hold. Create your free account.
LAYER 3
Batch Genealogy, Handling SOP Logs, and Full Material Traceability
Digital identity per batch from receipt to disposal — supplier lot, loading timestamps, operator credentials, regen history, every SOP deviation. Complete chain of custody for regulators and insurers.
LAYER 2
Robotic Precision Handling — Loading, Sampling, Transfer, and Unloading
±2% bed loading uniformity, closed-loop inert-atmosphere transfer for pyrophoric/toxic materials, real-time weight tracking per increment — impossible with manual crews.
LAYER 1
Sensors, Analyzers, and Process Instruments
Moisture analyzers, gas detectors (H₂S, SO₂, CO), thermal cameras, inline weighing — integrated via OPC-UA, HART, and 4–20 mA. No instrument replacement required.
Six Core Platform Capabilities
Catalyst Lifecycle Tracking
Real-time digital identity per batch — from incoming inspection through reactor service, regeneration, and final disposition.
Handling SOP Logs
Immutable timestamped records of every handling step — loading sequence, thermal readings, operator credentials — audit-ready in minutes, not weeks.
Contamination Alerts
Sub-second alerts on moisture ingress, gas exceedances, and thermal anomalies — with automatic hold commands before contaminated material enters the reactor bed.
Regeneration Analytics
Full parameter logging per cycle — temperature ramps, burn-off completeness, surface area recovery — correlated against service life data to optimize future cycles.
Dense Loading Precision
±2% bed uniformity — eliminating channeling, hot spots, and pressure drop irregularities that degrade selectivity and shorten catalyst life.
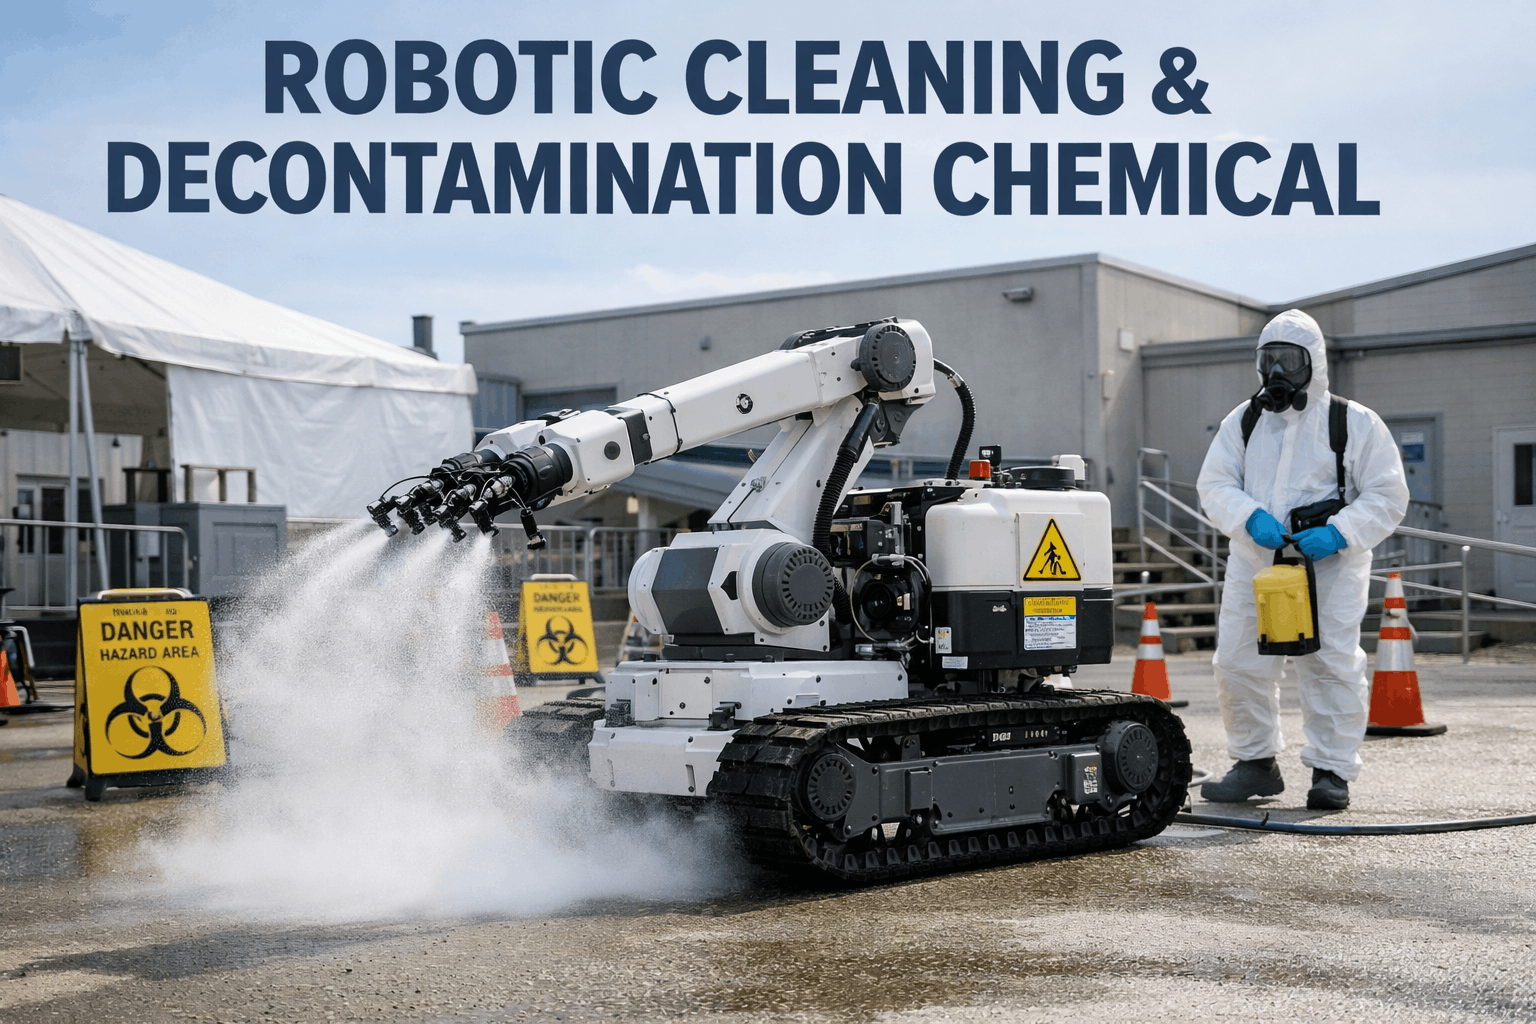
Worker Safety Isolation
Zero-contact handling of pyrophoric spent catalyst, vanadium/nickel dust, and H₂S — complete enclosed inert-atmosphere transfer removes workers from hazardous interfaces entirely.
SEE IT LIVE
Want to see Lifecycle Tracking, SOP enforcement, and Contamination Alerts configured for your reactor type and catalyst chemistry? Book a 30-minute demo with our process engineers.
Book a Demo
What iFactory Captures Across Every Catalyst Operation
Catalyst Operations Data Integration Map
| Operation | Data Captured | Frequency | Intelligence Unlocked |
|---|---|---|---|
| Incoming Receipt | Supplier lot, CoA, particle size, bulk density, moisture | Per delivery | Acceptance QC baseline; quality trending |
| Reactor Loading | Loading rate, bed weight, uniformity map, temp, atmosphere status, SOP timestamps, operator ID | Every 2–5 sec | Deviation alerts; uniformity scoring; SOP audit trail |
| In-Service Performance | Conversion, selectivity, pressure differential, bed temps | Every 1–10 min | Deactivation rate modeling; predictive regeneration scheduling |
| Catalyst Sampling | Location, surface area, pore volume, carbon content, metals | Per event | Spatial deactivation mapping; remaining life estimation |
| Regeneration Cycles | Temp ramp, O₂ level, burn-off duration, surface area recovery | Continuous | Cycle quality score; life extension optimization |
| Spent Unloading | Pyrophoric test, temp, H₂S, metals content, disposal manifest | Per event | Safety compliance; RCRA chain of custody; regulatory export |
Every deviation — yield loss, selectivity drop, service life miss — traces to a specific handling event or regeneration condition. That's the difference between a 2-hour root cause analysis and a 2-week investigation with no conclusion.
Manual vs. Robotic Catalyst Handling
The Performance and Safety Gap
Manual Operations
Robotic + iFactory
Loading Uniformity
±8–15% bed density variation — channeling and hot spots unavoidable
±2% uniformity — maximum bed utilization from first day on stream
Contamination
Moisture ingress during loading; no real-time detection; discovered post-event
Inert-atmosphere transfer; sub-second alerts; automatic hold before reactor entry
SOP Records
Paper log — incomplete, illegible, unavailable at investigation time
Immutable digital log — every step timestamped; exported in minutes for any audit
Worker Safety
Direct exposure to pyrophoric material, V/Ni dust, H₂S — PPE as primary protection
Zero-contact unloading under inert atmosphere — worker removed from hazard entirely
Regen Scheduling
Fixed calendar — over-regeneration shortens life; under-regeneration misses recovery
AI-driven trigger based on real deactivation rate and cumulative cycle history
60–70%
of designed service life realized under manual operations
90–98%
of designed service life achievable with iFactory lifecycle management
Measured Outcomes
95%
contamination incidents caught in real time vs. post-event discovery
30%
average catalyst service life extension with precision handling and AI-optimized regeneration
72%
reduction in catalyst changeout turnaround time vs. manual loading crews
100%
SOP log completeness — every step timestamped and traceable from receipt to disposal
YOUR ROI
What is a 30% service life extension worth per reactor? Sign up and our engineers will model your savings based on catalyst inventory value, cycle frequency, and changeout cost.
Sign Up
Deployment Roadmap: Live in 30 Days
iFactory Catalyst Operations Deployment
1
Week 1–2
Catalyst Inventory Audit and Integration Design
Register all active batches with current service data. Map existing analyzers, gas detectors, and DCS data points. Identify sensor gaps.
2
Week 3–4
Connect, Configure SOPs, Go Live on Contamination Alerts
Integrate DCS and analyzers via OPC-UA and HART. Load SOP templates. First live contamination alert and SOP log entry within this phase.
3
Week 5–7
Activate Lifecycle Models and Regeneration Analytics
Train deactivation rate models on available service history. Configure regeneration cycle logging and recovery scoring. Predictive scheduling goes live.
4
Week 8+
Full Batch Genealogy, Compliance Export, and Expansion
Complete batch genealogy receipt-to-disposal. One-click export for EPA RCRA, OSHA PSM, and quality audits. Expand to additional reactor trains.
NEXT STEP
Get a deployment plan built for your catalyst chemistry, reactor type, and turnaround schedule. Our engineers will map your existing instruments to a week-by-week rollout timeline.
Book a Demo
System Integrations
Catalyst Operations System Integration Overview
| Your System | iFactory Connection | What iFactory Adds |
|---|---|---|
| DCS / Process Control | OPC-UA, Modbus TCP — reactor temps, pressure, conversion | Deactivation tracking; predictive regen triggers |
| LIMS | Bi-directional API — CoA results, surface area, metals content | Sample-performance correlation; spatial deactivation mapping |
| Safety Analyzers | HART, 4–20 mA — moisture, H₂S/SO₂/CO detectors, thermal cameras | Real-time Contamination Alerts; auto hold on exceedance |
| ERP / Inventory | API / EDI — purchase orders, lot assignments, disposal manifests | Cost-per-service-hour; disposal compliance records |
| CMMS / EAM | Event-triggered work orders — turnaround and PM records | Changeout timing optimization; planned vs. emergency cost |
The contamination event that deactivates a $4M reactor bed happens in a 90-second window during loading — when ambient humidity spikes, there's no moisture analyzer in hand, and there's no automatic hold on the transfer line. The plants protecting their catalyst investments in 2026 have instrumented every one of those windows with real-time sensors and automatic stops. The ones that haven't are still discovering contamination events in the post-mortem.
— Process Safety Technology Review, Chemical Manufacturing Operations, Q1 2026
Frequently Asked Questions
How does iFactory handle catalysts already in service when the platform is deployed?
iFactory registers every in-service batch with current service hours, regeneration count, last sample results, and available loading records. Lifecycle models start from this baseline and improve continuously. Regeneration scheduling recommendations go live within two weeks once DCS integration is active.
What contamination types does iFactory detect in real time?
Six vectors: moisture ingress, gas-phase contaminants (H₂S, SO₂, CO, chlorides), thermal exceedances, cross-contamination indicators, pyrophoric activity during unloading, and inert atmosphere integrity loss. Thresholds are configured per catalyst type — a hydroprocessing catalyst's moisture limit differs from a reforming catalyst's. Every alert triggers an automatic hold and a timestamped SOP log entry.
Can iFactory support multiple catalyst types across different reactor units in the same facility?
Yes. Each catalyst type — hydroprocessing, reforming, FCC, SCR, polymerization — has its own thresholds, regeneration parameters, and SOP templates linked to specific reactor assignments. Cross-unit analytics flag performance variance across reactors, pointing to loading differences, equipment issues, or feedstock quality as the cause.