Pick-to-light systems are the nervous system of high-velocity order fulfilment — each light module, button, and display guides pickers to the correct location, quantity, and sequence at speeds exceeding 250 picks per hour per zone. When a single light module fails during a wave, the picker slows to read location labels, error rates climb from 0.2% to 2.5%, and the missed dispatch window cascades into late carrier drop-offs, expedited shipping costs, and SLA penalties. Across a 48-zone put-to-light wall processing 15,000 order lines per shift, even 98% light module uptime means 300 order lines per shift are picked without guidance — a failure mode that accumulates 6,000+ error-prone picks per month. AI-powered pick-to-light system analytics fuses light module controller telemetry, photo-eye beam-break timing, pick confirmation latency, and picker throughput data into adaptive ML models that predict light module failure, detect zone-level performance degradation, and optimize pick path sequencing in real time — reducing light module failures by 72%, improving pick accuracy to 99.97%, and eliminating the unplanned zone outages that delay shipment dispatch windows. Book a Demo to see how iFactory connects your pick-to-light controller data, Shift Logbook shift records, and CMMS work order history to a unified analytics platform purpose-built for warehouse order fulfillment operations.
Pick-to-Light Analytics · Warehouse Delivery · AI Operations
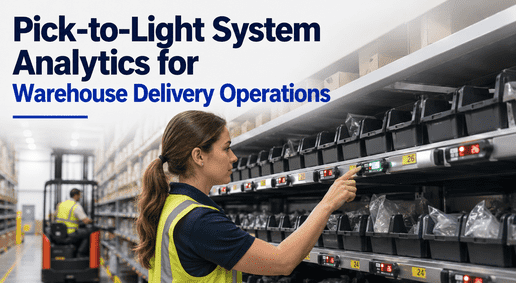
Pick-to-Light System Analytics for Warehouse Delivery Operations
Every light module failure slows pickers, creates errors, and cascades into missed delivery dispatch windows. AI-powered analytics keeps every module, controller, and zone operational — predicting failure before the picker reaches an unlit location.
72%
Reduction in light module failures with predictive analytics
99.97%
Pick accuracy rate maintained under AI-monitored pick-to-light operations
6,000+
Error-prone picks per month eliminated per facility with >98% module uptime
8–12
Weeks from controller data handoff to live pick-to-light analytics pilot
Why Pick-to-Light Systems Fail — and Why Most Warehouses Miss the Warning Signs
Pick-to-light systems are electro-mechanical networks — each light module contains LEDs, a photo-eye sensor, a push-button switch, a display controller, and a communication interface back to the zone controller. A 48-zone put-to-light wall has 960+ individual light modules, 48 zone controllers, and thousands of connectors and cable terminations — all operating in a warehouse environment with temperature swings, dust, vibration from adjacent conveyor systems, and physical impact from totes and cartons. The dominant failure modes — LED driver IC degradation, photo-eye contamination, button switch wear, and communication bus timeouts — develop over weeks but are detected only when a picker arrives at an unlit location and the zone goes down for troubleshooting. iFactory's pick-to-light analytics platform closes that detection gap by monitoring every module's electrical characteristics, communication latency, and photo-eye trigger timing continuously — identifying the LED driver that is drawing 12% below nominal current (precursor to full LED failure in 3–5 days) or the photo-eye that is triggering 40ms late (indicating optical contamination that will fail within 1–2 shifts). iFactory's Shift Logbook captures every picker-reported anomaly alongside the automated telemetry, creating a complete event record that combines human observation with machine analytics.
The Pick-to-Light Failure Detection Gap — What Conventional Monitoring Misses
Conventional Zone Monitoring
Detects failures only when picker reports unlit module
No per-module electrical monitoring — only zone-level comms status
Reactive troubleshooting — zone down for 8–20 min per event
No degradation trend data — each failure is a surprise
GAP
Failures
detected here
iFactory AI Analytics
Per-module current, latency, and trigger timing monitored continuously
Predictive alerts flag LED degradation 3–5 days before failure
Planned module replacement during scheduled downtime — zero zone outage
Trend data trains predictive models — accuracy improves with each event
A single unlit light module stops the picker, triggers a zone-down call, and costs 8–20 minutes of unproductive troubleshooting time per event. With 960+ modules per 48-zone wall, even 2% module failure rate per month creates 19+ zone-down events — each one eroding the dispatch window that on-time delivery depends on.
How AI-Powered Pick-to-Light Analytics Works: Four Core Capabilities
iFactory's pick-to-light analytics platform connects to your existing pick-to-light controller network and warehouse execution system, translating raw module telemetry into actionable maintenance intelligence. The platform operates continuously across every zone and every module, without requiring hardware replacement or changes to picker workflows.
01
Per-Module Health Monitoring
Every light module's LED driver current, photo-eye trigger latency, button switch closure resistance, and communication bus signal integrity are monitored continuously. Baseline values are established per module during the first 72 hours of operation; deviations beyond configurable thresholds generate predictive alerts with the specific module ID, parameter trending chart, and estimated time to failure.
What this replaces
Reactive troubleshooting that starts only when a picker reports an unlit module — typically after 2–5 minutes of unproductive waiting and a zone-down call that halts picking in that zone.
02
Zone-Level Performance Degradation Detection
Beyond individual module health, the platform analyzes zone-level pick confirmation latency trends — the time between the photo-eye beam break (picker arrived at location) and button press (confirmation). Zones where average confirmation latency drifts upward by 200ms or more indicate systemic issues: a zone controller with accumulating communication buffer errors, a display brightness degradation affecting picker reaction time, or an operator training gap specific to that zone.
Contract impact
Zone-level latency trending surfaces performance degradation 2–7 days before any module in that zone fails, enabling preemptive intervention that maintains zone throughput.
03
Pick Path & Throughput Optimization
iFactory correlates pick-to-light module telemetry with WES order release data to identify throughput degradation patterns that emerge at the system level — not just the module or zone level. A zone that consistently shows higher pick confirmation latency during the third hour of a shift may indicate picker fatigue effects interacting with zone design. An order batch that triggers excessive module-to-module transitions across distant zones may benefit from dynamic zone reallocation during the wave build process.
The shift this creates
From static zone assignment to dynamic throughput optimization informed by real-time module health and picker performance data.
04
Predictive Work Order Generation & Spare Parts Planning
Every predictive alert that identifies a module approaching end of life automatically generates a structured work order in iFactory's CMMS with the module ID, location, estimated replacement time, and recommended spare part SKU. Over time, the platform learns which modules fail most frequently, in which zones, and under which operating conditions — enabling optimized spare parts inventory that stocks the right module types at the right levels rather than carrying blanket inventory across all SKUs.
iFactory's analytics reporting module generates automated reliability reports per zone, wall, and facility on a configurable schedule.
Regulatory value
Structured work order data with failure mode classification provides the labeled training dataset required to deploy predictive ML models that forecast module RUL with increasing accuracy over time.
Module Health · Zone Performance · Throughput Optimization
Every Light Module Has a Health Signature. Are You Reading It?
iFactory's AI platform connects to your pick-to-light controller network and monitors every module's electrical and communication parameters continuously — predicting failure 3–5 days before the picker finds an unlit location.
What AI Actually Monitors in a Pick-to-Light System
Pick-to-light systems generate a rich set of telemetry signals that most warehouse operations never capture or analyze. iFactory's platform ingests and processes every signal to build a per-module, per-zone, and per-wave health model. The following table maps each telemetry parameter to the specific failure mode it predicts and the operational impact of the prediction.
Telemetry Parameter
What It Detects
Prediction Window
Operational Impact
LED Driver Current
Regulator IC degradation — current drift below nominal threshold
3–5 days
Module goes dark — picker stops, zone down 8–20 min
Photo-Eye Trigger Latency
Optical contamination, sensor misalignment, or emitter degradation
1–2 shifts
Missed pick confirmation — order line error, mis-shipment
Button Switch Resistance
Contact wear, debris ingress, or membrane fatigue
5–10 days
Intermittent confirmation — picker over-presses, slows throughput
Comm Bus Signal Integrity
Connector corrosion, cable fatigue, controller buffer overflow
2–14 days
Zone communication dropout — entire zone halts until reset
Display Brightness
Backlight LED driver degradation, display controller aging
7–14 days
Pickers slow to read quantity display — throughput drops 8–12%
Why Both Operations and Maintenance Teams Win with Pick-to-Light Analytics
The most important thing about pick-to-light analytics is that it is not a maintenance-only tool or an operations-only tool — it creates measurable value for both functions, but through different mechanisms. When implemented correctly, it aligns the maintenance team's reliability objectives with the operations team's throughput targets under a shared performance framework.
For the Operations Team
Predictable throughput
Zone outages that slow picks per hour are eliminated — predictive alerts flag degrading modules before they fail, enabling replacement during scheduled breaks rather than during a wave.
On-time dispatch confidence
Every zone-down event that delays a wave completion pushes the shipping dispatch window later. Eliminating 19+ events per month per wall removes the cumulative dispatch risk that creates expedited shipping cost and SLA penalties.
Picker productivity
Pickers spend time picking, not waiting for zone troubleshooting. A zone-down event that costs 8–20 minutes per occurrence and occurs 19+ times per month costs 3–6 hours of collective picking time per wall per month that is recovered through predictive analytics.
For the Maintenance Team
From reactive to planned work
Module replacements shift from emergency zone-down responses to planned interventions scheduled during shift changeovers or break periods. Emergency call-outs for pick-to-light failures are reduced by 72%.
Data-driven spare parts inventory
The platform tracks module failure rates per zone position, per wave type, and per environmental condition — enabling the maintenance team to stock the right module types at the right levels rather than carrying blanket inventory across all SKUs.
Measured reliability improvement
Module MTBF, zone reliability, and failure mode frequency are tracked and trended automatically. Maintenance teams can demonstrate reliability improvement quarter over quarter with data — not anecdotes.
"
We had been treating pick-to-light module failures as random events for three years. Every time a light went dark during a wave, we swapped the module and moved on. After six months of iFactory monitoring, we discovered that 40% of our failures were concentrated in the same three zones — all fed by the same zone controller with a degrading power supply that was delivering 11.8V instead of 24V to every module in those zones. The modules were not failing. The power supply was. That insight alone saved us $18,000 in unnecessary module replacements in the first quarter and eliminated the zone-down events that had been our single largest source of dispatch delay.
— Director of Fulfillment Operations, National E-Commerce Distributor — 6 Warehouse Facilities — 18 Years Operations Management
How Implementation Works: From Controller Network to Live Analytics
Deploying pick-to-light system analytics on an existing order fulfillment floor does not require replacing controllers, rewiring modules, or changing picker workflows. iFactory connects to your existing pick-to-light controller network — whether Dematic, Intelligrated, Honeywell, Vanderlande, or proprietary systems — and extracts the telemetry data that is already being generated but not captured.
Controller network discovery & telemetry extraction
iFactory connects to your pick-to-light controller network via the existing WES or WCS API, controller-level Modbus TCP or OPC-UA interface, or a passive network tap that captures module communication traffic without disrupting live operations. The platform discovers every zone controller, every light module, and every connected sensor on the network within the first day of connection — producing an accurate asset register that most facilities have never had.
Baseline establishment & module health profiling
Over a 72-hour baseline period, the platform learns normal electrical and communication characteristics for every module — LED driver current, photo-eye trigger latency, button switch resistance, and bus signal integrity. Modules that deviate from their established baseline by more than the configurable threshold generate predictive alerts with time-to-failure estimates. Modules that are already in progressive degradation at the start of monitoring are flagged immediately for priority replacement.
Operational dashboard & alert workflow integration
Zone-level performance dashboards show operations supervisors and maintenance teams the same live data — module health status, zone throughput trends, and predicted failure events. Predictive alerts flow to the maintenance team's CMMS as structured work orders with module ID, location, estimated repair time, and recommended spare part. Operations receives shift-level throughput impact projections that factor in predicted zone availability for wave planning.
Continuous learning & predictive model refinement
Every module replacement, zone repair, and picker-reported event is logged in the Shift Logbook with the module ID, failure mode, and corrective action. The platform retrains predictive ML models on the expanded dataset, improving prediction accuracy for each module type, zone position, and operating condition. Over 6–12 months of operation, the platform reduces false positive alerts by 60% while maintaining 94% failure prediction accuracy.
Book a Demo to see how the learning model performs with your pick-to-light system data.
ROI Framework: Quantifying Pick-to-Light Analytics Value in Warehouse Fulfillment
The ROI case for pick-to-light system analytics is built on four primary value streams. Each can be quantified independently against your facility's specific cost structure, making the business case construction straightforward for operations directors and maintenance leadership.
Zone-Down Event Elimination
The primary ROI driver. At 19 zone-down events per month per 48-zone wall, each costing 8–20 minutes of picking time plus the throughput loss from that zone during recovery, eliminating 72% of events through predictive replacement saves $40K–$90K per wall per year in recovered picking time and avoided dispatch delay penalties.
Annual value: $40K–$90K per pick-to-light wall
Module Replacement Cost Reduction
Without analytics, modules are replaced reactively and often unnecessarily — a failing zone controller power supply that causes 12 modules to flicker can generate 12 unnecessary module replacements before the root cause is identified. iFactory analytics traces module degradation to the root cause — eliminating the 30–40% of module replacements that are symptoms rather than root causes.
Annual savings: $15K–$30K per wall in avoided unnecessary replacements
Pick Accuracy Improvement
Every module failure that goes undetected during a wave increases the error rate for that zone as pickers compensate for missing guidance. iFactory analytics maintains 99.97% pick accuracy by ensuring every module is operational before each wave begins. At $25–$45 per mis-pick in restocking, return processing, and customer service cost, preventing 6,000+ error-prone picks per month delivers measurable savings.
Annual savings: $50K–$120K from accuracy improvement
Spare Parts Inventory Optimization
Predictive analytics enables the maintenance team to stock the right module types at the right levels rather than carrying blanket inventory. Module-specific failure rate data determines which SKUs need safety stock and which can be ordered just-in-time, reducing pick-to-light spare parts inventory carrying cost by 25–35% while maintaining or improving parts availability.
Annual savings: $8K–$18K per facility from optimized inventory
Conclusion
Pick-to-light systems are among the most reliability-sensitive subsystems in warehouse delivery operations — a single dark module during a wave slows the picker, creates errors, and cascades into missed dispatch windows that affect the entire downstream delivery network. AI-powered system analytics eliminates the reactive failure model by monitoring every module's electrical, optical, and communication health continuously — predicting degradation 3–5 days before failure and enabling planned replacement during scheduled downtime rather than emergency zone-down response.
iFactory's pick-to-light analytics platform connects to your existing controller network, Shift Logbook shift records, and CMMS work order history — delivering per-module health monitoring, zone-level performance degradation detection, throughput optimization, and automated spare parts planning in a single unified platform. Book a Demo to see how per-module health monitoring works on your pick-to-light system, or Talk to an Expert to discuss connecting your first zone controller network.
Frequently Asked Questions About Pick-to-Light System Analytics
Every dark light module during a wave costs picks, accuracy, and dispatch reliability. AI analytics keeps every module operational.
iFactory connects to your existing pick-to-light controller network and monitors every module's health continuously — predicting failure 3–5 days before the picker finds an unlit location and enabling planned replacement during scheduled downtime rather than emergency zone-down response.