Every maintenance manager overseeing cooking kettles and retort sterilizers knows the calculation: one undetected temperature deviation during a retort cycle does not just compromise that batch — it triggers a cascade of product hold, microbiological testing, recall risk, regulatory notification, and brand damage that can cost more than an entire quarter's production margin. The irony is that most of these failures announce themselves hours, sometimes days, in advance — through slow temperature drift across zones, pressure control valve hysteresis that creeps outside calibration norms, F-value accumulation rates that edge below the commercial sterility threshold. The problem is not that the signals are absent. The problem is that conventional monitoring systems were designed to detect deviations after the cycle completes, not to read the convergence of subtle precursor patterns before the batch is compromised. AI-powered temperature distribution, pressure control, and F-value monitoring for cooking kettles and retort sterilizers changes that equation. This is the maintenance manager's guide to deploying it.
AI Temperature Distribution · Pressure Control · F-Value Monitoring · Commercial Sterility Compliance
Maintenance Managers Who Cut Retort Sterilizer Downtime 35%+ Don't React to Temperature Deviations — They See Them Coming Hours Before the Cycle Completes.
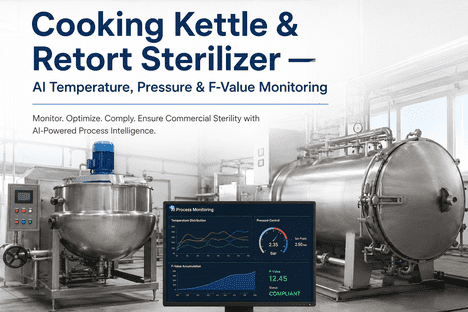
iFactory's AI monitoring platform gives maintenance managers a live virtual view of every cooking kettle and retort sterilizer — with real-time temperature distribution analytics, pressure control loop intelligence, F-value accumulation tracking, and automated commercial sterility compliance documentation.
Reduction in unplanned sterilizer downtime documented in food processing facilities deploying AI-powered predictive temperature and pressure monitoring systems
99.8%
Commercial sterility confidence achieved when real-time F-value monitoring is integrated with AI-driven process control in retort sterilization operations
60%
Faster root cause identification for thermal process deviations when AI correlates multi-zone temperature distribution with pressure control and F-value data
12-24
Months of shelf life extension achievable when retort processes are optimized through continuous AI-driven F-value and temperature distribution analysis
Why Conventional Temperature and Pressure Monitoring Fails Maintenance Managers
Retort sterilization and cooking kettle operation in food processing is classified as a critical control point for one reason: commercial sterility cannot be inspected into the product after the cycle completes. The microbiological safety that makes a retort pouch of ready-to-eat curry or a jar of baby food shelf-stable is created inside the pressure vessel — by temperature profiles that must be held within tight tolerances across the entire load, for precise durations, under controlled pressure conditions that prevent container deformation and ensure uniform heat penetration. Once the cycle ends, the lethality is locked in. Incubation testing can sample it. F-value calculation can verify it. But if the temperature distribution was non-uniform mid-cycle, or the pressure control deviated, the conformance question does not have a satisfactory retrospective answer. The entire batch is suspect.
Conventional monitoring systems handle this by setting alarm limits on individual parameters — thermocouple readings, pressure transducer outputs, cycle timer — and alerting operators when any single parameter crosses a threshold. This is necessary, but it is structurally insufficient. The failure modes that actually produce under-processed retort batches are almost never single-parameter failures. They are multi-parameter convergences: a temperature distribution that is within tolerance but trending toward cold-spot formation, combined with a pressure control valve response time that has slowed since the last calibration and an F-value accumulation rate that is barely meeting the target. No single parameter fires an alarm. But the combination reliably predicts a commercial sterility deviation — if the monitoring system is capable of reading the pattern. AI-powered temperature, pressure, and F-value monitoring is the architecture that makes that pattern readable in real time.
The Five Retort and Cooking Kettle Failure Patterns That Cost Maintenance Managers the Most — and How AI Monitoring Intercepts Each
A
Non-Uniform Temperature Distribution in Multi-Zone Retorts
FDA 21 CFR Part 113 and international food safety regulations require temperature uniformity across the retort load to ensure every container reaches the scheduled lethality. But temperature distribution can degrade between scheduled heat distribution studies due to steam sparger fouling, condensate buildup, air removal system inefficiency, and insulation degradation. The degradation is gradual and invisible to static alarm limits until the cold spot emerges. By then, the batch at risk has already completed its cycle. AI monitoring maintains a continuous real-time temperature distribution model from all zone sensors, flagging uniformity deterioration trajectories before the cold spot produces an under-processed container.
AI fix: Temperature distribution model alerts the maintenance manager to sparger or steam system degradation hours before uniformity limits are breached.
B
Pressure Control Valve Drift and Response Time Degradation
Pressure control in retort sterilization is as critical as temperature control — the overpressure prevents container deformation, ensures proper heat transfer, and maintains process stability. Pressure control valves, transducers, and back-pressure regulators drift over time due to wear, fouling, and calibration drift. A valve that responds 15% slower than its specification during the come-up phase can cause container deformation, seal failure, or temperature overshoot that compromises product integrity. AI monitoring tracks valve response curves, pressure deviation signatures, and transducer drift patterns to predict control degradation before it produces a process deviation.
AI fix: Valve response time and pressure deviation trends trigger predictive maintenance alerts before control degradation compromises a production cycle.
The F0 value — the accumulated lethal heat exposure measured in equivalent minutes at 121.1°C — is the definitive metric of retort sterilization efficacy. Most quality systems calculate F0 retrospectively from the temperature record after the cycle ends. This means the first indication of an under-processed batch arrives after the vessel has been unloaded and the product is in the warehouse. AI-powered F-value monitoring calculates the accumulation rate in real time during the cycle, comparing the actual lethality trajectory against the target lethality curve. When the accumulation rate diverges from the expected profile, the system alerts the maintenance manager with enough time to extend the hold phase, adjust temperature setpoint, or abort and reprocess.
AI fix: Real-time F-value trajectory monitoring provides in-cycle intervention capability — no more discovering under-processed batches after unloading.
D
Steam Supply and Utility System Instability Affecting Come-Up Time
The come-up time — the period from steam admission to the retort reaching the target sterilization temperature — is one of the most sensitive indicators of retort health. Extended come-up times caused by steam supply pressure fluctuations, condensate return system inefficiency, or air removal system degradation directly reduce the effective hold time at sterilization temperature. If the come-up time extends beyond the scheduled process allowance, the F-value accumulated during the hold phase may be insufficient to achieve commercial sterility. AI monitoring tracks come-up time trends, steam consumption patterns, and utility system parameters to forecast steam supply issues before they affect production.
AI fix: Come-up time trend analysis and steam system monitoring give maintenance managers advance warning of utility-side failures that would otherwise interrupt production.
E
Cooling System and Back-Pressure Control Failures During the Cooling Phase
The cooling phase is the most mechanically demanding segment of a retort cycle. Rapid cooling while maintaining positive back-pressure requires precise coordination between cooling water admission, air overpressure control, and condensate removal. Cooling water valve failures, air compressor pressure drops, or condensate pump cavitation during this phase can cause container deformation, seal rupture, or post-process contamination. AI monitoring correlates cooling rate with back-pressure response, detecting developing control failures before they cause package integrity loss.
AI fix: Cooling phase analytics detect back-pressure and cooling coordination failures in real time, protecting package integrity during the most vulnerable process segment.
Temperature Distribution · Pressure Control · F-Value Trajectory · 21 CFR Part 113 Compliance
The Batch That Fails Incubation Testing Announced Its Failure Hours Earlier — in F-Value Accumulation Patterns No Single-Threshold Alarm Was Watching.
iFactory's AI monitoring platform reads the multi-parameter convergence patterns that precede retort sterilization failures — and gives maintenance managers the intervention window to act before the batch is compromised.
How iFactory's AI Monitoring Architecture Works for Cooking Kettles and Retort Sterilizers
The iFactory AI monitoring platform builds a live digital representation of every cooking kettle and retort sterilizer in the plant — its temperature zones, pressure control loops, steam supply system, cooling circuits, cycle recipe history, maintenance state, and calibration status. This representation is not a static model calibrated once at commissioning. It is a continuously updated analytics engine that learns from every cycle run, every maintenance event, and every quality test result. The intelligence that matters for maintenance managers runs across three operational layers.
Layer 01
Real-Time Temperature & Pressure Analytics
Continuous multi-zone temperature distribution and pressure control loop monitoring
Every sensor reading — thermocouple outputs from all retort zones, pressure transducer values, steam flow rates, cooling water temperatures, and valve position feedback — feeds the analytics engine continuously. The platform maintains a real-time temperature distribution model that identifies cold spot formation, hot zone drift, and uniformity degradation patterns that static alarm systems cannot detect. Pressure control loop response curves are analyzed cycle-over-cycle to detect valve wear, transducer drift, and controller tuning degradation. The system flags developing anomalies not because a single threshold was crossed, but because the pattern of measurements across the entire vessel has deviated from what normal looks like for this equipment, this recipe, and this product.
Multi-zone temperature distribution
Pressure loop response analysis
Cycle-over-cycle trend comparison
Layer 02
Live F-Value Accumulation & Sterility Tracking
Real-time lethality calculation with in-cycle intervention alerts
The F-value engine calculates the accumulated lethal effect in real time from the temperature at the container cold spot — the point slowest to heat. The system compares the actual F-value accumulation trajectory against the target lethality curve defined in the scheduled process. If the accumulation rate falls below the target trajectory, the system calculates the additional hold time required to achieve the target F0 and alerts the operator with a recommended extension. For cycles where temperature distribution non-uniformity is detected, the system uses the coldest zone temperature for F-value calculation, ensuring a conservative sterility assessment. Every F-value calculation, trajectory comparison, and intervention decision is logged with full process context for regulatory compliance.
Real-time F0 calculation
Target trajectory comparison
In-cycle hold extension alerts
Layer 03
Predictive Maintenance & Compliance Documentation
Equipment health forecasting and FDA/HACCP-ready audit records
The predictive maintenance engine analyses degradation signatures of every critical retort component — steam control valves, pressure transducers, temperature sensors, air removal systems, cooling water valves, and condensate pumps — using the operational history accumulated in the analytics platform. Valve response time drift, thermocouple calibration drift, pressure transducer zero-offset creep, and steam trap failure patterns are all tracked as leading indicators of failure. The system generates maintenance forecasts with estimated time-to-failure ranges and recommended intervention windows. Every cycle record, deviation alert, maintenance action, and calibration event is automatically logged with full process context for FDA 21 CFR Part 113 compliance, HACCP plan record-keeping, and third-party audit documentation — generated and exportable on demand.
Component degradation tracking
Time-to-failure forecasting
FDA/HACCP audit records
What Maintenance Managers See on the AI Monitoring Dashboard
The maintenance manager's interface is not a retort control panel — it is a process safety and asset health management tool. It is designed to answer the questions that define the maintenance manager's operational responsibility: which retorts have emerging temperature distribution issues, which pressure control valves are degrading, which cycles show F-value accumulation risk, and what the FDA or BRC auditor will see when they review the records.
Dashboard View 01
Fleet Health — All Retorts and Kettles, Live Risk Status
A single-screen view of every cooking kettle and retort sterilizer in the plant showing current operational status, temperature distribution uniformity score, pressure control loop health, F-value accumulation status, and the top-ranked risk factor for any vessel in an elevated state. Maintenance managers see the entire sterilization fleet quality posture in one view — no navigating vessel-by-vessel to assemble a situational picture. Risk levels are colour-coded against the current cycle criticality: the same temperature deviation carries a different risk weight during a low-acid food retort cycle versus a high-acid pasteurization run.
Maintenance manager action: Elevated-risk vessels receive immediate investigation. Green fleet status is a genuine confirmation of controlled processing, not an absence of alarms.
Dashboard View 02
In-Cycle F-Value Trajectory — Live Sterility Forecast
For every active retort cycle, the system displays a real-time F-value accumulation chart comparing the actual lethality trajectory against the target curve from the scheduled process. A cycle whose F-value trajectory falls below the target triggers a maintenance manager alert with the calculated hold time extension required to achieve commercial sterility. The maintenance manager sees the forecast before the cycle completes — with time to act. The system also logs the deviation and the intervention for the regulatory record.
Maintenance manager action: Lagging F-value trajectory during cycle triggers hold extension or process adjustment — batch sterility is assured, not discovered after unloading.
Dashboard View 03
Component Remaining Life — Maintenance Priority Queue
The predictive maintenance view ranks every tracked vessel component by estimated remaining useful life — steam control valves, pressure transducers, temperature sensors, air removal systems, cooling valves, and condensate pumps — with recommended intervention windows expressed in both calendar time and production cycle count. Maintenance managers see not just which components are approaching end of life, but which can be safely deferred to the next scheduled downtime window and which require action before the next production cycle to avoid risk of in-cycle failure.
Maintenance manager action: Schedule maintenance against the prioritised queue during planned downtime. Emergencies drop because the system identifies degradation before it reaches failure.
Dashboard View 04
Temperature Distribution Heat Map — Zone-by-Zone Uniformity
The temperature distribution view presents a colour-coded heat map of every retort zone showing the current temperature relative to the setpoint and the historical uniformity baseline. Cold spots, hot zones, and gradient patterns are immediately visible. The system tracks how the distribution profile changes during the come-up, hold, and cooling phases — flagging developing uniformity issues that could compromise the scheduled process. Historical distribution maps are stored for comparison across cycles, enabling maintenance managers to correlate uniformity degradation with specific equipment changes or maintenance events.
Maintenance manager action: Emerging cold spot detected during hold phase. Steam sparger inspection and air removal system check scheduled for the next planned maintenance window. Book a Demo to see the temperature distribution heat map in action.
Dashboard View 05
Downtime ROI Tracker — Planned vs. Unplanned Maintenance Cost
The ROI dashboard compares the cost of planned maintenance interventions driven by predictive alerts against the historical cost of unplanned failures — in lost production hours, emergency labour premiums, expedited spare part procurement, product hold and testing costs, and customer schedule impact. As predictive maintenance matures over time in the AI monitoring system, this view provides the maintenance manager with the financial case for continued investment: not as a projected benefit, but as a documented operational outcome showing actual unplanned downtime events avoided and their cost equivalent.
Maintenance manager action: Export ROI summary for quarterly business review. The financial case for predictive maintenance builds from the first avoided unplanned failure.
Dashboard View 06
FDA / BRC Audit Readiness — One-Click Documentation Export
The audit readiness view presents a real-time summary of regulatory documentation status: cycle records completed, heat distribution study records current, F-value calculation records verified, deviations documented with corrective actions, and calibration records up to date. When an audit notification arrives, the maintenance manager can export the complete audit package — cycle records, temperature distribution data, F-value calculations, corrective action logs, and equipment calibration history — for any date range, vessel, or product specification the auditor requires. Audit preparation time drops from weeks of manual record assembly to a single export task measured in minutes.
Maintenance manager action: FDA or BRC audit notification received → full documentation package exported same day. No manual record hunting.
"
We had a retort sterilizer that was passing heat distribution studies but producing intermittent F-value shortfalls — not every cycle, and not predictably. By the time we'd investigated after a positive incubation test, the records showed every individual parameter had been within limits, but the AI monitoring data showed a pattern of temperature distribution drift and pressure valve response degradation that had been converging over sixty cycles. We hadn't seen the pattern because we were looking at individual data points, not the multi-parameter correlation. After implementing the AI monitoring platform, the predictive alert flagged the same convergence signature on a second retort before it produced a deviation. We intercepted it during the next scheduled maintenance window, rebuilt the control valve and rebalanced the steam distribution, and avoided a product hold that would have cost more than the platform's entire first year.
— Maintenance Manager, Food Processing Facility — Retort Sterilization and Cooking Kettle Operations, BRC and FDA Registered
The FSMA and FDA 21 CFR Part 113 Landscape: Why AI Monitoring Is Now a Compliance Requirement, Not Just an Efficiency Tool
The regulatory framework for thermally processed low-acid canned foods is evolving. The FDA's Preventive Controls for Human Food rule under FSMA requires food processors to identify and implement preventive controls for hazards that are reasonably likely to occur. For retort sterilization operations, this means the regulatory expectation has moved beyond documenting that the scheduled process was followed — to demonstrating that the process control system is capable of detecting deviations as they develop, intervening before commercial sterility is compromised, and documenting the entire chain of events. AI-powered real-time monitoring, with its continuous temperature distribution analysis, pressure control loop surveillance, and live F-value trajectory tracking, is rapidly becoming the technology that satisfies this heightened regulatory expectation.
For food processing facilities operating under BRC, SQF, or FSSC 22000 certification schemes, the requirement for demonstrated process control capability is equally explicit. The food safety culture and food safety plan elements of these standards require that monitoring systems provide real-time visibility into critical control points, with documented evidence of corrective actions when deviations occur. iFactory's AI monitoring platform is designed to satisfy both requirements simultaneously: the granular cycle documentation that FDA Part 113 and BRC Clause 5 demand, and the predictive process intelligence that regulatory auditors increasingly expect to find.
How Maintenance Managers Calculate AI Monitoring ROI for Cooking Kettles and Retort Sterilizers
The return on investment case for AI-powered temperature, pressure, and F-value monitoring in retort sterilization operates across three cost categories, each independently significant and collectively transformative.
Product Hold & Scrap Cost Reduction
A retort batch product hold is among the most expensive events in food processing. The held product represents raw material cost, processing cost, incubation testing cost, and schedule disruption cost. If the batch is ultimately scrapped, the material must be disposed of and the production time must be re-run. The real-time F-value trajectory monitoring gives maintenance managers the intervention option before the batch is committed — the ability to extend the hold phase to achieve the target lethality, adjust process parameters mid-cycle, or document a deviation with supporting data that may allow a disposition other than scrap. Each batch interception that converts a product hold into a cleared release has a direct, calculable cost value. For most food processing facilities, preventing two to three product holds per year fully justifies the platform cost.
Downtime Cost Elimination
Unplanned retort downtime carries a cost structure disproportionate to the mechanical failure that causes it: lost production hours at vessel utilisation rates of several hundred dollars per hour, emergency maintenance labour at premium rates, expedited spare part procurement, and downstream packaging line starvation that compounds the financial impact. Predictive maintenance that converts unplanned failures to scheduled interventions eliminates the cost premium on all three categories — the same valve rebuild, performed during planned sanitation downtime, costs a fraction of its emergency equivalent. Deployments with 35% reduction in unplanned downtime routinely show annualised savings that exceed platform costs by multiples within the first 12 months.
Audit and Compliance Cost Reduction
FDA inspections, BRC audits, and SQF certification audits require documented evidence of process control across every retort cycle. A finding related to incomplete records, inadequate deviation documentation, or insufficient preventive control evidence can result in a major non-conformance that triggers re-audit costs, corrective action plan development, and — in the worst case — regulatory action that halts production. The AI monitoring platform reduces audit preparation time by automating documentation, reduces audit risk by ensuring continuous process surveillance, and provides the evidence trail that demonstrates a proactive, controlled food safety programme to auditors.
Conclusion
Cooking kettle and retort sterilizer operation is a process where safety outcomes are determined inside the pressure vessel — not discovered by incubation testing after the cycle completes. The maintenance manager who relies on single-parameter threshold alarms and post-cycle F-value calculation to manage process safety is always playing catch-up with deviations that announced themselves hours earlier in patterns no static alarm was watching. AI-powered temperature distribution, pressure control, and F-value monitoring closes this gap by building a live analytics platform that reads multi-parameter convergence patterns, forecasts F-value trajectory in real time, predicts equipment failure before it interrupts production, and generates the complete FDA, HACCP, BRC, and SQF documentation trail automatically.
The evidence from food processing deployments is consistent: 35% or greater reduction in unplanned downtime, 60% faster root cause identification for thermal process deviations, and an audit posture that shifts from reactive documentation to proactive process intelligence that inspectors recognise as a materially stronger compliance position. With FSMA's preventive control requirements and third-party certification standards continuing to raise the bar for demonstrated process control, the maintenance managers who have deployed AI monitoring are already ahead of the compliance curve.
iFactory's AI monitoring platform is designed for maintenance managers who need to eliminate unplanned sterilizer downtime, prevent product holds, and maintain FDA and BRC compliance with a process monitoring system that is as predictive as it is documented. Book a Demo to see the AI monitoring platform configured for your cooking kettle and retort sterilizer fleet, or talk to an expert about a free plant ROI assessment for your food processing operation.
Frequently Asked Questions
The iFactory platform maintains a separate analytics model and historical performance dataset for each retort type, vessel configuration, and recipe combination. Water spray retorts are modelled with their spray distribution patterns and flow rates; steam retorts with their air removal system performance and steam sparger configuration; rotary retorts with agitation speed effects on heat transfer; and water immersion retorts with their water circulation and temperature stratification characteristics. When a new cycle begins, the system identifies the vessel type and recipe and loads the corresponding temperature distribution model, pressure control parameters, and F-value calculation settings. This means the uniformity assessment and lethality forecast are always calibrated against what normal looks like for this specific vessel configuration — not a generalised model that averages across different retort technologies. Talk to an expert about how the platform handles facilities with mixed retort fleets.
The predictive maintenance engine initialises using process historian data and maintenance records from the vessel's operational history — temperature readings, pressure transducer outputs, valve position feedback, steam flow data, and maintenance event logs. A minimum of 6 to 12 months of operational history provides sufficient baseline for initial degradation models on steam control valves and temperature sensors, which are the highest-frequency failure categories in retort systems. Pressure transducer models benefit from 12 to 18 months of data to capture lower-frequency drift patterns. The system deploys in a parallel validation mode first — generating predictive alerts and logging them for maintenance manager review against actual equipment state, without using them to drive autonomous decisions — typically for four to six weeks. This shadow mode period allows the maintenance team to validate forecast accuracy with their own equipment knowledge before relying on the predictions for maintenance scheduling decisions.
iFactory's AI monitoring system captures and retains all the process data fields required by FDA 21 CFR Part 113: vessel identification, scheduled process identification and revision, operator identification, product and container specification, temperature recording throughout the cycle (time-temperature record), pressure recording, F-value calculation data, and any deviations, corrective actions, or hold decisions applied to the cycle. These records are stored in a tamper-evident, time-stamped digital format that satisfies the record control requirements of Part 113 and the traceability requirements of HACCP and BRC standards. The system can be configured as either the primary system of record (replacing paper strip chart recorders and standalone data acquisition systems) or as a supplementary analytics layer that integrates with existing data acquisition infrastructure. The configuration appropriate for your current FDA compliance approach is something our deployment team assesses during the onboarding process. Talk to an expert about the specific regulatory documentation configuration for your facility.
The plant ROI assessment uses five primary inputs from your operation: current annual unplanned downtime hours by vessel and their estimated cost per hour (including lost production, emergency labour, and expedite costs); annual product hold or batch deviation event count and average cost per event (material, testing, and schedule impact); current FDA or BRC audit preparation time in person-hours and estimated cost; current corrective action cycle time and re-occurrence rate for the same deviation categories; and the number of vessels and active product-recipe combinations in scope. From these inputs, iFactory's assessment team models the expected benefit from predictive maintenance (downtime reduction), F-value deviation interception (product hold reduction), and compliance efficiency (audit preparation reduction), with conservative, base, and upside scenarios derived from comparable food processing deployments. The assessment is provided as a structured output that maintenance managers can use directly in capital investment proposals.
The Next Retort Sterilization Deviation Is Already Signalling in Your Process Data. AI Monitoring Sees It. Calculate Your Plant ROI.
iFactory's AI monitoring platform for cooking kettles and retort sterilizers — real-time temperature distribution analytics, pressure control loop intelligence, live F-value trajectory tracking, predictive maintenance forecasting, and FDA/HACCP-ready audit documentation generated automatically from your process data.