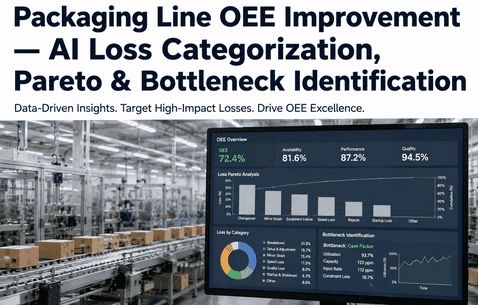
Packaging Line OEE Improvement AI Loss Categorization, Pareto & Bottleneck Identification
By Seren on June 22, 2026
A packaging line running at a nominal speed of 400 containers per minute with 85 percent availability and 98 percent quality produces approximately 200,000 saleable packages per shift. But when the same line operates with unplanned downtime of 47 minutes per shift, speed losses of 12 percent due to micro-stops, and a reject rate of 3.5 percent from print quality or seal defects, the actual output drops to 137,000 packages — a loss of 63,000 packages per shift worth tens of thousands of dollars in unrealized revenue. Most operations teams know their OEE number. Fewer than twenty percent can name the specific losses that make up the gap. Fewer than five percent have a structured, data-driven process for systematically eliminating those losses in priority order. For the Operations Director accountable for line throughput, cost per case, and capital efficiency, the challenge is not that OEE data is unavailable. Almost every packaging line already generates downtime, speed, and reject data through the line management system. The challenge is that the data lives in disconnected silos — PLC logs, operator shift reports, vision inspection databases, and maintenance work order systems — each with its own classification scheme, time base, and reporting frequency. iFactory brings AI-powered loss categorization, automated Pareto analysis, and real-time bottleneck identification to this fragmented data landscape — turning raw line data into a prioritized, actionable loss elimination roadmap that the Operations Director can use to drive measurable OEE improvement week over week.
63,000 Packages Lost per Shift. 95% of Teams Cannot Name Their Top Three Losses. iFactory Closes the OEE Visibility Gap.
iFactory's OEE Analytics platform gives Operations Directors the tools to automatically categorize every loss event across availability, performance, and quality — with AI-powered Pareto analysis that identifies the highest-impact losses and real-time bottleneck detection that shows exactly where to deploy improvement resources for maximum return.
The OEE Data Landscape — Where Loss Visibility Is Made and Where It Is Lost
Every packaging line generates three categories of OEE data — availability, performance, and quality — through multiple data sources. When these data streams are properly integrated, normalized, and analysed, the Operations Director gains a complete, real-time picture of where the line is losing output. When any data stream is incomplete, misaligned, or manually recorded, the OEE calculation becomes unreliable and the loss priorities become guesswork.
Dimension 1
Availability
Planned production time minus unplanned downtime. Includes equipment failures, changeovers, material shortages, and operator breaks.
Common loss: 20-35% hidden downtime
iFactory: Automated downtime categorization
Dimension 2
Performance
Actual running speed relative to rated speed. Includes micro-stops, slow running, and minor speed losses that compound across the shift.
Common loss: 5-20% speed loss
iFactory: Micro-stop & speed loss detection
Dimension 3
Quality
Good output divided by total output. Includes rejects from coding, sealing, labelling, and inspection failures at any station.
Common loss: 1-5% quality reject rate
iFactory: Real-time reject categorization
Dimension 4
Combined OEE
Availability x Performance x Quality. The single metric that captures total line efficiency and drives continuous improvement.
Typical result: 50-70% in packaging
iFactory: World-class OEE dashboards
63,000
Packages lost per shift on a high-speed packaging line operating at typical OEE levels — representing millions in unrealized annual revenue per line
20%
Of operations teams can name their top three OEE losses with confidence — the rest rely on manual shift reports that aggregate downtime into generic categories like "mechanical" or "electrical"
47m
Average unplanned downtime per shift on a typical packaging line — most of which is categorized as "unknown" or "other" in manual reporting systems
3-5%
Sustainable OEE improvement per quarter achievable when losses are properly categorized, Pareto-ranked, and systematically eliminated — compounding to 12-20% annual gain
The Three OEE Data Gaps That Undermine Loss Elimination — and How AI Closes Each One
The gap between raw line data and a prioritized loss elimination roadmap is not a single problem. It is three distinct gaps — each with its own root cause, operational impact, and solution. The Operations Director who addresses all three builds an OEE improvement capability that delivers consistent, measurable results month after month.
The Three OEE Data Gaps and How iFactory Closes Them
Data Gap
What Causes It
Operational Impact
iFactory Solution
Classification Gap
Downtime events are logged with generic codes or free-text entries that cannot be consistently categorized. Different operators use different terms for the same failure.
The Pareto report shows a long tail of "other" or "mechanical" categories. The team cannot identify the top three losses with confidence because the data is too ambiguous to prioritize.
AI-driven event classification that reads free-text downtime entries and PLC alarm codes, then maps each event to standard OEE loss categories using a trained language model.
Time Alignment Gap
PLC timestamps, operator entries, vision system logs, and maintenance work orders use different time bases. Events that occur simultaneously are recorded with different start and end times.
The OEE calculation shows more downtime than the clock confirms. Overlapping events are double-counted. The true root cause of a downtime incident is obscured by misaligned records.
Automated time-series alignment engine that reconciles timestamps across all data sources. Single source of truth for every second of production time with verified event chronology.
Prioritization Gap
Even when data is classified and aligned, the Operations Director receives a flat list of losses without any guidance on which ones to address first or what the expected ROI of elimination would be.
Resources are spread across too many improvement initiatives. The team works on visible problems rather than high-impact ones. OEE improvement stalls because the critical few losses are not identified.
AI-powered Pareto analysis that ranks every loss category by total time impact and computes the OEE uplift available from eliminating each one. Bottleneck detection highlights the station constraining overall line throughput.
The OEE Improvement That Was Hiding in the Classification Data
A North American beverage packaging line operating three high-speed filler-capper combos deployed iFactory's OEE analytics platform across all three lines. During the first week, the AI classification engine analysed six months of historical downtime data and found that 34 percent of all downtime events had been logged under "other" — the largest single category in the Pareto chart. The engine reclassified 82 percent of those events into specific loss categories by analysing free-text operator notes and correlating them with PLC alarm codes. The largest reclassified category was "labeler mis-feed" — accounting for 11 minutes of downtime per shift that had previously been invisible. The Operations Director launched a focused improvement project on the labeler infeed guides. Within 30 days, labeler mis-feed downtime dropped by 70 percent, contributing a 2.3 percentage point improvement in line OEE. The annualized output gain from that single, previously invisible loss category was valued at $340,000 in additional saleable product per line.
The Operations Director's Decision Framework — Which OEE AI Capabilities to Deploy and in What Order
Not all OEE analytics capabilities deliver equal value at all stages of organizational maturity. The Operations Director who sequences deployment correctly builds momentum, confidence, and measurable results at each phase. The director who attempts to deploy everything at once typically sees none of it adopted. The following framework shows the recommended sequence, the KPI that validates each phase, and the operational decision each phase enables.
Phase 1 · Weeks 1-2
Automated Loss Classification First
Deploy AI-driven event classification across all data sources. Every downtime event, speed loss, and quality reject is automatically categorized into standard OEE loss categories. Eliminate the "other" category.
Validation KPI: Classification accuracy >95%
Phase 2 · Weeks 3-4
Pareto Analysis & Prioritization
Implement AI-powered Pareto analysis that ranks every loss category by total time impact and computes the OEE uplift available from elimination. Publish a prioritized loss elimination roadmap.
Validation KPI: Top-3 loss coverage >60%
Phase 3 · Weeks 5-6
Bottleneck Identification
Deploy real-time bottleneck detection that identifies the station constraining overall line throughput. Monitor blockages and starvation events to pinpoint which machine controls the line speed.
Validation KPI: Bottleneck accuracy >90%
Phase 4 · Weeks 7-8
Continuous Improvement Tracking
Configure automated OEE dashboards that track improvement initiatives against baseline loss data. Generate weekly and monthly OEE trend reports with loss category drill-down.
Validation KPI: OEE improvement >3% per quarter
From Manual OEE Reporting to AI-Driven Loss Elimination — What Changes for the Operations Director
The packaging industry is transitioning from manual OEE reporting, where shift data is entered into spreadsheets and reviewed in weekly meetings, to AI-driven loss elimination, where every loss event is automatically categorized, prioritized, and connected to improvement actions. For the Operations Director, this transition changes what is expected of the OEE programme and what the organisation can demand from its packaging lines.
Manual OEE Reporting
Operators log downtime reasons manually at the end of each shift
OEE and losses reviewed weekly in production meetings with stale data
Pareto charts created manually from aggregated shift data
Bottlenecks identified by observation or operator opinion
Improvement initiatives selected by intuition rather than data
Improvement initiatives selected by data-driven priority and tracked to OEE impact
Result: 3-5% quarterly OEE gain, clear priorities, measurable improvement ROI
OEE Analytics · Loss Elimination · Pareto AI · Bottleneck Detection
Manual OEE Reporting Produces Reports. AI-Driven Loss Elimination Produces Results. iFactory Powers the Shift.
From spreadsheets and guesswork to automated loss categorization and prioritized action — iFactory gives Operations Directors the analytics infrastructure to know exactly what is lost, where it is lost, and in what order to fix it. Real-time OEE dashboards, AI-powered Pareto analysis, and bottleneck identification that connect loss data directly to measurable OEE improvement.
The gap between the OEE data that every packaging line generates and the prioritized loss elimination roadmap that every operations team needs is not a technology gap. It is a visibility gap — and it closes when Operations Directors deploy the right sequence of capabilities: automated loss classification first, Pareto analysis and prioritization second, bottleneck identification third, and continuous improvement tracking fourth. Each phase builds on the one before. Each phase delivers measurable OEE improvement that funds the next.
iFactory's OEE Analytics platform gives Operations Directors the complete toolkit for this sequence — AI-powered loss categorization across availability, performance, and quality dimensions, automated Pareto analysis that ranks every loss by impact, real-time bottleneck detection that identifies the constraint station, and continuous improvement dashboards that track OEE uplift week over week. Book a Demo to see how the platform maps to your packaging line configuration and OEE improvement targets, or Talk to an Expert to discuss your operation's loss elimination maturity pathway.
Frequently Asked Questions
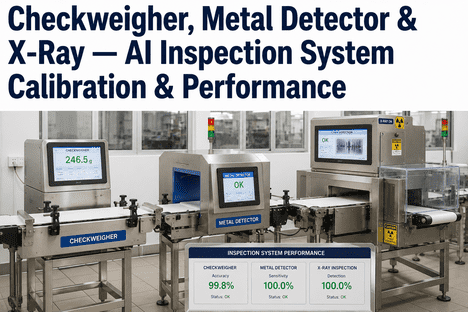
iFactory integrates through standard industrial protocol connectors including OPC-UA, Modbus TCP, EtherNet/IP, and Siemens S7, supporting the most common packaging line controllers from Rockwell, Siemens, Schneider, B&R, Beckhoff, and Mitsubishi. The platform reads machine state data, production counts, reject signals, and alarm logs directly from the PLC without requiring changes to existing control logic. Additionally, iFactory connects to vision inspection systems, checkweighers, metal detectors, and labelers through their native interfaces to capture quality reject data. For data sources that lack direct connectivity, the platform accepts CSV, SQL database, and API-based data feeds from line management systems and manufacturing execution platforms. Talk to an Expert to discuss your specific line integration landscape and data source inventory.
The AI classification engine uses a natural language processing model trained on hundreds of thousands of downtime entries from packaging operations across multiple industries. It reads free-text entries such as "jammed at the starwheel" or "wrapper film broke again" and maps them to standard OEE loss categories with an accuracy above 95 percent. The model is also trained on PLC alarm codes, converting numerical alarm IDs into plain-language loss descriptions. When the model encounters an entry it cannot classify with confidence, it flags the event for human review and uses the correction to improve future classifications. The engine continuously learns from operator corrections and new alarm patterns, reducing the "other" category to less than five percent of total downtime within the first three weeks of deployment. Talk to an Expert to see a live demonstration of the classification engine using your actual downtime data.
For multi-machine packaging lines — such as a configuration with a filler, capper, labeler, coder, and case packer in sequence — iFactory calculates OEE at both the individual machine level and the overall line level. The platform tracks blocking and starvation events between machines to understand how each station's performance affects the others. For overall line OEE, the calculation uses the output of the last machine in the line as the good count, the speed of the constraint station as the performance reference, and the total time any station in the line is stopped as the availability basis. This multi-level OEE view enables the Operations Director to see not just what the line produced, but exactly which machine was the constraining factor at every moment of the shift. Talk to an Expert to discuss OEE calculation configuration for your specific line layout and material flow.
For a multi-line packaging operation with three to ten lines, the standard four-phase sequence completes within eight weeks. Phase one — automated loss classification — is operational within the first week after PLC and data source connections are established, with categorized OEE data visible within days of pipeline validation. Phase two Pareto analysis and prioritization activates in weeks three to four after sufficient classified loss data has accumulated. Phase three bottleneck identification begins generating real-time constraint insights in weeks five to six. Phase four continuous improvement tracking dashboards are configured and operational by weeks seven to eight. The first Operations Director-level OEE dashboard with loss category drill-down is typically available within the first 14 days. Deployment timelines for operations with highly customized line configurations or legacy PLC systems may extend by one to two weeks for additional integration work. Talk to an expert to build a deployment timeline specific to your line count, control system landscape, and data source complexity.
63,000 Packages Lost per Shift. 95% of Teams Cannot Name Their Top Three Losses. iFactory Exists to Close the OEE Visibility Gap.
The only OEE analytics platform built for Operations Directors — automated loss categorization, AI-powered Pareto analysis, real-time bottleneck identification, and continuous improvement tracking. The intelligence between your line data and the OEE improvement that drives your profitability.