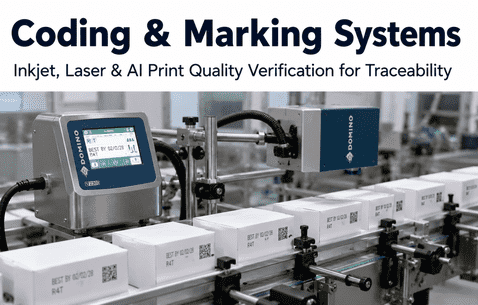
Coding & Marking Systems Inkjet, Laser & AI Print Quality Verification for Traceability
By Seren on June 22, 2026
A high-speed packaging line running continuous inkjet printers at 600 containers per minute generates more than 864,000 individual code applications every shift. Each lot code, expiry date, and barcode must be legible, accurately positioned, and machine-readable at every stage of the supply chain. When a printhead nozzle clogs, a single missing dot in a Data Matrix code renders the entire code unreadable. When a laser marking head drifts out of focus by 0.3 millimetres, the mark contrast drops below the barcode scanner's detection threshold. When the ink viscosity shifts by two centipoise due to ambient temperature change, the character height varies by 0.15 millimetres and the code falls outside GS1 print quality grade C. For the Reliability Engineer accountable for line OEE, print quality compliance, and code verification system uptime, the coding and marking zone represents a convergence of fluid dynamics, laser optics, and print verification variables that generate more than fifteen percent of all packaging-line quality deviations and supply chain non-compliance events. iFactory brings AI-driven print quality verification, predictive maintenance on printheads and laser sources, and real-time code readability scoring to this critical zone — turning the coding station from a recurring compliance risk into a managed print quality process.
864,000 Codes per Shift. One Missing Dot Can Stop a Production Line. iFactory Brings AI Print Quality Assurance to Coding & Marking.
iFactory's Packaging Line AI platform gives Reliability Engineers the tools to monitor inkjet and laser coding systems, verify print quality in real time, and predict maintenance needs before a code failure triggers a line stoppage or a supply chain non-compliance event.
The Coding & Marking Process — Where Print Quality Is Made and Where It Is Lost
Every code applied to a package depends on a four-stage process. When each stage performs correctly, the line produces legible, machine-readable codes that meet GS1 and regulatory standards at the rated line speed. When any stage degrades, the entire coding output becomes suspect. The Reliability Engineer who understands this process controls the print quality of every code leaving the line.
Stage 1
Ink Delivery & Printhead
Ink is delivered at controlled viscosity and pressure to the printhead. The nozzle ejects droplets at precise frequency and trajectory onto the passing substrate.
Failure risk: Nozzle clogging & misdirection
iFactory: Real-time jetting profile monitoring
Stage 2
Laser Marking
A focused laser beam removes or discolours the substrate surface layer to create the code. Pulse energy, frequency, and focus determine mark quality.
Failure risk: Power drift & focus shift
iFactory: Laser energy & contrast monitoring
Stage 3
Print Verification
Vision cameras capture each code immediately after application and compare it against the expected pattern, checking for missing dots, character integrity, and position.
Failure risk: False rejects & missed defects
iFactory: AI-driven code quality grading
Stage 4
Data Relay & Traceability
Verified codes are uploaded to the line management system along with timestamps, production data, and verification results for full supply chain traceability.
Failure risk: Data integrity gaps
iFactory: Traceability audit trail & dashboards
15%
Of all packaging-line quality deviations and supply chain non-compliance events originate at the coding and marking station — the single largest source of traceability failure
0.3mm
Laser focus drift that reduces mark contrast below the barcode scanner's detection threshold — enough to render a Data Matrix code unreadable at any point in the supply chain
2cP
Ink viscosity shift that alters character height by 0.15mm — enough to drop a code below GS1 print quality grade C and trigger a retailer compliance fine
600
Containers per minute on a high-speed line — a printhead nozzle failure of three seconds means 30 unreadable codes before the verification system generates a reject
The Three Print Quality Failure Modes That Undermine Code Legibility — and How AI Closes Each One
The gap between a properly maintained coding station and one producing unreadable codes is not a single problem. It is three distinct failure modes — each with its own root cause, quality impact, and solution. The Reliability Engineer who addresses all three builds a coding operation that delivers consistent, audit-ready print quality at rated line speed.
The Three Code Quality Failure Modes and How iFactory Closes Them
Failure Mode
What Causes It
Quality Impact
iFactory Solution
Missing Dots & Streaks
Nozzle clogging, ink starvation, air entrapment in the ink line, or degraded piezo drive signals cause individual jets to misfire or cease firing entirely.
Data Matrix codes with missing elements fail verification. Lot codes with incomplete characters are rejected by scanner systems downstream. The code is unreadable at any point in the supply chain.
Real-time jetting waveform monitoring with per-nozzle drop velocity tracking. AI pattern recognition identifies partial clogging 15 minutes before the nozzle fails completely. Automated purge cycle triggers.
Poor Contrast & Legibility
Ink viscosity variation, substrate surface energy changes, incorrect cure distance, laser power degradation, or focus drift reduce the optical contrast between the mark and the background.
Codes that are visible to the human eye but fail machine readability standards. Barcode scanners cannot decode the data. GS1 grade drops below C. Retailers reject the shipment on arrival.
AI-based contrast and edge sharpness scoring per code. Laser energy and focus monitoring with trend analysis. Ink viscosity and temperature correlation dashboard with automated adjustment triggers.
Misplaced & Skewed Codes
Encoder signal drift, conveyor timing variation, printhead mounting vibration, or laser galvo calibration drift cause codes to be applied at the wrong position or at an angle.
Codes positioned outside the scanner window or overlapping package seams, barcodes, or other printed elements. The code exists but cannot be read because it is not where the scanner expects it.
Encoder signal integrity monitoring with position deviation alerts. Printhead and laser mounting vibration analysis. Automated position verification against the expected code location per container type.
The Compliance Fine That Was Avoided by Monitoring Ink Viscosity
A European pharmaceutical contract packager operating seven CIJ coding lines deployed iFactory's print quality monitoring platform across its primary packaging operation. During the second week of deployment, the platform detected a gradual increase in ink viscosity on line four — a shift of 1.8 centipoise over six hours caused by a failing make-up solvent pump that was delivering solvent at a reduced rate. The AI model correlated the viscosity trend with a 12 percent decrease in the code contrast score and generated a predictive maintenance alert. The Reliability Engineer replaced the pump during the scheduled lunch break. Total downtime: 23 minutes. Estimated avoidable cost: £47,000 in potential compliance fines from unreadable lot codes on a high-value oncology product batch that was scheduled for release that afternoon. The Reliability Engineer noted that without the real-time viscosity monitoring and contrast scoring, the degraded codes would have passed the visual inspection check and been detected only when the shipment arrived at the distributor's receiving dock.
The Reliability Engineer's Decision Framework — Which Coding & Marking AI Capabilities to Deploy and in What Order
Not all coding and marking AI capabilities deliver equal value at all stages of line maturity. The Reliability Engineer who sequences deployment correctly builds momentum, confidence, and measurable results at each phase. The engineer who attempts to deploy everything at once typically sees none of it adopted. The following framework shows the recommended sequence, the KPI that validates each phase, and the operational decision each phase enables.
Phase 1 · Weeks 1-2
Print Quality Baseline First
Deploy AI-based print quality scoring on every code. Every code that scores below the GS1 grade C threshold is flagged automatically. The goal is 100% code readability within the verification window within the first 14 days.
Validation KPI: Code readability >99.5%
Phase 2 · Weeks 3-4
Printhead & Laser Health Monitoring
Implement real-time monitoring of printhead jetting performance, ink viscosity and pressure, laser energy output, and focus stability. Generate automated alerts when any parameter deviates beyond the configured tolerance band.
Validation KPI: Printhead uptime >99%
Phase 3 · Weeks 5-6
Predictive Maintenance Triggers
Configure risk-based thresholds on nozzle health, ink system components, laser source degradation, and encoder integrity. Generate work orders automatically when degradation exceeds defined levels.
Validation KPI: Predictive alert accuracy >85%
Phase 4 · Weeks 7-8
Automated Quality Optimization
Enable AI-driven print parameter adjustment based on substrate material, ambient conditions, and line speed. Deploy closed-loop control that maintains optimal print quality without operator intervention.
Validation KPI: First-pass code acceptance >99.8%
From Reactive Code Inspection to Predictive Print Quality Management — What Changes for the Reliability Engineer
The packaging industry is transitioning from reactive code inspection, where codes are checked after they are printed and rejects are removed downstream, to predictive print quality management, where AI monitors every coding parameter continuously and generates maintenance triggers before a defect occurs. For the Reliability Engineer, this transition changes what is expected of the coding station and what the organisation can demand from its traceability system.
Reactive Code Inspection
Codes are inspected after printing — defects are detected downstream
Printhead cleaning is performed on a fixed shift schedule
Ink viscosity checked manually once per shift with a viscometer cup
Laser source power verified during annual PM only
Verification system generates alerts, but root cause analysis is manual
Operational cost: Scrap, rework, compliance fines, lost traceability
Predictive Print Quality Management
AI detects print quality degradation 30 minutes before a code becomes unreadable
Printhead cleaning triggered by nozzle health monitoring, not a timer
Continuous real-time viscosity monitoring with automated trend alerts
Laser energy and focus monitored continuously — replacement scheduled before failure
AI correlates verification failures with print parameters — root cause identified instantly
From catching defective codes to preventing them — iFactory gives Reliability Engineers the analytics infrastructure to monitor every printhead, every laser source, and every code in real time. AI-driven print quality scoring, printhead health monitoring, and predictive maintenance triggers that turn the coding station into a managed print quality process.
The coding and marking station represents the most compliance-sensitive zone on any packaging line. With more than 15 percent of packaging quality deviations and supply chain non-compliance events tracing back to unreadable or missing codes, and line speeds pushing past 600 containers per minute, the Reliability Engineer who treats the coding station as a black box is accepting scrap rates, compliance fines, and traceability gaps that are entirely preventable. The gap between a properly maintained coding station and one producing unreadable codes is not a technology gap. It is a visibility gap — and it closes when engineers deploy the right sequence of capabilities: print quality baselining first, printhead and laser health monitoring second, predictive maintenance triggers third, and automated quality optimization fourth. Each phase builds on the one before. Each phase delivers measurable results that fund the next.
iFactory's Packaging Line AI platform gives Reliability Engineers the complete toolkit for this sequence — real-time print quality scoring with AI verification, printhead and laser health monitoring, predictive maintenance triggers on coding components, and automated quality optimization that maintains code readability at rated line speed. Book a Demo to see how the platform maps to your coding and marking line configuration and production targets, or Talk to an Expert to discuss your packaging operation's print quality management maturity pathway.
Frequently Asked Questions
iFactory integrates through standard industrial protocol connectors including OPC-UA, Modbus TCP, and EtherNet/IP, supporting the most common coding platforms from Videojet, Domino, Markem-Imaje, Linx, Hitachi, REA JET, and ID Technology as well as laser marking systems from Keyence, Trotec, FOBA, and Rofin. The platform reads printhead status, ink pressure and viscosity, laser energy output, encoder signals, and verification camera results without requiring changes to existing coder PLC logic. For lines with vision verification systems from Cognex, Keyence, Omron, or SICK, iFactory ingests code quality data directly to correlate read rates with print parameters. Talk to an Expert to discuss your specific coding system integration requirements.
The platform tracks a comprehensive set of quality metrics per code at full line speed. For inkjet codes, metrics include per-nozzle jetting status, character completeness and edge sharpness, dot placement accuracy relative to the expected matrix, contrast ratio between the ink and the substrate, character height and width against specification, and overall GS1 print quality grade. For laser marks, the platform tracks mark contrast and colour, edge definition, power density at the marking plane, marking depth consistency, and positional accuracy relative to the registration target. Each code receives an overall quality score from zero to 100 percent. Codes scoring below the configurable threshold are flagged in the print quality dashboard with the specific defect type and suspected root cause. Talk to an Expert to configure the quality scoring parameters for your specific code types and substrates.
Yes. iFactory is coding-technology-agnostic at the analytics layer. Whether your line uses continuous inkjet, thermal inkjet, drop-on-demand, laser marking, or thermal transfer overprinting — or any combination — the platform ingests data from each coder type through its respective interface and normalizes the data into consistent quality metrics. The print quality dashboard displays performance separately by technology type, enabling the reliability team to identify whether quality drift is technology-specific, such as an ink formulation issue affecting all CIJ printers, or machine-specific, such as a failing laser source on a single marking station. This technology-aware visibility is critical for directing maintenance resources to the correct root cause rather than treating every quality deviation as an isolated code problem. Talk to an expert to see how the platform handles mixed-technology coding environments with a live demonstration using your line's data profile.
For a multi-line packaging operation with three to twelve coding stations, the standard four-phase sequence completes within eight weeks. Phase one — print quality baselining — is operational within the first week after coder interface connection, with the first code quality scores visible within hours of pipeline validation. Phase two printhead and laser health monitoring activates in weeks three to four after baseline quality data is correlated with coder parameters. Phase three predictive maintenance triggers begin generating alerts in weeks five to six after sufficient degradation pattern data has accumulated. Phase four automated quality optimization is configured and operational by weeks seven to eight. The first reliability engineer KPI dashboard is typically available for operational review within the first 14 days. Deployment timelines for operations with multiple coder technologies — CIJ, TIJ, and laser — may extend by one to two weeks for additional interface validation. Talk to an expert to build a deployment timeline specific to your line count, coder types, and code complexity.
864,000 Codes per Shift. One Missing Dot Can Trigger a Compliance Fine. iFactory Exists to Close the Print Quality Visibility Gap.
The only coding and marking analytics platform built for Reliability Engineers — real-time print quality scoring, printhead and laser health monitoring, predictive maintenance triggers, and automated quality optimization. The intelligence between your coding station and the traceability that protects your brand.