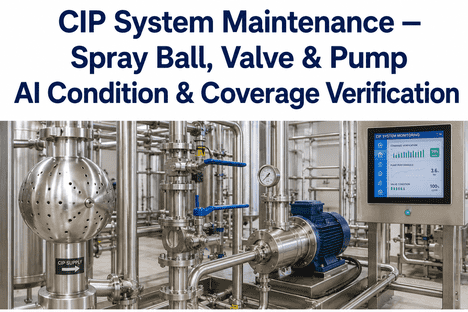
CIP System Maintenance Spray Ball, Valve & Pump AI Condition & Coverage Verification
By Seren on June 24, 2026
In food, beverage, pharmaceutical, and dairy manufacturing, CIP system equipment spray balls, valves, pumps, heat exchangers, and instrumentation is the physical infrastructure that delivers validated sanitation. When a spray ball develops clogged orifices, a valve seat wears and permits chemical bypass, a pump impeller erodes and reduces flow, or a flow transmitter drifts out of calibration, the CIP system may appear to operate normally on the control screen while actually delivering incomplete cleaning coverage. Maintenance managers responsible for CIP system reliability face the challenge of monitoring distributed equipment often across multiple vessels, loops, and production lines where equipment condition directly affects food safety, product quality, and regulatory audit outcomes. AI-driven CIP equipment monitoring platforms ingest real-time sensor data from spray ball coverage indicators, valve position feedback, pump VFD telemetry, flow transmitters, and conductivity probes to detect equipment degradation 1–3 weeks before it compromises cleaning effectiveness reducing unplanned CIP downtime by 40–60 % and extending mean time between maintenance interventions. iFactory AI's platform, including its Shift Logbook and equipment condition monitoring engine, enables maintenance managers to track spray ball coverage, valve seal integrity, pump performance, and CIP instrumentation health from a single dashboard without replacing existing CIP skid hardware or control systems. Book a Demo to see how iFactory delivers AI-driven CIP equipment condition monitoring for hygienic manufacturing operations.
CIP Equipment · AI Condition Monitoring · 2026
CIP System Maintenance Spray Ball, Valve & Pump AI Condition & Coverage Verification
Prevent cleaning failures from degraded CIP equipment. AI-driven spray ball coverage verification, valve seal integrity monitoring, pump performance trending, and instrumentation health tracking — all in iFactory Shift Logbook.
Why CIP Equipment Condition Monitoring Matters for Maintenance Managers
CIP systems are not single assets — they are distributed networks of interconnected equipment that must function together to deliver validated cleaning. A spray ball with 15 % of orifices clogged by hard-water scale, a butterfly valve with a worn PTFE seat allowing caustic bypass, a centrifugal pump operating 12 % below its original BEP (best efficiency point) due to impeller erosion, and a conductivity probe that drifted 0.3 mS/cm since last calibration — any single one of these degradations can produce an incomplete CIP cycle that the control system logs as "cycle complete within parameters" while the equipment surface remains inadequately cleaned. Maintenance managers responsible for CIP system reliability must monitor equipment that is physically distributed across multiple production areas, often visible only during CIP cycles when tanks are empty and access ports are open. AI-driven condition monitoring closes this gap by analysing sensor data from existing CIP instrumentation to detect equipment degradation trends 1–3 weeks before they produce cleaning failures — converting reactive CIP equipment repairs into planned maintenance interventions with full audit trail documentation. The 2026 trend in hygienic maintenance confirms that AI-monitored CIP equipment programmes reduce unplanned CIP downtime by 40–60 % and extend mean time between maintenance interventions by 30–50 % through early detection of spray ball fouling, valve seat wear, pump degradation, and instrument drift.
01
Spray Ball Coverage
Clogged orifices, scale buildup, and broken spray ball arms reduce cleaning coverage. AI monitors return flow, pressure drop, and temperature distribution to detect coverage degradation before swab results show incomplete cleaning.
Detection lead: 1–2 weeks
02
Valve Seal Integrity
Worn valve seats, damaged seals, and actuator drift permit chemical bypass between CIP loops and product circuits. AI analyses valve position feedback, seat leakage current, and downstream conductivity to detect bypass events.
Detection lead: 2–3 weeks
03
Pump Performance
Impeller erosion, wear ring degradation, and cavitation damage reduce pump flow output and energy efficiency. AI monitors VFD current, flow vs head curve deviation, and vibration signature to classify pump health.
Detection lead: 2–4 weeks
04
Instrument Health
Conductivity probe drift, temperature sensor bias, and flow transmitter fouling produce false CIP parameter readings. AI cross-checks redundant sensors and detects calibration drift before it affects CIP validation records.
Detection lead: 1–3 weeks
Three Ways CIP Equipment Degradation Causes Cleaning Failures
A
Incomplete Chemical Coverage
When spray ball orifices are partially clogged — common with hard-water scale in dairy, starch residue in food, or protein buildup in pharmaceutical CIP — the cleaning solution does not reach all product-contact surfaces. The control system records correct chemical concentration and temperature at the supply line, but the return conductivity curve shows a delayed or flattened response indicating incomplete surface contact. iFactory detects this pattern by analysing return conductivity slope, temperature uniformity across tank wall sensors, and flow rate consistency across the spray device. A clogged spray ball produces a characteristic signature: supply parameters within specification but return conductivity rise time extended by 25–50 % compared to a clean ball baseline.
B
Chemical Bypass & Dilution
Worn valve seats — particularly in double-seat mix-proof valves common in dairy CIP circuits — allow cleaning chemical to bypass into adjacent product circuits or drain to waste before completing its contact time. The control system records chemical concentration at the supply point, but the actual concentration reaching the target vessel is lower due to bypass dilution. iFactory monitors downstream conductivity in each CIP circuit segment, valve position feedback deviation, and seat leakage sensor current to detect bypass events. A valve with 0.5 mm seat wear can bypass 5–8 % of the cleaning solution — reducing effective chemical concentration below the validated minimum.
C
Insufficient Flow Velocity
Pump impeller erosion, wear ring gap increase, and partial cavitation damage reduce pump flow output, potentially dropping below the turbulent flow threshold (Re < 10 000) required for effective CIP. A centrifugal pump operating 15 % below its original best efficiency point may still produce acceptable flow for thin soils but fail to deliver turbulent shear for baked-on or biofilm soils. iFactory monitors VFD speed vs actual flow correlation, pump differential pressure, and motor current signature to detect performance degradation trends. The Shift Logbook captures operator observations — visible flow changes at spray devices, unusual pump noise, intermittent cavitation — alongside automated performance data.
Spray Ball Coverage Verification — From Visual Inspection to Continuous AI Monitoring
Spray ball coverage verification has traditionally relied on manual visual inspection during CIP cycles — operators observing spray patterns through sight glasses or access ports — combined with periodic Riboflavin coverage tests during validation re-qualification. Both methods provide point-in-time snapshots that miss gradual degradation between inspection events. A spray ball that loses spray pattern coverage gradually — from 100 % coverage at installation to 85 % after 18 months of hard-water operation — will produce incomplete cleaning for months before the next scheduled inspection catches it. iFactory's AI-driven coverage verification replaces point-in-time inspection with continuous monitoring of three indirect coverage indicators: return conductivity curve shape (clean balls produce a sharp, rapid rise in return conductivity as soil is removed; clogged balls produce a shallow, extended rise), temperature distribution across vessel wall sensors (uniform heating indicates uniform coverage), and flow rate consistency across the spray device (flow variation exceeding 10 % indicates partial clogging). The platform alerts maintenance managers when coverage indicators cross the 85 % threshold — providing 1–2 weeks of lead time before incomplete cleaning produces a swab failure.
CIP Equipment
Traditional Monitoring
AI Condition Monitoring
Spray Ball Coverage
Quarterly visual inspection via sight glass · annual Riboflavin test
Continuous VFD vs flow correlation · differential pressure · motor current signature
Instrument Calibration
Annual or bi-annual external calibration
Continuous cross-sensor comparison · drift trending · auto calibration alert
Map Your CIP Equipment Condition Monitoring Programme in a 90-Minute Session
iFactory AI's hygienic maintenance practice runs a focused assessment against your specific CIP equipment population, existing sensor coverage, CMMS configuration, and maintenance intervals. You leave with a defended monitoring deployment plan, a 6-week rollout timeline, and a quantified unplanned downtime reduction projection.
Valve Condition Monitoring — Detecting Seat Wear and Chemical Bypass
Valves are the most numerous mechanical components in CIP systems — mix-proof valves, butterfly valves, ball valves, and check valves that isolate CIP circuits from product circuits, divert flow between vessels, and control chemical dosing. Valve seat wear is the dominant failure mode: PTFE, EPDM, and HNBR seals gradually erode from repeated thermal cycling (70 °C caustic followed by 20 °C rinse), chemical attack (acid and caustic concentration exposure), and mechanical cycling (1000–5000 cycles per year depending on production schedule). A worn valve seat that permits 2–5 % chemical bypass may go undetected for months because the CIP control system records chemical concentration at the supply manifold, not at the individual vessel. iFactory's valve condition monitoring analyses three data streams: valve position feedback deviation (actual vs commanded position), seat leakage sensor current (where installed), and downstream conductivity in each CIP loop segment. When downstream conductivity shows elevated levels during rinse phases — indicating chemical bypass through a leaking seat — the platform alerts maintenance managers with a specific valve tag, estimated leak rate, and recommended intervention window. The Shift Logbook captures the complete valve maintenance history — seat replacement dates, leak test results, and cumulative cycle count — alongside the real-time monitoring stream for full traceability.
Continuous
Spray ball coverage indicators
Return conductivity rise slope & peak value
Vessel wall temperature uniformity
Spray device flow rate vs baseline
Return turbidity curve shape
CIP cycle completion time trend
These indirect indicators correlate strongly with spray ball coverage. AI models trained on clean vs clogged ball data detect coverage degradation 1–2 weeks before swab results confirm incomplete cleaning.
Eliminate
Manual spray ball inspection rounds
Monthly visual spray pattern checks
Annual Riboflavin coverage tests
Paper-based coverage inspection logs
Reactive spray ball cleaning only after swab failure
Spreadsheet-based inspection scheduling
Replaced by continuous AI coverage monitoring. 80–90 % reduction in manual inspection effort with coverage verification for every CIP cycle instead of quarterly point-in-time snapshots.
Predictive
Proactive valve seat replacement scheduling
Valve-specific wear rate trending
Condition-based seat replacement window
Leak rate quantification from downstream conductivity
Automated CMMS work order at replacement threshold
Predictive valve maintenance eliminates fixed-interval seat replacement. Instead of replacing every seat annually, replace only worn seats at the exact intervention window — reducing valve maintenance cost while preventing chemical bypass events.
Replace
Reactive pump repairs after failure
Emergency pump rebuild after total failure
Production stoppage awaiting CIP return to service
Expedited parts ordering at premium cost
Unplanned overtime for emergency maintenance
Lost production from extended CIP downtime
AI performance trending replaces reactive pump repairs with planned interventions. Pump degradation detected 2–4 weeks before failure enables scheduled rebuild during planned production downtime.
Want this condition monitoring framework applied to your specific CIP equipment population? Book a Demo to walk through every CIP equipment class, sensor coverage gap, and maintenance interval on your lines.
The Business Case for AI-Driven CIP Equipment Monitoring
Maintenance managers deploying AI-driven CIP equipment condition monitoring report measurable improvements in the first two quarters of operation — reduced unplanned CIP downtime, extended mean time between maintenance interventions, lower spare parts consumption, and improved regulatory audit outcomes through continuous equipment condition documentation.
−40–60 %
Unplanned CIP equipment downtime
AI detects spray ball clogging, valve seat wear, pump degradation, and instrument drift 1–4 weeks before failure. Emergency CIP repairs shift to planned maintenance during scheduled production downtime.
+30–50 %
Mean time between maintenance interventions
Condition-based maintenance replaces fixed-interval replacement. Spray balls cleaned only when coverage indicators degrade, valve seats replaced only when leak rate exceeds threshold, pumps rebuilt only when performance drops below BEP.
−50–70 %
CIP-related product quality deviations
Early detection of coverage loss, chemical bypass, and flow degradation prevents incomplete cleaning events that produce microbial contamination, allergen carryover, or biofilm formation.
6–9 mo
Typical ROI payback period
Full investment recovery through unplanned downtime reduction, spare parts optimisation, and CIP cycle reliability improvement — with continuous equipment condition documentation supporting regulatory audit readiness.
Three Deployment Paths — From Reactive to AI-Driven CIP Equipment Monitoring
Same starting point, three valid destinations. The right path depends on current CIP equipment monitoring maturity, existing sensor coverage, CMMS configuration, and maintenance team capability. Plants that pick the wrong path spend 12 months cycling between point solutions. Plants that pick the right path deploy in 6–10 weeks.
Path A
Monitor — Detect — Alert
4–6 weeks
iFactory connects to existing CIP skid PLC and sensor data. AI models begin monitoring spray ball coverage indicators, valve position feedback, pump VFD telemetry, and instrument health. Alerts generated when any equipment class crosses degradation threshold. Shift Logbook provides the unified equipment status view.
Best fit
Teams with existing CIP sensors · need visibility into equipment condition · no current condition monitoring capability · 50+ spray balls or 100+ CIP valves
Wk 1–2 CIP equipment & sensor audit
Wk 3–4 AI model training + baseline
Wk 5–6 Alert configuration + go-live
Path B
Monitor + Predict + Schedule
6–8 weeks
Full AI condition monitoring deployed with predictive degradation trending for spray ball, valve, and pump equipment classes. Automated CMMS work orders generated at condition-based intervention thresholds. Shift Logbook captures operator observations alongside automated monitoring data.
Best fit
Teams with existing CMMS · maintenance planner capacity for predictive scheduling · 200+ CIP equipment assets · need for audit-ready condition documentation
Wk 1–3 Full equipment census + tagging
Wk 4–6 Predictive model deployment
Wk 7–8 CMMS integration + live alerts
Path C
Full Autonomous CIP Equipment Reliability
8–10 weeks
Complete AI-driven CIP equipment reliability programme. All CIP equipment classes continuously monitored. Predictive degradation models for every asset type. Automated work order creation with prioritisation based on cleaning criticality. Shift Logbook provides single-pane equipment condition view across all production lines and facilities.
Best fit
500+ CIP equipment assets · multiple production lines or facilities · zero current condition monitoring · strategic CIP reliability transformation goal
Wk 1–4 Full fleet assessment + sensor gap analysis
Wk 5–8 Parallel deployment on 2 pilot lines
Wk 9–10 Fleet-wide rollout + reliability baseline
Find Your CIP Equipment Monitoring Path in a 90-Minute Workshop
iFactory AI's hygienic maintenance practice runs a focused workshop against your specific CIP equipment population, existing sensor coverage, CMMS configuration, and maintenance team capability. You leave with a defended path recommendation, a 6-week deployment plan, and an unplanned downtime reduction projection grounded in your plant's current equipment reliability data.
Expert Perspective — What Maintenance Teams Miss in CIP Equipment Monitoring
"The most common gap I see in CIP equipment reliability programmes is the assumption that because the CIP control system logs 'cycle complete within parameters,' the equipment actually delivered cleaning solution to all product-contact surfaces. Parameter logging at the supply manifold tells you what the system intended to deliver — not what actually reached the vessel walls. A spray ball with 30 % clogged orifices can still produce acceptable supply-side readings while leaving 15 % of the vessel surface inadequately cleaned. Maintenance teams that deploy indirect coverage monitoring — return conductivity curve analysis, temperature uniformity trending, flow consistency tracking — catch equipment degradation weeks before it produces a swab failure. The teams that rely on quarterly visual inspections and annual Riboflavin tests are accepting 3–12 months of incomplete cleaning between detection events. In hygienic manufacturing, that gap is the difference between a routine maintenance intervention and a product recall investigation."
Can iFactory monitor spray ball coverage without installing additional sensors inside the vessel?
Yes. iFactory's AI models detect spray ball coverage degradation using indirect indicators from sensors already installed in most CIP systems — return conductivity trace (the rate of conductivity rise during the cleaning phase correlates with coverage uniformity), vessel wall temperature sensors (uniform temperature distribution indicates uniform coverage), and supply flow rate (flow variation exceeding 10 % of baseline indicates partial clogging). For vessels without any installed sensors, low-cost wireless temperature sensors can be added to vessel exterior surfaces during scheduled maintenance — typically 4–6 sensors per vessel providing sufficient spatial resolution for coverage verification.
How does iFactory detect valve seat wear before it causes a cleaning failure?
iFactory monitors three indicators of valve seat condition. First, valve position feedback deviation — comparing actual valve position to commanded position; worn seats cause slight positional drift as sealing surfaces compress. Second, downstream conductivity in each CIP loop segment during rinse phases; elevated conductivity during rinse indicates chemical bypass through a leaking seat. Third, seat leakage sensor current where installed; some hygienic valves include integral leakage detection ports. The AI model correlates these indicators with cumulative cycle count and thermal exposure to predict remaining useful life for each valve seat — enabling maintenance planners to schedule seat replacement at the optimal intervention window.
Does deploying CIP equipment condition monitoring require replacing our existing valves or pumps?
No. iFactory's platform is sensor-agnostic and integrates with existing CIP equipment — any brand of spray ball, valve, pump, or instrument. The platform reads data from existing PLC registers (valve position feedback, pump VFD telemetry, flow transmitter values) and existing sensors (conductivity, temperature, pressure, pH) through standard OPC-UA, Modbus TCP, and API connectors. No equipment replacement is required. For equipment classes without existing sensors — such as spray ball coverage on older vessels — retrofit sensor options are evaluated and recommended during deployment, but these are augmentation decisions, not rip-and-replace mandates.
How does iFactory integrate CIP equipment condition data with our existing CMMS?
iFactory integrates with SAP, Oracle, JDE, Microsoft Dynamics, and major CMMS platforms. When the AI model detects coverage degradation, valve seal wear, pump performance drop, or instrument drift crossing the intervention threshold, the platform automatically creates a CMMS work order with equipment tag, fault description, estimated intervention window, recommended spare parts (spray ball insert, valve seat kit, impeller wear ring), and priority classification based on cleaning criticality. The Shift Logbook provides maintenance planners with a unified equipment condition view — all CIP equipment status, pending interventions, and historical trend data in a single dashboard.
What is the typical ROI timeframe for CIP equipment condition monitoring deployment?
Plants deploying AI-driven CIP equipment monitoring typically recover their full investment within 6–9 months. The dominant ROI drivers are unplanned CIP downtime reduction (−40–60 %), extended mean time between maintenance interventions (+30–50 %), and CIP-related product quality deviation reduction (−50–70 %). Spare parts cost reduction from transitioning from fixed-interval to condition-based replacement typically adds 15–20 % additional savings. Most plants achieve positive ROI within the first two quarters — with the condition monitoring programme producing larger savings as the AI models accumulate equipment-specific degradation pattern data.
Run the CIP Equipment Condition Assessment Built for Your Plant
iFactory AI's hygienic maintenance practice runs a focused assessment against your specific CIP equipment population, existing sensor coverage, CMMS configuration, and maintenance intervals. You leave with a defended monitoring deployment plan, a 6-week rollout timeline, and a quantified unplanned downtime reduction projection grounded in your plant's actual equipment reliability data.