A snack manufacturer in Gujarat discovered this the hard way: a filling machine purchased for $280,000 had accumulated $1.1 million in total ownership costs over 12 years — and nobody had been tracking it. When the machine finally failed catastrophically, there was no replacement plan, no budget provision, and no data to support an emergency CapEx request. Three weeks of line downtime at $18,000 per day followed. Most FMCG plants know exactly what their equipment cost when they bought it. Very few know what it costs to own it. The purchase price of a packaging line is the smallest financial number in its lifecycle — maintenance costs, energy consumption, downtime losses, spare parts, and eventual replacement typically add up to 3 to 5 times the original capital expenditure over a 15-year asset life. A Wisconsin dairy processing plant replaced their primary pasteurizer three years before the manufacturer's rated lifespan because cumulative maintenance costs over the final three years exceeded replacement cost by $127,000 — costs that had never been tracked systematically against the asset's performance baseline. Asset lifecycle management is the discipline that prevents these scenarios — tracking every asset from commissioning through productive life to planned replacement, using real cost data to make better capital investment decisions. iFactory AI builds the complete asset lifecycle record automatically — commissioning data, maintenance history, total cost of ownership, condition scores, and replacement forecasts — giving your maintenance and finance teams the data they need to make better capital decisions. Book a Demo to see iFactory's Asset Lifecycle Management module on live plant data, or to discuss your FMCG asset strategy.
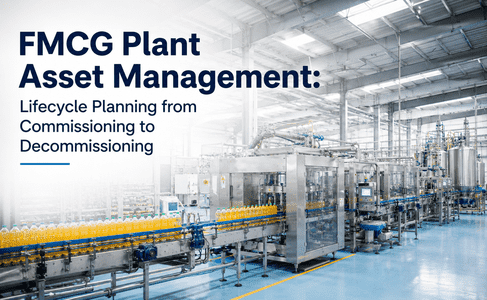
Strategic asset lifecycle planning for FMCG plants: capital planning, replacement forecasting, and multi-year CapEx budgeting.
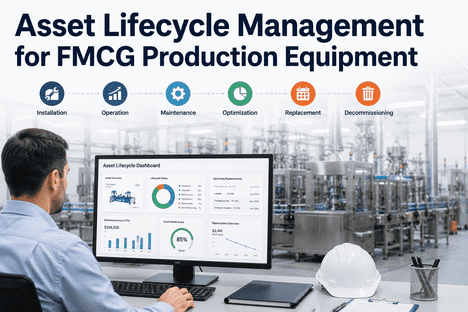
iFactory AI tracks every production asset from commissioning through decommissioning — capturing total cost of ownership, condition trends, and replacement forecasts in a single platform connecting maintenance, finance, and engineering.
What structured asset lifecycle management delivers for FMCG plants
These are measured outcomes from FMCG facilities that implemented systematic asset lifecycle tracking — capturing total cost of ownership, condition-based replacement timing, and multi-year capital planning visibility across their production equipment portfolio.
What iFactory AI does that spreadsheets and legacy CMMS cannot
Traditional CMMS systems log work orders against assets. iFactory AI tracks the complete lifecycle — capturing total cost of ownership, condition degradation trends, and replacement economics in a single platform connected to your maintenance, finance, and engineering workflows.
Complete asset register with lifecycle fields
iFactory registers every production asset with commissioning date, original cost, depreciation schedule, manufacturer rated life, current condition score, and total accumulated maintenance cost. All lifecycle data is visible in a single asset record — no spreadsheet reconciliation required.
Total cost of ownership tracking
Every work order, part replacement, and service event is costed against the asset automatically. iFactory calculates cumulative TCO per asset — including labor, parts, contractor costs, downtime cost, and energy consumption — updating in real time as new data flows in.
Condition-based replacement forecasting
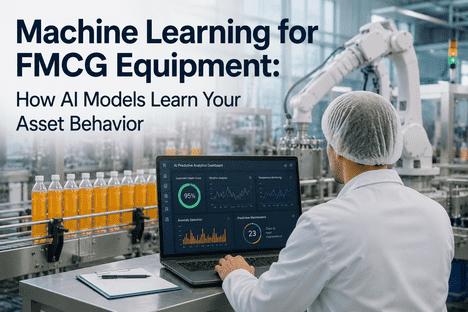
iFactory's AI models combine maintenance cost trends, failure frequency acceleration, condition monitoring data, and efficiency degradation to predict the optimal replacement year for each asset — balancing maintenance cost against replacement cost to minimize total lifecycle expenditure.
Multi-year CapEx planning dashboard
The CapEx planning module generates a rolling 3- to 5-year replacement forecast showing every asset approaching end-of-life, with budget requirements by year, criticality score, and risk of failure. Finance teams can model budget scenarios and compare deferral costs against replacement costs.
Depreciation and financial integration
iFactory connects to your ERP financial module to sync asset depreciation schedules, book values, and capital project budgets. Maintenance cost data flows back to finance for accurate asset impairment assessment and lifecycle cost reporting.
Commissioning to decommissioning audit trail
Every event in the asset's life is timestamped and documented: installation, acceptance testing, calibration certificates, major repairs, modifications, condition assessments, and eventual disposal. This audit trail satisfies BRC, SQF, FSMA, and ISO 55000 compliance requirements.
Industry perspective on FMCG asset lifecycle management
"The most expensive asset in an FMCG plant is not the one that costs the most to replace — it is the one you are not tracking. I have seen plants with $50 million in installed equipment running assets 12 years past their economic life because nobody had calculated the total cost of ownership. The maintenance team knew the machine was costing more every year. The finance team had no data to support a replacement request. The production team could not afford the downtime. iFactory's lifecycle approach closes this gap by giving every stakeholder the same data: what this asset has cost to maintain, what it is costing now, and what it will cost to keep running versus replace. That single number changes capital planning conversations from opinion-based to data-based."
The real cost of not managing asset lifecycles in FMCG
In FMCG manufacturing, every production asset follows a predictable degradation curve. The failure rate during the first year is high as commissioning issues surface. Years two through seven typically deliver steady operation with routine PM costs. From year eight onward, maintenance costs accelerate, failure frequency increases, and efficiency declines. The decision point — maintain, rebuild, or replace — arrives years before the asset physically fails, but most plants miss it because they lack the data to recognize the crossing point.
Hidden lifecycle costs exceed replacement value by millions
A filling machine purchased for $280,000 accumulated $1.1 million in maintenance, downtime, and energy costs over 12 years. The plant had never tracked cumulative TCO against the original purchase price. When the machine failed, there was no replacement plan and no budget — three weeks of line downtime at $18,000 per day followed. iFactory's lifecycle tracking would have flagged the crossing point at year nine when cumulative maintenance cost exceeded replacement cost, triggering a planned replacement with 24 months of budget lead time.
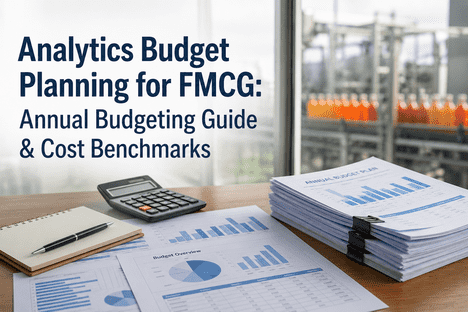
Emergency CapEx is 40-60% more expensive than planned replacement
Plants without lifecycle planning replace equipment reactively — emergency procurement, expedited shipping, overtime installation, and lost production add 40 to 60 percent to the total replacement cost. A planned replacement using lifecycle forecasting reduces total project cost by 35 to 50 percent and can be scheduled during a demand trough with zero revenue impact. iFactory's 5-year replacement forecast gives finance teams the visibility to budget for planned replacements rather than emergency appropriations.
Regulatory compliance requires documented lifecycle records
BRC Clause 4.6, SQF Module 11, and FSMA Preventive Controls all require documented evidence that equipment is maintained according to a written program and that maintenance history is traceable per asset. A lifecycle record showing commissioning date, PM history, condition assessments, and replacement rationale provides the audit trail that certifying bodies require. iFactory captures every lifecycle event automatically — no manual file compilation for audits.
You do not need a new ERP. You need lifecycle data connected to your existing maintenance and finance workflows. Book a Demo to see how iFactory AI builds your complete asset lifecycle register from the data you already have.
From asset register to lifecycle-driven CapEx planning in four weeks
iFactory AI's lifecycle deployment builds on your existing asset data. You provide your current asset list. We populate lifecycle fields from work order history, financial records, and equipment specifications. No data migration. No manual data entry. No ERP replacement.
Build the asset register
We import your existing asset list from your CMMS, ERP, or spreadsheet — populating commissioning dates, purchase costs, depreciation schedules, and manufacturer rated life for every production asset. iFactory's pre-built connectors support SAP, Oracle, and 40+ other platforms.
Populate lifecycle cost data
We ingest 3 to 5 years of work order history, part replacement records, and contractor invoices — attributing every cost to its asset. Total cost of ownership per asset is calculated automatically, including labor, parts, contractor costs, and downtime impact.
Train condition-based replacement models
AI models analyze maintenance cost trends, failure frequency, and efficiency data to predict optimal replacement timing for each asset. The model identifies the economic crossing point where continued maintenance costs exceed replacement costs.
Deploy the CapEx planning dashboard
Finance, engineering, and maintenance teams see the same 5-year replacement forecast with budget requirements by year, asset criticality scores, and deferral cost analysis. Rolling updates ensure the plan stays current as asset condition evolves.
Asset lifecycle management is the foundation of capital efficiency in FMCG
Most FMCG plants manage assets in silos: maintenance tracks work orders, finance tracks depreciation, engineering tracks performance. No single system connects these data streams into a coherent lifecycle view. The result is reactive replacement, hidden lifecycle costs, and capital budgeting decisions made without total cost of ownership data. iFactory AI solves this by building the complete asset lifecycle record automatically — from commissioning data and maintenance history to condition scores and replacement forecasts — giving every stakeholder the same data to make better capital decisions.
If you are running production assets without lifecycle cost visibility, iFactory AI can have a complete asset register with TCO tracking operational in four weeks.
FAQ: FMCG asset lifecycle management with iFactory AI
Ready to transform your FMCG plant's capital planning with lifecycle data?
You have seen the cost of not tracking asset lifecycles. Now see iFactory AI in action on your own asset data. We will build a complete lifecycle register with TCO tracking and replacement forecasts in a live walkthrough tailored to your plant.