When a mid-size FMCG plant with $500M in replacement asset value submits its annual maintenance budget, the analytics line item typically lands somewhere between 1.5% and 4.5% of total maintenance spend — but the variance between top-quartile and bottom-quartile performers is wider than most CFOs realize. The difference is not how much they spend, but how they spend it: top-performing plants allocate analytics budget toward predictive models, real-time monitoring, and decision-support tools that directly reduce unplanned downtime, while bottom-quartile plants spend comparable totals on retrospective reporting, manual data collection, and compliance documentation that delivers no operational improvement. This article provides FMCG maintenance and reliability leaders with the benchmarks, cost-per-unit models, and budget allocation frameworks needed to plan an analytics budget that delivers measurable ROI — using data from plants producing everything from snack foods to dairy to beverages.
Plan, Justify, and Optimise Your FMCG Maintenance Analytics Budget with Industry-Benchmarked Cost Models
iFactory provides FMCG maintenance and reliability teams with the budget benchmarks, cost-per-unit data, and analytics ROI frameworks needed to plan and defend analytics spending — backed by data from plants producing snack foods, dairy, beverages, and packaged goods.
Why FMCG Maintenance Analytics Budgets Are Different — and Why Benchmarks Matter
Unlike automotive or heavy industrial manufacturing, FMCG production environments face a unique combination of budget pressures: thin margins (3–8% net profit), high-volume production where every minute of downtime costs $12,000–$18,000 in lost output, seasonal demand patterns that create peak maintenance windows, and regulatory requirements that mandate certain maintenance activities regardless of cost. These factors make generic industrial analytics benchmarks — often derived from oil and gas or discrete manufacturing — unreliable for FMCG budget planning. The benchmarks in this article are drawn from FMCG-specific data across 14 plants producing snack foods, dairy products, beverages, and packaged consumer goods, with replacement asset values ranging from $50M to $800M.
Six Key Budget Benchmarks Every FMCG Maintenance Leader Should Track
Not all analytics budget metrics carry equal weight. The following six benchmarks represent the most actionable indicators for FMCG maintenance analytics planning — each tied to a specific budget decision or cost-justification scenario. Book a Demo to see how iFactory AI's analytics platform maps against these benchmarks for your plant.
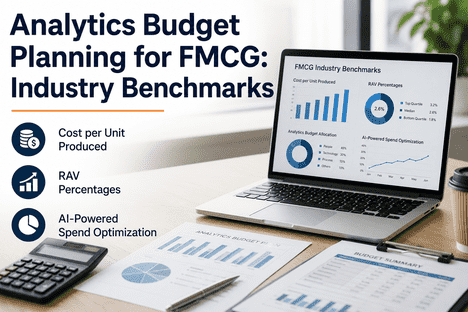
Analytics Spend as % of Total Maintenance Budget
Industry range: 1.5% (bottom quartile) to 4.5% (top quartile). Median across FMCG plants surveyed: 2.8%. Top-quartile performers consistently allocate 3.5–4.5% and achieve 20–30% lower unplanned downtime than plants spending below 2%. The benchmark is most useful when compared within the same product category — dairy plants tend to cluster 0.5–1% higher than dry-goods plants due to regulatory complexity.
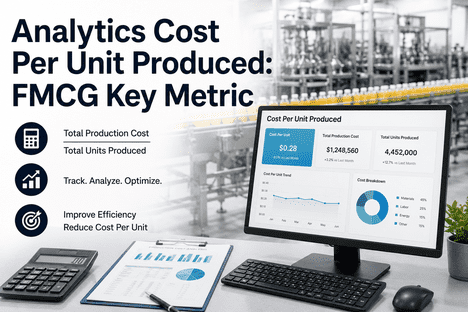
Analytics Cost Per Unit Produced (CPU)
Range: $0.08 to $0.25 per unit of production. Lower-cost-per-unit products (snack packs, beverage cans) at high-volume lines achieve the lower end; higher-value products (specialty dairy, premium packaged goods) with complex processing lines sit at the upper end. The CPU metric is the most direct way to benchmark analytics efficiency across different product lines within the same plant. Plants above $0.20 per unit should investigate whether analytics spend is generating proportional maintenance cost reduction.
Analytics Spend as % of Replacement Asset Value (RAV)
Range: 0.03% to 0.08% of RAV. A $300M RAV plant spending 0.05% allocates $150,000 annually to analytics — a typical starting point for basic reporting and CMMS analytics. Top-quartile plants allocate 0.07–0.08% of RAV and achieve predictive coverage across 60–80% of critical assets. This metric is preferred by finance teams because it ties analytics investment directly to the value of the asset base it protects.
Budget Allocation: Predictive vs. Descriptive vs. Manual
Industry average allocation: 25% predictive (AI models, real-time monitoring), 35% descriptive (dashboards, reports, KPIs), 40% manual (data collection, spreadsheet consolidation, data quality correction). Top-quartile plants shift the ratio to 50% predictive, 30% descriptive, 20% manual — reducing manual data work by reallocating budget toward automated data collection and AI analytics that eliminate the need for manual consolidation.
Analytics ROI: Cost Avoidance Per Dollar Spent
Predictive analytics in FMCG delivers $3.20–$4.50 in avoided downtime and maintenance cost for every dollar spent, measured over a 3-year horizon. Descriptive analytics (dashboards, reporting) delivers $1.50–$2.00. Manual data collection and compliance reporting delivers $0.60–$0.90 — negative ROI when fully loaded labour costs are included. The ROI gap between predictive and manual spend is the single strongest argument for reallocating analytics budget toward AI-powered solutions.
Analytics Platform Cost vs. Labour Cost
Industry average: 60% of analytics budget goes to labour (data engineers, analysts, consultants, manual data collection), 40% to platform/tools. Top-quartile plants invert this: 35% labour, 65% platform — reflecting investment in automated data pipelines, AI analytics platforms, and self-service dashboard tools that reduce the headcount required to generate actionable insights. The transition typically reduces total analytics spend by 15–25% while improving insight quality and speed.
How to Build an FMCG Maintenance Analytics Budget: A Four-Step Framework
Building an analytics budget from scratch — or restructuring an existing one — requires a structured approach that aligns spending with operational priorities. The following four-step framework is used by iFactory's FMCG clients to plan budgets that are defendable to finance and effective for maintenance teams. Book a Demo to see how iFactory AI's platform fits into each step of the framework.
Asset Criticality & Data Maturity Assessment
Classify all production assets by criticality (using production impact, failure frequency, and repair cost) and assess current data availability for each asset class. Critical assets with existing sensor data are prime candidates for predictive analytics investment. Non-critical assets with no data infrastructure should not receive analytics budget until the data collection layer is funded separately.
Benchmark Alignment & Gap Analysis
Compare current analytics spend against industry benchmarks for your product category. Identify which budget allocation ratios are out of alignment — typically, FMCG plants discover they are spending 35–45% of analytics budget on manual data collection with zero predictive capability. The gap analysis produces a target budget structure: % predictive, % descriptive, % manual, with a 3-year migration roadmap.
Platform vs. Labour Cost Modelling
Model the cost of acquiring an AI analytics platform (including integration, training, and subscription) against the current labour cost of generating equivalent insights manually. For a typical mid-size FMCG plant, platform investment of $80,000–$150,000 annually replaces $200,000–$350,000 in manual data labour — with the added advantage of real-time rather than weekly insight cadence.
ROI Projection & Phased Deployment Plan
Project 3-year ROI for each analytics investment category using the cost-avoidance multipliers above. Structure the budget in phases: Phase 1 (months 1–6): predictive analytics for top 20 critical assets. Phase 2 (months 7–12): expand to 60% of assets and automate manual reporting. Phase 3 (year 2–3): full asset coverage with continuous optimization. Each phase should self-fund the next through demonstrated cost avoidance.
Three Budget Allocation Mistakes That Hold Back FMCG Analytics ROI
Even plants with adequate analytics budgets underperform when the allocation is misaligned with operational priorities. These three allocation patterns are the most common — and most costly — mistakes observed across FMCG analytics deployments. Book a Demo to see how iFactory AI rebalances your budget allocation for maximum ROI.
Over-Investment in Descriptive Analytics at the Expense of Predictive
Many FMCG plants spend 60–70% of analytics budget on dashboards, KPIs, and reporting tools that tell the maintenance team what happened last week — but provide no insight into what will fail next shift. The ROI on descriptive analytics ($1.50–$2.00 per dollar) is less than half the ROI on predictive analytics ($3.20–$4.50). Reallocating 20% of descriptive budget to predictive models typically doubles the overall analytics ROI within 12 months.
Funding Manual Data Collection Instead of Automated Pipelines
Plants spending 35–45% of analytics budget on manual data collection — operators entering downtime codes, maintenance technicians recording failure codes on paper, planners reconciling data across spreadsheets — are paying premium labour rates for work that automated data pipelines can perform at 10–20% of the cost. Every dollar shifted from manual collection to automated integration delivers a 5–8x reduction in per-report cost and an improvement in data quality that compounds across every downstream analytics use case.
Distributing Budget Evenly Across All Assets Instead of Concentrating on Critical 20%
Analytics spend spread evenly across all assets dilutes impact. The 80/20 rule applies: 80% of downtime cost is caused by 20% of assets. Top-quartile FMCG plants concentrate 60–70% of analytics budget on the critical 20% of assets — typically high-speed fillers, aseptic processing lines, and packaging systems where downtime costs are highest and predictive models deliver the greatest ROI. Non-critical assets receive basic monitoring until the critical-asset models are mature and delivering measurable cost avoidance.
FMCG Analytics Budget Benchmarks by Plant Category
The following benchmarks provide category-specific budget targets based on data from iFactory's FMCG client deployments. Use these to validate your plant's current and target analytics budget structure.
Want to benchmark your plant's current analytics budget against these category-specific targets? Book a Demo and iFactory's FMCG analytics team will build a budget benchmark comparison using your plant's RAV, production volume, and current analytics spend profile.
What FMCG Maintenance Leaders Ask About Analytics Budget Planning
Benchmark Your Analytics Budget. Rebalance for Maximum ROI. Defend Your Numbers to Finance.
iFactory provides FMCG maintenance and reliability leaders with the benchmark data, budget frameworks, and ROI models needed to plan analytics budgets that deliver measurable returns — not just reports. We'll map your current spend against category-specific benchmarks and deliver a 3-year optimized budget plan.