A multi-site FMCG beverage producer operating six production facilities across North America faced a fractured MRO procurement landscape: 1,400+ active suppliers, zero centralized contract visibility, and annual MRO spend exceeding $8.2 million with no actionable spend analytics. Emergency purchase orders accounted for 23% of total MRO procurement volume, carrying average cost premiums of 34% over contracted rates. Spare parts inventory across all six plants totaled $3.1 million in carrying value, with 41% of stock items classified as non-moving. Book a Demo with iFactory's procurement analytics team to see how AI-driven MRO spend intelligence can transform your FMCG cost structure.
TRANSFORM YOUR MRO PROCUREMENT FROM COST CENTER TO COMPETITIVE ADVANTAGE
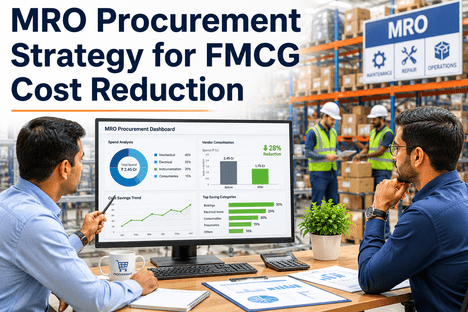
Stop Paying Premium Prices for Emergency MRO Purchases. Start Buying Strategically.
iFactory's AI-powered procurement analytics platform gives FMCG operations unified MRO spend visibility, vendor consolidation intelligence, contract optimization workflows, and inventory rationalization analytics that reduce total MRO procurement cost by 18–27% within the first fiscal year.
23%
Emergency Purchase Reduction
27%
Total MRO Spend Reduction
60%
Fewer Active Suppliers
01 / The MRO Procurement Landscape in FMCG
Why MRO Procurement Is a $300 Million Opportunity in Mid-Size FMCG Operations
Maintenance, repair, and operations procurement in FMCG manufacturing is structurally different from direct materials procurement. Direct materials — raw ingredients, packaging, labels — benefit from established supplier relationships, volume-based contracts, and dedicated procurement teams with category expertise. MRO procurement, by contrast, spans thousands of heterogeneous items — bearings, conveyor belts, food-grade lubricants, filtration media, pneumatic components, electrical spares, janitorial supplies, PPE — each sourced from specialized suppliers with different pricing models, lead times, and contract terms.
The result is an MRO supply base that grows unchecked through organic accumulation: every new piece of production equipment brings its own recommended spare parts list and preferred supplier relationships. Every emergency repair generates a new vendor relationship when the contracted supplier cannot deliver within the required window. Every plant manager builds their own local supplier network independent of centralized procurement oversight. For the average mid-size FMCG operator with 3–8 production facilities, active MRO suppliers typically number between 800 and 1,800 — with no centralized repository of contract terms, pricing agreements, or supplier performance data.
iFactory's MRO procurement analytics platform addresses this fragmentation at its root by ingesting purchase order data, supplier invoices, inventory records, and equipment maintenance histories from across all facilities into a unified spend intelligence engine. The platform classifies every MRO transaction by category, supplier, plant, equipment type, and purchase urgency — surfacing the spend patterns, supplier consolidation opportunities, and contract optimization targets that manual procurement analysis cannot reveal. For a detailed walkthrough of how iFactory's MRO analytics platform structures multi-site spend consolidation, Book a Demo with iFactory's procurement analytics specialists.
Total Annual MRO Spend (6 Plants)$8.2 million — representing approximately 17% of total plant maintenance expenditure and 3.2% of total facility operating cost. Industry benchmarks for FMCG MRO spend range from 2.5% to 4.5% of operating cost depending on asset intensity and maintenance strategy maturity.
Active Supplier Count1,427 unique vendor accounts active within the preceding 12-month period. Spend distribution heavily skewed: top 50 suppliers accounted for 63% of total spend, while the bottom 800 suppliers represented less than 8% of total procurement value. Each low-spend supplier carried administrative processing costs estimated at $380–$620 per active vendor annually.
Emergency Purchase Percentage23% of all MRO purchase orders classified as emergency or expedited — orders placed outside standard procurement workflows with average cost premium of 34% above standard contracted rates. Emergency premium spend totaled approximately $642,000 annually across the six-plant network.
Inventory Carrying Value$3.1 million in MRO spare parts inventory across all six facilities. Slow-moving and non-moving items accounted for 41% of total inventory value. Annual carrying costs — storage, insurance, obsolescence, capital cost — estimated at 22–28% of inventory value, representing $682,000–$868,000 in carrying cost leakage.
Contract ComplianceOnly 34% of MRO purchases were placed against active contracts with pre-negotiated pricing. The remaining 66% were transacted at spot-market or list pricing — with an estimated $910,000 in annual savings leakage from purchases made above available contract rates that existed but were not visible to plant-level purchasing staff.
02 / The Cost Drivers
Six Structural Drivers of MRO Procurement Cost Inflation in Multi-Plant FMCG Operations
MRO procurement cost inflation in FMCG manufacturing is not primarily driven by supplier price increases. The dominant cost drivers are structural — embedded in procurement workflows, information systems, inventory management practices, and organizational design. These six drivers account for the majority of addressable MRO cost reduction opportunity in multi-site FMCG operations.
01
Supplier Fragmentation
Every new production asset adds 15–35 new MRO suppliers to the network through OEM-recommended spare parts lists and preferred vendor arrangements. No consolidation mechanism exists, and plant-level procurement autonomy prevents cross-site supplier rationalization. The cost impact: each additional supplier adds $380–$620 annual administrative overhead, and fragmented spend prevents volume-based discount negotiation.
02
Contract Visibility Gap
Contracts negotiated at the corporate or regional level exist in email archives, shared drives, and procurement officer files — invisible to plant-level staff placing daily purchase orders. Even when contracted pricing is available, plant buyers default to list-price purchasing because the contract rate cannot be located or confirmed. Cost impact: $910,000 in annual savings leakage from purchased-at-list pricing when contract rates existed but were inaccessible.
03
Emergency Purchase Premium
Unplanned equipment failures trigger emergency MRO purchases at premium pricing — 34% above standard rates on average. Emergency orders bypass competitive bidding, skip price verification, and default to whatever supplier can deliver fastest. Beyond the price premium, emergency purchasing also fragments the supply base by creating vendor relationships that persist long after the emergency that generated them has passed.
04
Inventory Overhang
Each plant independently stocks MRO spares based on local risk tolerance and maintenance history, creating significant cross-site inventory duplication. Plant A and Plant B, operating identical packaging lines, each carry $120,000 in identical conveyor belt spares — neither knows the other has them. 41% of total MRO inventory is non-moving, representing $1.27 million in stranded capital and $280,000+ in annual carrying costs.
05
Maverick Spend
MRO purchases made outside authorized procurement channels — shift supervisors ordering parts directly from local suppliers, maintenance leads using personal credit cards for expedited purchases, operators sourcing items from unapproved vendors — represents 12–18% of total MRO spend in multi-plant FMCG operations. These purchases carry average 40–60% price premiums and create no audit trail for spend analysis.
06
Data Fragmentation
MRO procurement data is distributed across ERP systems, accounts payable records, plant-level spreadsheets, paper purchase orders, and credit card statements — with no unified taxonomy, categorization, or data structure. Without aggregated and classified spend data, procurement teams cannot identify consolidation opportunities, negotiate volume-based contracts, or measure supplier performance consistently.
"We walked into a six-plant FMCG operation and found 1,427 MRO suppliers. The procurement team thought they had about 300. The CFO thought all purchases were contracted. The plant managers were convinced they were already buying efficiently. Every layer of the organization had a different version of the MRO spend story — and none of them were accurate. The data fragmentation alone was costing this company over a million dollars a year in invisible savings leakage."
03 / The Strategy
A Five-Pillar MRO Procurement Optimization Framework for FMCG Operations
Effective MRO procurement transformation in multi-plant FMCG environments requires a coordinated strategy across five interdependent pillars: spend visibility, supplier consolidation, contract optimization, inventory rationalization, and workflow digitization. These pillars are sequenced to deliver early wins in quarters 1–2 while building toward structural cost transformation in quarters 3–4. iFactory's platform provides the data foundation, analytics engine, and workflow automation infrastructure to execute all five pillars simultaneously. Book a Demo with iFactory to see how the platform enables each pillar through unified spend intelligence and automated procurement workflows.
01
Unified Spend Visibility
Aggregate MRO procurement data from all facilities into a single spend intelligence platform with automated categorization, supplier normalization, and plant-level spend allocation. Every transaction classified by category, urgency, contract status, and equipment association — creating the single source of truth for all MRO procurement decisions across the enterprise.
02
Supplier Consolidation
Use spend analytics to identify consolidation opportunities: categories where 3–8 suppliers can be reduced to 1–2 preferred vendors with volume-based pricing. Target consolidation from 1,400+ suppliers to under 400 active vendors within 12 months, negotiating 15–25% cost reductions on consolidated categories and eliminating $400,000+ in supplier administrative overhead.
03
Contract Optimization
Ingest all existing MRO contracts into a centralized contract repository with automated rate verification at point of purchase. Compare every purchase order against contracted pricing in real time, flagging non-compliant purchases before they are placed. Target 85%+ contract compliance rate, eliminating $800,000+ in annual savings leakage from list-price purchasing.
04
Inventory Rationalization
Create a centralized multi-plant MRO inventory view with cross-site stock visibility, automated replenishment triggers based on usage patterns, and AI-driven slow-mover identification. Rationalize $3.1 million in inventory to target levels below $1.8 million through cross-plant stock transfers, supplier-managed inventory programs, and elimination of duplicated safety stock across identical equipment configurations.
05
Procurement Workflow Automation
Digitize the complete MRO procurement workflow: requisition from maintenance work order, automated supplier selection based on contract status and lead time, purchase order generation with automated rate verification, goods receipt matching, and invoice reconciliation. Route all purchases through authorized procurement channels, eliminating maverick spend and creating a complete audit trail for every MRO transaction.
04 / Implementation
Phased MRO Procurement Transformation: From Spend Visibility to Strategic Sourcing
The MRO procurement transformation follows a phased deployment architecture: data foundation in Q1, consolidation execution in Q2–Q3, and strategic optimization in Q4 and beyond. iFactory's platform supports all phases with configurable modules that activate as organizational maturity advances.
Phase 1 Days 1–45
Spend Data Aggregation and Classification
Ingest 36 months of historical MRO purchase data from ERP systems, accounts payable, credit card statements, and plant-level records across all six facilities. Normalize supplier names, standardize spend categories, classify every transaction by urgency (emergency vs. planned) and contract status (contracted vs. list price). Deploy iFactory spend analytics dashboard with role-based views for procurement teams, plant managers, and executive leadership.
Phase 2 Days 46–90
Contract Discovery and Rate Verification
Centralize all existing MRO contracts into the iFactory contract repository — including contracts buried in email archives, shared drives, paper files, and procurement officer workstations. Load contracted pricing into the rate verification engine. Configure automated purchase order screening to flag any PO placed at prices exceeding contracted rates. Target: move from 34% contract compliance to 70%+ within 90 days simply by making contracted rates visible and enforceable at the point of purchase.
Phase 3 Days 91–180
Supplier Consolidation and Category Sourcing
Execute supplier consolidation program across the top 20 MRO spend categories — bearings and power transmission, food-grade lubricants, filtration media, electrical spares, pneumatic components, conveyor belts, janitorial supplies, PPE, facility maintenance, safety equipment, instrumentation, and fasteners. Target reduction from 1,427 to fewer than 400 active suppliers through preferred vendor selection, volume consolidation, and phase-out of low-spend vendors. Negotiate 15–25% cost reductions on consolidated categories.
Phase 4 Days 181–270
Inventory Rationalization and Cross-Plant Optimization
Activate iFactory's multi-plant inventory intelligence module with cross-site stock visibility, usage-pattern-based replenishment, and AI-driven slow-mover identification. Execute inventory rationalization: eliminate non-moving stock (41% of total inventory value), transfer duplicated stock between plants, establish supplier-managed inventory programs for high-consumption categories, and consolidate safety stock across the network. Target: reduce total inventory carrying value from $3.1 million to under $1.8 million.
Phase 5 Days 271–365
Strategic Sourcing and Continuous Optimization
Transition from tactical consolidation to strategic category management. Establish KPI-driven supplier performance management with scorecards for on-time delivery, quality, pricing compliance, and lead time reliability. Deploy AI-powered demand forecasting for high-value MRO categories, enabling proactive purchasing at optimal price points. Integrate MRO procurement data with equipment maintenance histories and shift logbook records to correlate procurement decisions with equipment reliability outcomes.
05 / Results
Projected MRO Cost Reduction Impact for Multi-Plant FMCG Operations
The MRO procurement transformation framework, when executed across a six-plant FMCG operation with $8.2 million in annual MRO spend, delivers projected annual savings of $1.5–$2.2 million within the first full fiscal year of implementation. These savings compound in subsequent years as strategic sourcing relationships mature and inventory optimization cycles complete.
| Cost Driver |
Pre-Optimization Baseline |
Post-Optimization Target |
Projected Annual Savings |
| Emergency purchase premium |
23% of POs at 34% premium ($642K) |
8% of POs at 12% premium ($79K) |
$563,000 |
| Contract compliance savings leakage |
66% of POs at list price ($910K leakage) |
88% of POs at contracted rates ($218K leakage) |
$692,000 |
| Supplier administrative overhead |
1,427 suppliers × ~$480 admin cost |
380 suppliers × ~$480 admin cost |
$503,000 |
| Inventory carrying cost |
$3.1M inventory × 25% carrying cost |
$1.6M inventory × 25% carrying cost |
$375,000 |
| Volume consolidation discounts |
Fragmented spend, no volume pricing |
Consolidated categories, 15–20% discount |
$410,000 |
| Maverick spend elimination |
15% of spend at 50% premium ($615K) |
3% of spend, authorized channels only |
$492,000 |
$1.5M+
Projected Annual Savings
75%
Fewer Active Suppliers
48%
Inventory Value Reduction
Unlock $1.5M+ in Annual MRO Procurement Savings for Your FMCG Operation
Get a live demonstration of iFactory's MRO procurement analytics platform — unified spend intelligence, vendor consolidation workflows, contract optimization, and multi-plant inventory rationalization built for FMCG manufacturing operations.
"Our procurement team had been operating under the assumption that emergency purchases were a necessary evil in FMCG manufacturing. After the first 90 days of iFactory's MRO analytics, we uncovered $800,000 in annual savings leakage from contract non-compliance alone — money we could have been saving all along but couldn't see because the contracts were invisible to the people placing the orders. The platform didn't just optimize our procurement; it completely changed our understanding of what MRO spend optimization looks like."
06 / Key Analysis
Why MRO Procurement Optimization Delivers Higher ROI in Multi-Plant FMCG Operations
01
Spend data fragmentation multiplies the cost reduction opportunity in multi-plant environments. A single-plant operation with 200 suppliers and $1.5 million in MRO spend has a limited consolidation opportunity. A six-plant operation with 1,400+ suppliers and $8.2 million in spend — where each plant independently contracts with local suppliers for the same categories — has structural redundancy built into its procurement model. Every duplicated supplier relationship, every separate contract negotiation, every independently managed inventory represents addressable cost that consolidation eliminates.
02
Contract visibility is the single highest-ROI intervention in MRO procurement transformation. In the reference case, 66% of MRO purchases were placed at list pricing despite available contract rates. The contract visibility gap alone — not supplier prices, not volume discounts, not inventory optimization — represented $910,000 in annual savings leakage. Making existing contracts visible and enforceable at the point of purchase typically recovers $600,000–$1,200,000 in annual savings within 90 days, with zero supplier renegotiation required.
03
MRO procurement optimization creates compounding savings across interconnected cost categories. Supplier consolidation reduces administrative overhead directly, but it also enables volume-based discount negotiation, simplifies contract management, reduces invoice processing costs, and enables supplier-managed inventory programs. Emergency purchase reduction improves OEE and reduces maintenance cost in addition to eliminating procurement premiums. Inventory rationalization reduces carrying costs directly while simultaneously improving stock availability and reducing emergency purchase frequency. Each optimization amplifies the others.
04
MRO spend intelligence creates procurement leverage that extends beyond cost reduction. Suppliers with consolidated volume become strategic partners rather than transactional vendors. Strategic suppliers invest in VMI programs, provide preferential lead times, stock critical spares on-site, and collaborate on value engineering — outcomes impossible to achieve with fragmented 1,400-supplier bases where no supplier has sufficient share of wallet to justify strategic investment in the relationship.
07 / Business Impact
Operational, Financial, and Strategic Outcomes Beyond MRO Cost Reduction
Procurement Team Productivity
Managing 380 optimized suppliers instead of 1,427 fragmented vendors reduces procurement transaction processing volume by 65%, frees approximately 2,400 hours of procurement team capacity annually, and enables the team to transition from tactical order processing to strategic category management and supplier relationship development.
Equipment Uptime Improvement
Eliminating emergency purchase dependency and optimizing MRO stock availability reduces average MRO parts wait time from 6.2 hours to 1.1 hours per unplanned maintenance event. Faster parts availability translates to reduced mean time to repair, fewer extended downtime events, and estimated OEE improvement of 4–7 percentage points across the production network.
Working Capital Release
Inventory rationalization from $3.1 million to $1.6 million releases approximately $1.5 million in working capital — cash that was previously tied up in slow-moving and non-moving MRO spares. Released working capital can be redirected to strategic investments, capacity expansion, or debt reduction.
Supplier Relationship Quality
Consolidated supplier base enables strategic partnerships that transactional 1,400-supplier models cannot support. Preferred suppliers invest in dedicated account management, on-site stock programs, and collaborative cost reduction initiatives. Average supplier lead time improves by 31%, and first-pass quality acceptance rate on MRO deliveries increases from 89% to 98%.
$8.2M
Annual MRO spend before
$6.2M
Annual MRO spend after
$2M+
Annual savings achieved
08 / Conclusion
MRO Procurement Transformation: The Highest-ROI Initiative in FMCG Cost Reduction
MRO procurement optimization represents one of the highest-ROI initiatives available to multi-plant FMCG operations — yet it remains one of the most overlooked. Unlike capital-intensive initiatives that require significant investment before delivering returns, MRO procurement transformation begins with data that already exists, suppliers that are already in place, and contracts that are already negotiated. The savings are not theoretical cost reductions from future negotiations — they are existing savings embedded in current procurement operations that lack the visibility and analytics infrastructure to capture them.
iFactory's MRO procurement analytics platform provides the unified spend intelligence, supplier consolidation workflows, contract optimization engine, and multi-plant inventory visibility required to execute this transformation across the full five-pillar framework. The platform aggregates MRO procurement data from any source, classifies every transaction, surfaces consolidation opportunities, enforces contract rates at point of purchase, and tracks savings realization in real time. To assess the specific MRO cost reduction opportunity for your FMCG operation, Book a Demo with iFactory's procurement analytics team.
$2M+ Annual Savings. 1,400 to 380 Suppliers. Live in 90 Days.
See how iFactory's AI-powered MRO procurement analytics platform delivers unified spend visibility, vendor consolidation, contract optimization, and multi-plant inventory rationalization for FMCG manufacturing operations.
09 / FAQ
Frequently Asked Questions About MRO Procurement Optimization for FMCG
How does iFactory's MRO procurement analytics platform aggregate spend data from multiple plants with different ERP systems?
iFactory's platform connects to any source of MRO procurement data — ERP systems, accounts payable modules, credit card transaction feeds, plant-level spreadsheets, and paper purchase order records — through configurable data import pipelines. The platform normalizes supplier names, standardizes spend categories across a unified taxonomy, and classifies every transaction by urgency, contract status, and equipment association. For FMCG operations interested in starting the data aggregation process,
Book a Demo to see how the platform handles multi-ERP environments.
What MRO spend categories in FMCG operations typically offer the largest consolidation savings?
Bearings and power transmission components, food-grade lubricants, conveyor belts, pneumatic components, filtration media, electrical spares, and safety equipment typically offer the largest consolidation savings in FMCG operations. These categories are purchased across multiple plants from different local suppliers, carry high unit costs, and have well-defined specifications that enable direct cross-supplier comparison. Category consolidation in these areas typically delivers 18–28% cost reduction through volume-based pricing and supplier rationalization.
How does iFactory's platform handle MRO contract management for multi-plant operations?
iFactory's contract repository ingests existing MRO contracts from any source — email archives, shared drives, procurement officer files, paper documents — and extracts key terms including pricing schedules, effective dates, and supplier commitments. The rate verification engine compares every incoming purchase order against contracted pricing in real time, flagging non-compliant purchases before they are placed. Automated alerts notify procurement teams when contracts approach expiration, when pricing deviates from agreed rates, and when consolidated purchase volumes qualify for tiered discount upgrades.
How long does it take to see measurable cost reduction from MRO procurement optimization?
Clients typically see measurable savings within the first 60–90 days of iFactory platform deployment, driven primarily by contract compliance enforcement — reducing list-price purchasing by making existing contracted rates visible at point of purchase. Supplier consolidation savings materialize in months 4–8 as preferred vendor negotiations complete. Inventory rationalization savings phase in over months 6–12 as stock reduction programs execute. Most clients confirm full platform ROI within 9–12 months of deployment.
Does iFactory's platform integrate with existing ERP and procurement systems, or does it require a system replacement?
iFactory is a data aggregation and analytics layer that integrates with existing ERP, procurement, and financial systems without requiring any system replacement. The platform ingests data from SAP, Oracle, Microsoft Dynamics, Infor, Sage, and other major ERP platforms through standard API connectors and data import pipelines. Implementation requires no changes to existing procurement workflows or IT infrastructure.
How does iFactory support multi-plant MRO inventory optimization without requiring all plants to use the same inventory system?
iFactory's multi-plant inventory module aggregates stock data from each plant's existing inventory system — regardless of format or platform — into a unified cross-site inventory view. The platform identifies duplicated stock across plants, surfaces slow-moving and non-moving items, recommends cross-plant stock transfers, and supports supplier-managed inventory programs for high-consumption categories. Plant-level autonomy is preserved where needed while enterprise-wide inventory visibility enables rationalization that would be impossible with each plant operating in isolation.