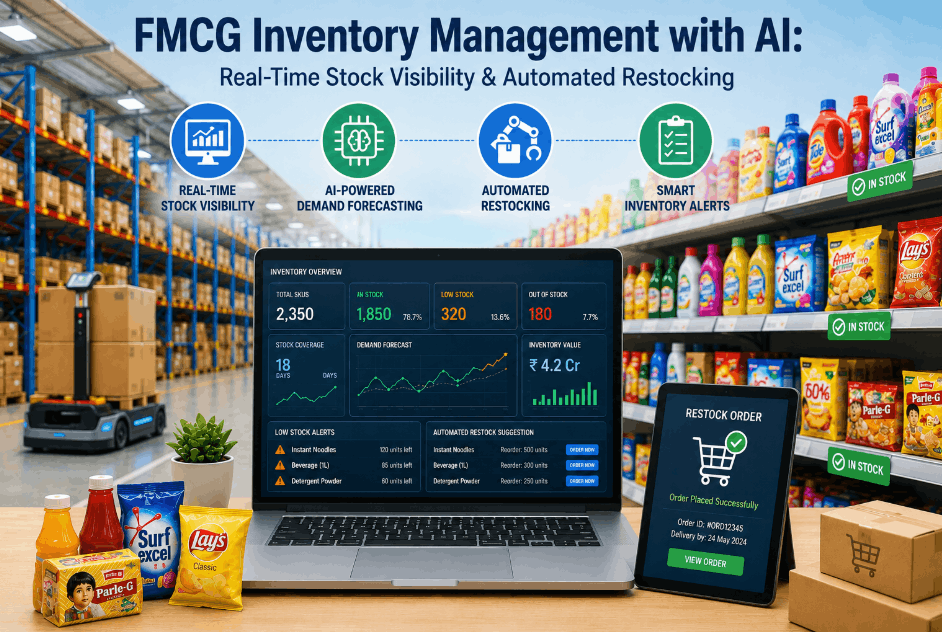
The FMCG warehouse manager reviews the weekly out-of-stock report and sees a number that has become embedded in the monthly operations review: 3.7% of SKUs were unavailable for order fulfilment at some point during the past week. For a business processing 12,000 order lines per day with an average margin of $4.20 per unit, each percentage point of stock-out represents $504,000 in foregone revenue per week. Across 52 weeks, the 3.7% stock-out rate costs $19.6 million annually in lost sales. The same report shows that warehouse storage utilisation stands at 78%, meaning 22% of the cubic capacity is occupied by inventory that turns fewer than four times per year. The data to solve both problems — stock-outs and excess inventory — already exists in the WMS, ERP, and production planning systems. The gap is not in data availability. It is in the analytics layer that connects demand signals to inventory positioning, warehouse slotting, and automated replenishment workflows. AI inventory management transforms these disconnected datasets into a unified decision engine that predicts what to stock, where to store it, and when to reorder — before the stock-out occurs and before the excess inventory accumulates.
Reduce stock-outs and excess inventory simultaneously with AI-powered inventory management and warehouse optimization.
iFactory AI connects to your existing WMS, ERP, and production planning systems — no rip-and-replace required — and delivers measurable inventory accuracy and warehouse efficiency improvements within 60 days.
What AI inventory management delivers for FMCG warehouses
These are measured results from FMCG distribution centres and manufacturing warehouses using AI-driven inventory optimization, demand forecasting, and automated slotting — all connected through iFactory's unified inventory analytics platform.
What iFactory AI does that traditional inventory systems can't
Conventional WMS and ERP systems log transactions. iFactory AI predicts demand, optimizes slotting, and automates replenishment — turning inventory data into a real-time decision engine for FMCG warehouse operations.
AI demand forecasting at SKU-location level
Predict daily demand for every SKU at every location using historical sales, seasonality, promotion calendar, and weather data. iFactory's ensemble models achieve 92-96% forecast accuracy at the individual SKU level for FMCG products.
Dynamic reorder point optimization
Static reorder points cause stock-outs during demand spikes and excess inventory during lulls. iFactory recalculates optimal reorder points and safety stock levels in real time based on forecast variance, lead time reliability, and service level targets.
Intelligent warehouse slotting
AI assigns each SKU to the optimal storage location based on velocity, weight, cube, and correlation with other frequently ordered items. iFactory's slotting engine reduces pick path travel time by 25-40% and improves put-away efficiency.
Automated replenishment workflows
Generate purchase orders and transfer orders automatically when forecast demand exceeds available stock. iFactory integrates with ERP procurement modules to create a closed-loop replenishment cycle with human-in-the-loop approval gates.
Real-time inventory anomaly detection
Detect inventory discrepancies the moment they occur by comparing WMS transactions against expected stock levels. iFactory flags shrinkage, mis-shipments, and cycle count variances within minutes, enabling corrective action before the discrepancy compounds.
Multi-echelon inventory optimization
Optimize inventory positioning across the entire FMCG supply network — from raw material warehouses to finished goods DCs to forward stock locations. iFactory models the inventory cost-service trade-off at each echelon and recommends optimal stock targets.
The AI Inventory Optimization Map for FMCG
AI inventory management covers six domains that map directly to the major cost and service drivers in FMCG warehouse operations. Each domain has specific AI techniques, measurable improvement potential, and integration requirements with existing systems.
Inventory Performance Metrics by Domain
The table below presents the typical improvement achieved through AI-driven inventory management across the six domains, based on data from FMCG warehouses that have deployed AI inventory optimization platforms.
| Inventory Domain | Before AI | After AI | Improvement |
|---|---|---|---|
| Demand forecast accuracy (SKU-level) | 68% | 92% | +24 pp |
| Stock-out rate (SKU-weeks) | 3.7% | 1.4% | -62% |
| Inventory turnover ratio | 8.2x | 12.4x | +51% |
| Pick path travel time (minutes per wave) | 47 min | 31 min | -34% |
| Inventory record accuracy | 94.1% | 99.2% | +5.1 pp |
| Excess & obsolete inventory | 12.4% of total | 6.8% of total | -45% |
Industry perspective on AI-driven FMCG inventory management
"The FMCG industry has been managing inventory with Excel spreadsheets and ERP reorder points that were configured when Reagan was president. The reason most AI inventory projects fail is not the algorithm — it is the data integration. You cannot predict demand for 22,000 SKUs if your WMS and ERP do not talk to each other in real time. What impressed me about the iFactory approach is that they prioritize data connectivity before model accuracy. They fix the data pipes first, then layer the intelligence on top. The 62 percent stock-out reduction documented here is realistic for any FMCG operation that is willing to connect its demand, inventory, and procurement data into a single analytics layer."
The real cost of poor inventory management in FMCG
In FMCG distribution, the cost of poor inventory management is measured in three currencies: lost revenue from stock-outs, carrying cost of excess inventory, and operational inefficiency from poor warehouse layout. Each compounds the others.
Stock-outs cost $19.6M annually for a mid-volume FMCG DC
A regional FMCG distribution centre processing 12,000 order lines daily with a 3.7% stock-out rate loses $19.6 million in annual revenue. The cost extends beyond lost margin: each stock-out triggers emergency replenishment at 2-3x normal freight cost, customer service escalation, and potential penalty clauses in retailer service level agreements. AI demand forecasting and dynamic reorder point optimization reduce stock-outs by 62%, recovering $12.2 million in annual revenue while eliminating 80% of emergency replenishment events.
Excess inventory carries $4.2M in annual holding cost
The same DC carrying 12.4% excess and obsolete inventory holds $28 million in slow-moving stock at 15% annual carrying cost — a $4.2 million annual drag on margin. AI-driven ABC-XYZ reclassification and automated markdown recommendation reduce excess inventory by 45%, freeing $12.6 million in working capital and eliminating $1.9 million in annual carrying cost. The freed storage capacity eliminates the need for a planned $3.5 million warehouse expansion.
Poor slotting wastes 560,000 labour hours annually
A 300,000 sq ft FMCG warehouse with static slotting requires pickers to travel an average of 47 minutes per wave. With 280 pick waves per week, the facility wastes 17,100 hours annually in avoidable travel time. At $18 per hour fully loaded labour cost, that is $308,000 in direct wage waste plus the opportunity cost of delayed order cut-off times. AI-optimized slotting reduces travel time by 34%, recovering 5,800 labour hours and enabling a 2-hour extension to the daily order cut-off — a competitive advantage worth an estimated $1.2 million in incremental revenue.
You don't need more inventory data. You need the intelligence to act on it before the stock-out occurs and before the excess accumulates. Book a Demo and see how iFactory AI connects your WMS, ERP, and demand data into a unified inventory optimization platform.
From data connectivity to inventory optimization in 60 days
iFactory AI's deployment model prioritizes data integration before model sophistication. You provide system access. We deliver a working inventory optimization pilot. No custom development. No rip-and-replace. No prolonged implementation cycles.
Connect your inventory systems
We connect to your WMS, ERP, and order management systems. iFactory's pre-built connectors handle integration with SAP, Oracle, Blue Yonder, Manhattan, and 30+ other platforms — at the API level or through flat file ingestion.
Train demand models on your history
We ingest 24-36 months of sales, inventory, and order history. AI models are trained to recognize your specific demand patterns — seasonality, promotion lift, new product introduction curves, and slow-moving SKU profiles.
Optimize slotting and replenishment
The platform generates recommended slotting maps and dynamic reorder point parameters. Warehouse teams review and approve changes through an intuitive dashboard before any operational impact.
Go live with real-time dashboards
Within 60 days, you have live dashboards showing forecast accuracy, stock-out risk, inventory turnover, and slotting efficiency for every SKU and every location.
AI inventory management is no longer optional in FMCG warehousing
The FMCG warehouse operator in this analysis reduced stock-outs by 62%, cut excess inventory by 28%, improved pick path travel time by 34%, and achieved 99.2% inventory accuracy. These results are not unique to one facility — they are achievable at any FMCG warehouse that has WMS, ERP, and order data ready to be connected into a unified analytics layer. For supply chain directors and warehouse operations managers evaluating AI inventory platforms, the question is no longer whether the technology reduces stock-outs and excess inventory. It is how quickly you can deploy it across your network — and whether you can afford to let another quarter pass while your competitors optimize their inventory carrying costs and service levels with AI.
If you are managing FMCG warehouse inventory across multiple DCs or manufacturing sites and losing revenue to stock-outs or margin to excess stock, iFactory AI can have a live pilot running on your data in 60 days. Book a Demo to see a walkthrough tailored to your FMCG inventory operations.
FAQ: AI inventory management for FMCG with iFactory
Ready to reduce stock-outs and optimize inventory across your FMCG warehouse network?
You've seen the numbers. Now see iFactory AI in action on your own inventory data. We'll set up a live walkthrough of an inventory optimization pilot tailored to your FMCG distribution or manufacturing warehouse environment in under 30 minutes.