Analytics cost per unit produced is one of the most consequential metrics in FMCG manufacturing yet it is one of the least consistently measured. Every production line generates analytics data: OEE readings, quality inspection results, energy consumption per SKU, line changeover times, downtime reason codes, and throughput rates. The cost of collecting, storing, processing, and extracting decisions from this data is real software licensing, cloud infrastructure, data engineering labor, and the opportunity cost of time managers spend interpreting dashboards instead of acting on insights. When analytics costs are not tracked per unit produced, facilities have no way to know whether their data investments are generating returns proportional to production volume. iFactory AI's analytics platform includes cost-per-unit tracking as a native capability automatically calculating total analytics expenditure against production output so FMCG facilities can measure, benchmark, and optimize their analytics ROI with the same discipline they apply to raw material yield and line efficiency. Book a Demo to see how iFactory AI tracks analytics cost per unit across your FMCG production lines.
Measure, benchmark, and optimize the true cost of production analytics — from data infrastructure and software licensing to engineering labor and dashboard management — per unit of FMCG output.
Why Analytics Cost Per Unit Matters for FMCG Profitability
FMCG manufacturing operates on thin margins — typically 3 to 8 percent net profit after raw materials, packaging, labor, energy, and distribution costs. In this environment, every dollar of overhead must be justified by its contribution to margin protection or improvement. Analytics expenditure is overhead — it does not directly produce output — yet most FMCG facilities treat analytics costs as a fixed operating expense rather than a variable cost that should scale with production volume and demonstrate measurable ROI. When analytics costs are expressed per unit produced, facility managers can assess whether their data infrastructure investment is proportionate to output volume, identify facilities or lines where analytics costs are disproportionately high, and make data-driven decisions about platform consolidation, automation, and tool rationalization. Facilities that actively track and optimize analytics cost per unit typically spend 25 to 40 percent less on analytics infrastructure than those that do not — while extracting equal or greater decision-making value from their data. Book a Demo to see how iFactory AI calculates and tracks analytics cost per unit automatically across your production lines.
The per-unit analytics cost range varies by facility complexity, data volume, and the number of analytics platforms in use. Consolidated platforms drive toward the lower end of the range.
Facilities that consolidate their analytics tools into a unified platform eliminate redundant licensing, reduce data engineering overhead, and lower total analytics cost per unit.
Most FMCG plants run 4 to 6 separate analytics tools — OEE dashboards, quality systems, energy monitoring, production reporting, and maintenance analytics — each with its own licensing cost.
When analytics cost per unit is optimized, the savings and production improvements contribute directly to margin improvement in a low-margin operating environment.
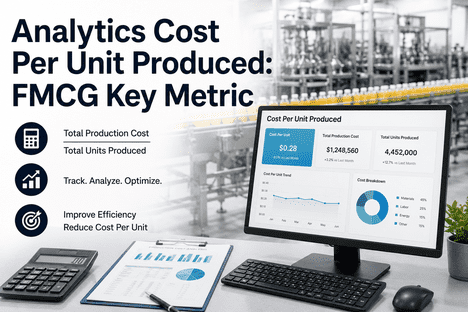
How to Calculate Analytics Cost Per Unit Produced
The calculation is straightforward in principle but requires consistent cost categorization and production volume tracking in practice. The formula is: total analytics expenditure divided by total production units over the same period. The complexity lies in defining what qualifies as analytics expenditure and ensuring production volume data is accurate and aligned to the same time period.
| Cost Category | Examples | Typical Annual Cost (Mid-Size FMCG Plant) | Allocation Method |
|---|---|---|---|
| Software Licensing | OEE platform, QMS, energy analytics, BI tools, data historian | $35,000 – $120,000 | Full cost or per-line/user allocation |
| Cloud Infrastructure | Data storage, compute, data pipeline services, API costs | $15,000 – $60,000 | Proportional to data volume per line |
| Data Engineering Labor | Data pipeline maintenance, dashboard development, system integration | $40,000 – $100,000 | Hours allocated per production line or SKU |
| Analytics Personnel | Data analysts, BI developers, analytics managers | $60,000 – $150,000 | FTE percentage per facility or line |
| Training & Adoption | Platform training, change management, user support | $8,000 – $25,000 | Per-user or per-facility allocation |
| Hardware & Sensors | Edge devices, IoT sensors, data collection gateways | $20,000 – $80,000 | Depreciation amortized per year per asset |
How iFactory AI Tracks and Optimizes Analytics Cost Per Unit
iFactory AI's analytics platform includes native cost-per-unit tracking that automatically aggregates analytics expenditure across software licensing, infrastructure, and labor — then divides by production volume to deliver a per-unit cost metric updated in real time. Facilities can track trends, benchmark across lines, and identify optimization opportunities without manual spreadsheet consolidation.
Automatic Cost Aggregation
iFactory AI consolidates analytics costs from software licensing, cloud infrastructure, data engineering labor, and analytics personnel into a single cost pool. Costs are allocated automatically to production lines, SKUs, or facilities based on data volume and usage metrics.
Real-Time Per-Unit Calculation
Total analytics expenditure is divided by production volume in real time, delivering a live cost-per-unit metric that updates as production data flows in. Facility managers can see the per-unit cost impact of adding new data sources, increasing storage, or scaling analytics headcount.
Line-Level Benchmarking
Analytics cost per unit is tracked per production line, making it easy to identify lines where data costs are disproportionate to output volume. Lines running below the facility average are candidates for platform consolidation or process standardization.
Trend Analysis & Forecasting
Historical cost-per-unit trends are visualized alongside production volume trends, showing the relationship between analytics investment and output. Forecast models project future analytics costs based on planned production volume changes.
Platform Consolidation ROI Modeling
The platform models the cost impact of consolidating from multiple analytics tools into iFactory AI's unified platform — showing the projected reduction in licensing, infrastructure, and labor costs per unit produced.
Shift Logbook Cost Context
Analytics cost per unit is visible in iFactory AI's Shift Logbook, giving shift managers visibility into how their operational decisions affect the cost efficiency of data collection and analytics at the line level.
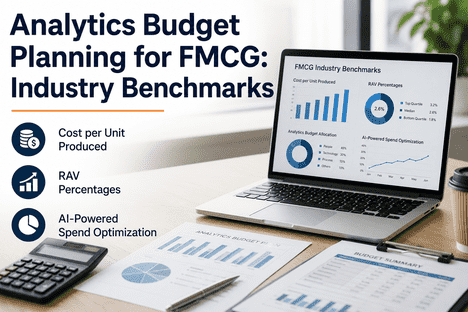
Industry Benchmarks: Analytics Cost Per Unit by FMCG Category
Benchmarking analytics cost per unit against industry peers provides context for evaluating whether a facility's analytics investment is proportionate. The ranges below are based on iFactory AI's analysis of FMCG facilities across multiple product categories, normalized for facility size and production complexity. Actual costs vary based on data volume, the number of analytics platforms in use, and the level of automation in data collection and reporting.
| FMCG Category | Typical Annual Production Volume | Analytics Cost Per Unit (Range) | Key Cost Drivers | Optimization Opportunity |
|---|---|---|---|---|
| Bottled Beverages | 50M – 200M units | $0.01 – $0.04 | High-volume, low-complexity data; fewer data points per unit | Consolidate line-level OEE and quality analytics into single platform |
| Packaged Foods | 20M – 100M units | $0.02 – $0.06 | Multi-ingredient tracking, multiple packaging formats, variable data complexity | Standardize analytics KPIs across product lines to reduce custom dashboard maintenance |
| Dairy & Chilled | 15M – 80M units | $0.03 – $0.08 | Cold-chain monitoring, shelf-life tracking, regulatory compliance data streams | Integrate temperature and compliance data streams into production analytics platform |
| Confectionery & Snacks | 30M – 150M units | $0.01 – $0.05 | High-speed packaging lines, changeover-intensive production, multiple SKU formats | Automate changeover analytics to reduce manual data collection and reporting labor |
| Personal Care | 10M – 60M units | $0.03 – $0.07 | Regulatory documentation, batch tracking, raw material traceability requirements | Eliminate duplicate systems by consolidating quality and production analytics |
| Pet Food | 15M – 80M units | $0.02 – $0.06 | Multi-protein formulations, nutritional compliance data, supplier quality integration | Automate compliance reporting data feeds to eliminate manual data extraction costs |
Five Strategies to Reduce Analytics Cost Per Unit
Reducing analytics cost per unit does not mean spending less on analytics — it means spending more efficiently. The following strategies represent the highest-impact approaches that FMCG facilities use to reduce per-unit analytics costs while maintaining or improving decision-making capability.
The single most effective cost reduction strategy is platform consolidation. Most FMCG facilities run 4 to 6 separate analytics tools — each with its own licensing, infrastructure, and support costs. Consolidating onto a unified platform eliminates redundant licensing and reduces data engineering overhead by 30 to 50 percent.
Manual data collection — operators entering readings into spreadsheets, QA staff transcribing inspection results, maintenance technicians logging downtime reasons after the shift — is a significant hidden analytics cost. Automating data collection at the source eliminates transcription labor and improves data quality simultaneously.
Custom dashboard development and maintenance is one of the largest analytics labor costs. Standardizing KPIs, report formats, and dashboard templates across lines and facilities reduces the engineering hours required to maintain analytics outputs.
Cloud data storage costs scale with retention volume. Many FMCG facilities retain raw sensor data at full resolution indefinitely, paying for storage they rarely query. Implementing tiered retention policies — high-resolution for recent data, aggregated for historical — reduces cloud infrastructure costs without losing analytical capability.
When analytics are embedded in the tools operators and supervisors already use — shift logbooks, work order systems, quality checklists — the incremental cost of generating analytical insights approaches zero. Separate analytics tools that require separate logins and separate workflows add cost without adding value.
Frequently Asked Questions
The most common mistake I see in FMCG analytics is treating data infrastructure as a fixed overhead cost that does not need to be managed like other production inputs. No facility manager would accept a 15 percent variance in raw material yield without investigating the root cause — yet the same managers accept 40 to 60 percent variance in analytics cost per unit across their production lines without a second thought. The difference is visibility. When analytics costs are expressed per unit produced and tracked at the line level, the optimization opportunities become obvious: lines with custom dashboard setups that require ongoing engineering support, facilities running duplicate analytics platforms because no one consolidated the licensing, data storage policies that retain high-resolution sensor data from five years ago that no one has queried since it was collected. The discipline of measuring analytics cost per unit is the first step toward treating data infrastructure with the same cost management rigor as every other production input.
Conclusion
Analytics cost per unit produced is not an academic metric — it is a practical tool for managing one of the fastest-growing cost categories in FMCG manufacturing. Facilities that track this metric systematically consolidate platforms, automate data collection, standardize reporting, optimize data storage, and embed analytics in operational workflows — reducing per-unit costs by 25 to 40 percent while maintaining or improving analytical capability. iFactory AI's unified analytics platform makes cost-per-unit tracking automatic and provides the consolidation, automation, and standardization tools needed to drive analytics costs toward the lower end of the industry benchmark range.
Book a Demo today to see how iFactory AI can help your facility measure, benchmark, and optimize analytics cost per unit produced across every production line.
Measure and Optimize Your True Analytics Cost Per Unit
iFactory AI automatically tracks analytics expenditure against production output — giving FMCG facilities the visibility they need to consolidate platforms, automate data collection, and drive analytics costs toward the industry benchmark of $0.03 per unit or lower.