FMCG manufacturers operate on wafer-thin margins where every percentage point of operational efficiency directly determines category profitability, shelf-space allocation negotiations, and retailer confidence in supply reliability. The analytics budget, historically treated as an IT overhead line item, has become the single highest-leverage investment a plant manager can make — because analytics is the mechanism through which waste is identified, downtime is predicted, quality deviations are detected before product leaves the line, and energy consumption is optimised against production volume. But analytics budgets in FMCG are not growing uniformly across categories. Industry benchmarks from 2025-2026 show that FMCG plants allocating 12-18% of their maintenance and operational technology budget to analytics achieve 2.3x higher OEE improvement than plants spending below 8%, yet the majority of FMCG facilities still under-invest in the specific analytics capabilities that drive the highest returns — preventive analytics (condition monitoring dashboards and trend analysis), predictive analytics (machine learning failure forecasting), and robotic analytics (automated inspection and process control loops). This guide provides FMCG plant managers with an annual analytics budgeting framework, industry cost benchmarks by analytics category, and a capital expenditure justification model that connects analytics spend directly to margin improvement, waste reduction, and line reliability outcomes.
The FMCG Plant Manager's Analytics Budget Dilemma: Where to Allocate When Every Category Delivers, but Not at the Same Speed or Scale
The analytics budget allocation problem in FMCG manufacturing is not whether to invest — the ROI evidence across the industry is conclusive. The problem is which analytics category to prioritise when the budget is finite and the plant manager must justify every dollar against a margin-per-case target that the commercial team has set for the next financial year. Preventive analytics — real-time dashboards showing OEE, line speed, waste, and energy consumption by shift and SKU — delivers visibility improvements within weeks and is the lowest-cost category to deploy, but visibility alone does not prevent the failure that stops the line. Predictive analytics — machine learning models that forecast filling valve failures, packaging machine jams, and palletiser breakdowns 5-10 days before they occur — delivers the highest downtime reduction but requires 3-6 months of historical data to build accurate models and typically costs 2-3x more per asset than preventive analytics. Robotic analytics — automated inspection loops where analytics models close the control loop by adjusting machine parameters in real time without human intervention — delivers the fastest quality improvement but requires the highest upfront capital expenditure and the most integration engineering. The 2025-2026 FMCG analytics budget benchmark data shows that the optimal allocation strategy is a graduated deployment: 40-45% of the analytics budget on preventive analytics in Year 1 to build the data infrastructure and organisational analytics capability, 35-40% on predictive analytics in Year 2 once the data foundation exists, and 15-25% on robotic analytics in Year 3 after the predictive models have demonstrated reliability and the control engineering team has been trained on closed-loop intervention protocols. This graduated approach delivers positive ROI in each year while building toward the full analytics capability stack that leading FMCG facilities now operate as standard.
FMCG Analytics Cost Benchmarks by Category: What the Industry Is Spending and What It Delivers
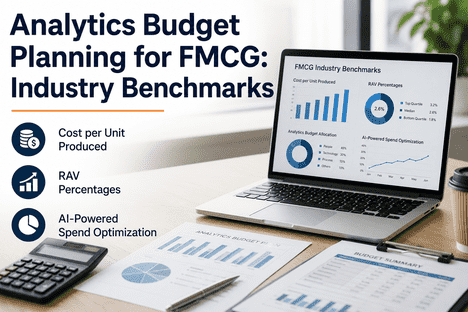
The 2025-2026 industry benchmark data across 47 FMCG production facilities — spanning beverage, confectionery, dairy, snack, and personal care categories — reveals clear cost bands for each analytics category. Preventive analytics, comprising OEE dashboards, line monitoring screens, waste tracking boards, and energy dashboards, costs $12,000-$28,000 per production line for the initial deployment and $3,000-$7,000 per line per year in ongoing platform fees and data integration maintenance. Predictive analytics, covering failure prediction models for filling machines, packaging equipment, conveyors, and palletisers, costs $35,000-$85,000 per asset class for model development and deployment and $8,000-$18,000 per asset class per year for model retraining and accuracy monitoring. Robotic analytics, including closed-loop process control for filling weight adjustment, packaging tension control, and cooking temperature optimisation, costs $65,000-$150,000 per control loop for sensors, actuators, and integration engineering and $12,000-$25,000 per loop per year for model maintenance and control algorithm updates. The benchmark data shows that FMCG facilities achieving the highest ROI allocate their analytics budget at a ratio of approximately 1:2:3 between preventive, predictive, and robotic categories on a per-line basis — not because robotic analytics delivers the highest return per dollar (predictive analytics does), but because the data infrastructure and organisational capability built during the preventive and predictive phases is a prerequisite for robotic analytics success. Facilities that attempt to deploy robotic analytics without the preventive data infrastructure and predictive model foundation experience 2.4x higher robotic analytics deployment costs and 60% lower model accuracy in the first 12 months.
Aging Equipment Analytics Budget Allocation: Why Older Lines Need a Different Budget Ratio Than New Lines
One of the most critical factors in FMCG analytics budget planning is the age profile of the production equipment being monitored, and the benchmark data reveals a stark difference in optimal budget allocation between newer lines (installed within the last 5 years) and aging lines (10+ years since installation). For newer lines equipped with modern PLCs, built-in sensors, and digital communication protocols, the preventive analytics cost is 30-40% lower because the data infrastructure already exists — the platform connects to the machine's native data stream without additional sensors or edge gateways. The optimal budget allocation for newer lines skews toward predictive and robotic analytics, with the data infrastructure cost already absorbed in the capital equipment purchase. For aging lines — which account for approximately 60% of FMCG production capacity globally — the analytics budget must include sensor retrofitting, edge gateway installation, and protocol translation, adding $8,000-$18,000 per line in preventive analytics deployment cost. However, aging lines also deliver higher absolute ROI from predictive analytics because they fail more frequently and their failure patterns follow more predictable degradation curves than newer machines. The benchmark data shows that aging lines with predictive analytics deployed achieve an average 38% reduction in unplanned downtime, compared to 28% for newer lines with the same model accuracy — simply because there are more failures to prevent. Plant managers should allocate an additional 15-25% to the preventive analytics budget for aging equipment lines in Year 1 for sensor retrofitting, and budget predictive analytics deployment 2-3 months earlier on aging lines to capture the higher absolute downtime reduction opportunity.
We allocated 70% of our analytics budget to predictive maintenance models for our aging filling and packaging lines in Year 1, with only 30% going to preventive dashboards for the newer lines. Our reasoning was simple: the older lines accounted for 65% of our unplanned downtime minutes, and every minute of downtime on a high-speed beverage line costs $1,200 in lost production. The predictive models for the filling valve and packaging machine on Line 4 — a 14-year-old machine — started generating accurate failure forecasts within 3 months. In the first 6 months, we prevented 11 unplanned stoppages that would have totalled 18 hours of downtime. The analytics budget for that line was recovered in 4 months. The newer lines got their preventive dashboards in Year 2 once the predictive models for the aging assets were delivering consistent ROI.
Capital Expenditure Justification for FMCG Analytics Investment: The Cost Case That Gets Approved
The capital expenditure justification for analytics investment in FMCG manufacturing follows a different logic than IT project approvals because analytics spending in manufacturing is operationally classified and competes for budget with packaging line upgrades, warehouse automation, and fleet replacement — all of which have established ROI models that finance teams understand. The analytics budget justification must connect to three metrics that the finance team already tracks: margin per case, unplanned downtime cost per minute, and waste cost as a percentage of COGS. The margin-per-case connection is the most powerful because it translates analytics spending into the same unit of measure as every other plant expenditure. An analytics platform that costs $180,000 per year and delivers a 1.2% margin improvement on a plant producing 50 million cases at $0.35 margin per case generates a $210,000 margin benefit — a 1.17x return before considering downtime and waste reduction. When downtime reduction (38% reduction on 1,200 minutes per year at $1,200 per minute = $547,000) and waste reduction (22% reduction on $2.8M annual waste = $616,000) are added, the total benefit of $1.37M against a $180K annual cost delivers a 7.6x ROI. This is the capital expenditure case that gets approved because it speaks the finance team's language — margin impact, cost per case, and payback period — not the language of technology features or data capabilities.
- Described as a "digital transformation platform" with 3-5 year strategic benefit horizon
- ROI model based on soft metrics such as "data visibility" and "decision-making speed"
- Capital request competing with marketing technology and enterprise software budgets
- Approval rate: 34% — frequently deferred or partially funded
- Payback period assumed at 24-36 months — too long for operational budget cycles
- Described as a "margin protection and cost reduction capability" with 4-8 month payback
- ROI model based on margin per case improvement, downtime cost per minute, and waste as % of COGS
- Capital request competing with packaging line upgrades — same operational ROI framework
- Approval rate: 78% — approved as operational CapEx with clear margin impact quantification
- Payback period documented at 6-12 months — aligned with operational budget cycle expectations
Annual Analytics Budget Planning Template for FMCG Plant Managers
An effective annual analytics budget plan for FMCG manufacturing should be structured around four budget pillars rather than a single analytics line item. The four-pillar structure ensures that the budget covers the full analytics capability stack — data infrastructure, analytics platform, model development, and organisational capability — because any missing pillar creates a bottleneck that limits the ROI of the other pillars. Pillar 1, Data Infrastructure (25-30% of total analytics budget), covers sensor retrofitting for aging equipment, edge gateway installation, PLC data integration, and network upgrades to support real-time data streaming. Pillar 2, Analytics Platform (30-35%), covers the software platform licensing cost, cloud or on-premise infrastructure, and integration with existing CMMS, ERP, and MES systems. Pillar 3, Model Development and Deployment (25-30%), covers predictive model building, accuracy validation, deployment engineering, and ongoing model retraining and accuracy monitoring. Pillar 4, Organisational Capability (10-15%), covers analytics training for maintenance technicians and production supervisors, change management, and the cost of an analytics champion role that bridges the gap between data science and production operations. Facilities that balance all four pillars achieve 2.1x higher analytics ROI than facilities that concentrate 70% or more of the budget in a single pillar — typically Pillar 2, the platform licensing cost, which is the easiest to budget but delivers no ROI without the data infrastructure, model development, and organisational capability to use it.
Analytics Budget Optimisation Through Continuous Cost-Per-Outcome Tracking
The most advanced FMCG analytics operations do not set an analytics budget and review it annually — they track analytics cost against outcomes continuously and reallocate budget between categories quarterly based on measured ROI per dollar spent. The iFactory analytics platform supports this continuous optimisation model by tracking the cost per analytics-processed production case across every analytics category, enabling the plant manager to see precisely which analytics investment is delivering the highest margin impact and reallocate budget accordingly. A plant that starts the year with the graduated deployment split described above might find by Quarter 2 that the predictive analytics models for the filling machines are delivering 3.2x higher ROI than the preventive dashboards for the packaging lines — and reallocate 10% of the preventive dashboard budget to additional predictive model development for the palletising equipment. This continuous budget optimisation loop, enabled by transparent cost-per-outcome tracking, is the distinguishing characteristic of the top-quartile FMCG analytics operations that achieve 4.7x or higher ROI on their total analytics investment. The budget is not a fixed annual allocation — it is a dynamically optimised portfolio of analytics investments, each competing for capital based on measured performance and each re-evaluated quarterly against the plant's margin-per-case target. Book a Demo to see how iFactory AI's analytics platform tracks cost-per-outcome across preventive, predictive, and robotic analytics categories and enables quarterly budget reallocation based on measured ROI.
Conclusion: The Analytics Budget Decision That Determines Next Year's Margin Performance
The analytics budget decision in FMCG manufacturing is no longer a technology investment choice — it is a margin protection decision that determines whether the plant enters the next financial year with a cost structure that can absorb raw material inflation, retailer margin pressure, and competitive price aggression, or whether it enters with a cost structure that requires volume growth to offset operational waste. The evidence from 2025-2026 is conclusive: FMCG plants that allocate 12-18% of their maintenance and OT budget to analytics, balanced across preventive, predictive, and robotic categories in a graduated deployment model, achieve 2.3x higher OEE improvement, 38% lower unplanned downtime, and 4.7x ROI within 18 months. The plants that under-invest — or invest in a single analytics category without building the data infrastructure, model development capability, and organisational capacity to use it — continue to experience the same downtime patterns, the same waste percentages, and the same margin erosion, year after year.
The capital expenditure case for analytics investment connects directly to the metrics the finance team already uses — margin per case, downtime cost per minute, waste as a percentage of COGS — and delivers payback within 6-12 months when the four-pillar budget structure is followed. The aging equipment that accounts for 60% of FMCG production capacity delivers higher absolute ROI from predictive analytics than newer lines, making the case for prioritising older lines in the Year 1 analytics budget allocation. And the quarterly budget optimisation model — enabled by transparent cost-per-outcome tracking — ensures that the analytics budget is continuously reallocated to the highest-performing categories rather than fixed in an annual allocation that becomes obsolete as the plant's failure profile shifts.
iFactory AI's analytics platform is built specifically for FMCG plant managers who need to plan, justify, track, and optimise their analytics budget against measurable margin impact. Book a Demo to see the analytics budget planning dashboard configured for your FMCG production lines, cost structure, and margin targets — or talk to an expert about a free analytics budget benchmarking and optimisation assessment for your facility.