analytics Cost Benchmarking for FMCG How Your Plant Compares
By Seren on June 18, 2026
In the fast-moving consumer goods (FMCG) manufacturing sector, analytics infrastructure spending has become one of the most significant operational technology investments a plant can make yet most FMCG facility managers lack the industry benchmarks needed to evaluate whether their analytics expenditure is competitive, efficient, or delivering proportional value. Analytics costs in FMCG plants span software licensing, sensor and IoT hardware deployment, data pipeline engineering, cloud storage and compute, dashboard development, and the analytics personnel required to transform raw production data into actionable operational intelligence. Without standardized benchmarking metrics cost per unit produced, analytics expenditure as a percentage of replacement asset value (RAV), labor-to-material cost ratios for analytics operations, and spend per data point collected FMCG plants cannot determine whether they are over-investing in underutilized dashboards or under-investing in the analytics capabilities that directly impact OEE, waste reduction, and production throughput. According to industry surveys conducted across FMCG sub-sectors including food and beverage, personal care, home care, and packaged goods, analytics spending as a percentage of total plant maintenance and operations budget varies by a factor of 3x to 5x between plants with similar production volumes and asset complexity indicating that most facilities lack the data-driven framework to optimize their analytics investment. Book a Demo to see how iFactory's Analytics & Reporting Dashboard helps you benchmark, measure, and optimize your plant analytics spend against peer-group standards.
Analytics Cost Benchmarking · FMCG 2026
Benchmark Your Plant Analytics Spend Against Industry Standards
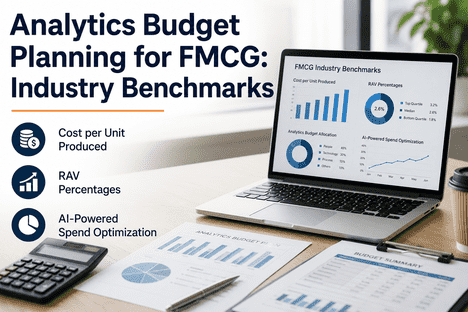
Cost per unit · analytics as % of RAV · labor-to-material ratio · spend per data point — all mapped through iFactory's Analytics & Reporting Dashboard with Shift Logbook integration.
Analytics cost measured per unit of production output
▤
Analytics % of RAV
Expenditure as percentage of replacement asset value
◈
Labor-to-Material Ratio
Personnel cost vs software and hardware analytics spend
⟐
Spend per Data Point
Infrastructure cost per sensor and telemetry stream
Why Analytics Cost Benchmarking Matters for FMCG Plants
FMCG manufacturing plants operate on thin margins — typically 5 to 15% EBITDA — where every dollar of operational technology spend must demonstrably contribute to OEE improvement, waste reduction, or throughput gains. Analytics infrastructure costs have grown 18 to 25% year over year across the sector as plants deploy additional sensors, adopt cloud-based analytics platforms, and invest in data engineering talent, yet fewer than one in five FMCG facilities track their analytics expenditure against production output or asset value baselines. Without benchmarking, plant managers cannot answer fundamental questions: Is spending $0.08 per unit produced on analytics infrastructure reasonable for a high-speed packaging line? Should analytics expenditure be 1.2% or 2.8% of RAV for a filling and bottling plant with 15 production lines? Is the labor-to-material split of 60:40 typical, or does it indicate over-staffing of dashboard maintenance versus under-investment in automated analytics tooling? iFactory's Analytics & Reporting Dashboard provides the benchmarking framework that connects financial analytics data software licensing costs, sensor hardware depreciation, cloud infrastructure charges, and analytics personnel allocation to operational metrics including production volume, asset criticality, data pipeline throughput, and dashboard utilization rates, enabling FMCG plants to compare their analytics investment profile against anonymized peer-group aggregates drawn from the iFactory platform's global manufacturing installation base.
WHY MOST FMCG PLANTS OVERPAY FOR ANALYTICS
1
No cost-per-unit benchmark — analytics budgets are set as arbitrary percentages of maintenance OPEX rather than tied to production output, sensor count, or data pipeline throughput
2
Dashboard proliferation without utilization tracking — plants build 3 to 5 times more dashboards than operators actually use, paying for unused cloud compute, data pipeline engineering, and visualization licensing
3
Labor-to-material ratio blind spot — analytics teams grow without corresponding investment in automated tooling, creating a 60-70% labor cost burden that should shift toward platform-based automation
4
RAV-blind investment decisions — high-criticality assets with $2M+ replacement values receive the same analytics spend as $50K auxiliary equipment, misallocating budget away from the assets that drive plant uptime
Four Benchmarking Metrics Every FMCG Plant Should Track
01
Cost Per Unit Produced — The Production-Linked Metric
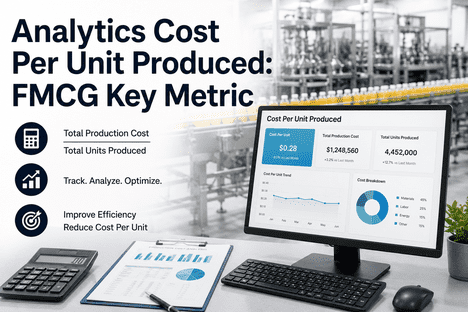
Cost per unit produced is the most direct measure of analytics efficiency in FMCG plants — calculated as total analytics expenditure (software licensing, sensor hardware depreciation, cloud compute, data pipeline engineering, and analytics personnel) divided by total production units over the same period. For high-speed FMCG lines producing 200 to 1,200 units per minute — beverage filling, snack packaging, personal care bottling, detergent boxing — industry benchmarks indicate that analytics costs of $0.04 to $0.12 per unit produced represent the efficient range for plants with moderate to high sensor density. Plants spending above $0.18 per unit typically suffer from dashboard bloat — maintaining 40 to 80 dashboards when operators actively use only 8 to 12 — and over-engineered data pipelines that ingest 3 to 5 times more data than any decision process requires. iFactory's Analytics & Reporting Dashboard surfaces cost-per-unit trends across production lines, comparing each line's analytics spend against its OEE contribution and identifying the dashboards and data pipelines that deliver the highest decision-value per dollar spent. Book a Demo to benchmark your plant's cost per unit against iFactory's FMCG peer group.
Analytics as Percentage of RAV — The Asset-Value Framework
Replacement asset value (RAV) provides the capital-intensity denominator that makes analytics benchmarking consistent across FMCG plants of varying size and complexity. A plant with $50M in total RAV spending 1.5% on analytics infrastructure is investing $750,000 annually — a figure that may be appropriate for a facility with 200+ critical assets, 15 production lines, and complex batch-process control requirements, or excessively high for a simpler packaging-only operation with 50 assets and 4 lines. Industry data across FMCG sub-sectors shows analytics expenditure ranging from 0.8% to 3.2% of total plant RAV, with the efficient frontier at 1.2 to 2.0% for plants with moderate to high sensor density and batch tracking requirements. iFactory enables plants to segment RAV-based analytics spend by asset class — filling machines, packaging lines, conveyors, HVAC, utilities — and compare each class against peer benchmarks to identify under-digitized critical assets and over-instrumented low-criticality equipment.
1.2–2.0% efficient rangeRAV segmentation by asset classPeer-group comparison
03
Labor-to-Material Ratio — The People vs Platform Equation
The labor-to-material ratio — analytics personnel costs (salaries, benefits, contractors) divided by analytics tool and infrastructure costs (software licenses, cloud services, hardware depreciation) — reveals how efficiently a plant balances human effort against automated analytics platform capabilities. The FMCG sector average sits at 55:45 labor-to-material, but best-in-class plants achieve 35:65 through platform-based automation that reduces dashboard maintenance, report generation, and data pipeline management headcount. Plants above 65:35 labor-to-material typically maintain custom-coded dashboards, manual data extraction processes, and spreadsheets-based reporting that consume 3 to 5 times more engineering hours than equivalent platform-based analytics workflows. iFactory's platform collapses the labor-to-material ratio by automating report generation, dashboard creation, data pipeline management, and shift log analytics — enabling plants to redirect analytics personnel from dashboard maintenance to value-adding production optimization.
Spend per Data Point — Infrastructure Efficiency Metric
Spend per data point — total analytics infrastructure cost divided by the number of active sensor and telemetry data streams — measures how efficiently a plant's analytics infrastructure is utilized. FMCG plants with 500 to 5,000 active data points should target $12 to $35 per data point per month for cloud-connected analytics platforms with automated pipeline management. Plants spending above $50 per data point typically maintain redundant data pipelines, duplicate sensor coverage, or over-provisioned cloud infrastructure. The Shift Logbook integration within iFactory's Analytics & Reporting Dashboard tracks which data points are actually consumed by operator decisions and shift reports, enabling plant managers to identify and decommission the 20 to 30% of data streams that support no active decision process — directly reducing spend per data point.
$12–$35 target per pointPipeline optimizationShift Logbook correlation
How iFactory's Analytics & Reporting Dashboard Delivers Benchmarking Intelligence
iFactory is the AI software intelligence layer for manufacturing analytics — not a sensor vendor or hardware integrator. The Analytics & Reporting Dashboard connects to your existing production data sources — PLCs, SCADA systems, MES platforms, CMMS databases, ERP systems, and IoT sensor networks — and provides the financial-operational benchmarking framework that enables FMCG plants to measure, compare, and optimize analytics expenditure. The Shift Logbook captures shift team daily reports, production logs, quality inspection findings, and maintenance notes alongside the analytics cost data, creating a unified data fabric that correlates analytics investment with operational outcomes.
Benchmarking Metric
Data Sources
iFactory Analytics Output
Business Impact
Cost Per Unit Produced
Production counts · analytics OPEX · sensor count
Per-line cost-per-unit trend · peer comparison
10–25% analytics cost reduction
Analytics % of RAV
Asset register · depreciation schedule · analytics spend by asset class
Active data streams · pipeline costs · cloud storage
Utilization heatmap · decommission candidates
20–30% infrastructure savings
Analytics Cost Benchmarking Use Cases for FMCG Plants
Production Analytics
OEE Dashboard Cost Optimization Across Packaging Lines
Continuous
High-speed packaging lines — running 400 to 1,200 units per minute — generate the most sensor data and have the highest analytics infrastructure cost in any FMCG plant. iFactory's Analytics & Reporting Dashboard tracks the cost of OEE analytics per packaging line — including downtime tracking sensors, speed monitoring telemetry, quality check data streams, and the dashboards consuming that data — and compares each line's analytics spend against its OEE performance contribution. Plants using the dashboard identify lines where analytics costs exceed $0.15 per unit with no corresponding OEE improvement, enabling data-driven decisions to rationalize sensor deployment, consolidate redundant dashboards, and redirect analytics investment toward the lines where additional intelligence will drive the greatest throughput gain.
FMCG plants manage assets ranging from $20K conveyors to $2M filling machines, yet most apply uniform analytics coverage rather than investing proportionally to asset criticality and replacement value. iFactory's RAV-based analytics benchmarking model segments each asset class by replacement value, production criticality, and current analytics investment — producing an investment gap heatmap that shows which high-value assets are under-digitized and which low-criticality assets are over-instrumented. The dashboard provides peer-comparison data showing how similar FMCG plants allocate analytics spend across their asset portfolio, enabling facilities teams to rebalance investment toward the assets where analytics-enabled condition monitoring and predictive maintenance will deliver the highest ROI.
Labor-to-Material Ratio Optimization Through Shift Logbook Automation
Continuous
The Shift Logbook within iFactory's platform automatically captures shift reports, production logs, quality data, and maintenance records — eliminating the manual data entry, spreadsheet compilation, and custom report generation that drives labor costs above 60% of total analytics expenditure. Plants deploying the Shift Logbook integration reduce analytics labor hours by 30 to 50% as shift reports, OEE summaries, and production analytics are generated automatically from live data streams rather than compiled manually by operators and supervisors. The labor-to-material ratio dashboard tracks the shift from personnel-heavy analytics operations toward platform-automated intelligence, providing monthly reporting on labor cost reduction progress against best-in-class 35:65 targets.
Analytics labor cost reduction through Shift Logbook automation and platform-based reporting
Labor-to-material ratio shifts toward best-in-class
20-30%
Infrastructure savings from decommissioning unused data streams and redundant sensor coverage
Spend per data point optimization
1.2-2.0%
Target analytics spend as percentage of RAV for efficient FMCG plants
Industry benchmark for balanced analytics investment
FAQ
iFactory's Analytics & Reporting Dashboard integrates with your ERP system for cost data (software licensing, cloud infrastructure charges, sensor hardware depreciation), your CMMS for asset register and RAV information, your payroll or HR system for analytics personnel allocation, and your production data platform for OEE and throughput metrics. The platform automatically maps these financial data sources to operational metrics — production units, asset criticality, data stream counts — to produce the benchmarking analytics without manual data extraction or spreadsheet consolidation.
iFactory aggregates anonymized analytics cost benchmarking data from its global manufacturing platform installation base, segmented by FMCG sub-sector (food and beverage, personal care, home care, packaged goods), plant size (production volume and RAV ranges), and sensor density (low, moderate, high). Benchmarks include cost per unit produced by quartile, analytics as % of RAV by asset class, labor-to-material ratio distributions, and spend per data point ranges — updated quarterly as the platform dataset grows.
Initial deployment typically requires 4 to 8 weeks depending on the number of financial and operational data sources being integrated. The first benchmarking reports — cost per unit produced by line, analytics % of RAV by asset class, labor-to-material ratio, and spend per data point — are available within 2 weeks of data source connection. The continuous data ingestion model means benchmark reports update automatically as new financial and operational data flows into the platform.
Yes. iFactory's multi-plant analytics dashboard enables enterprise-level benchmarking across all FMCG facilities, comparing analytics cost profiles, dashboard utilization rates, labor-to-material ratios, and spend per data point across plants. Enterprise customers use the dashboard to identify high-cost plants that need analytics rationalization and low-cost plants that may be under-investing in intelligence, enabling consistent analytics governance and investment allocation across the manufacturing network.
Yes. The Analytics & Reporting Dashboard includes an optimization engine that analyzes your plant's benchmarking profile against peer-group data and generates prioritized recommendations — dashboard consolidation candidates, low-utilization data streams recommended for decommissioning, automation opportunities to reduce labor-to-material ratio, and RAV-weighted investment rebalancing suggestions. Each recommendation includes estimated cost impact and implementation effort to help plant managers build data-driven analytics optimization roadmaps.
Deploy iFactory for FMCG Analytics Cost Benchmarking
AI-powered Analytics & Reporting Dashboard connecting production data, financial systems, asset registers, and shift operations into one unified benchmarking intelligence layer — with cost-per-unit tracking, RAV-based investment analysis, labor-to-material ratio optimization, Shift Logbook automation, and peer-group comparison against the iFactory global manufacturing network.