
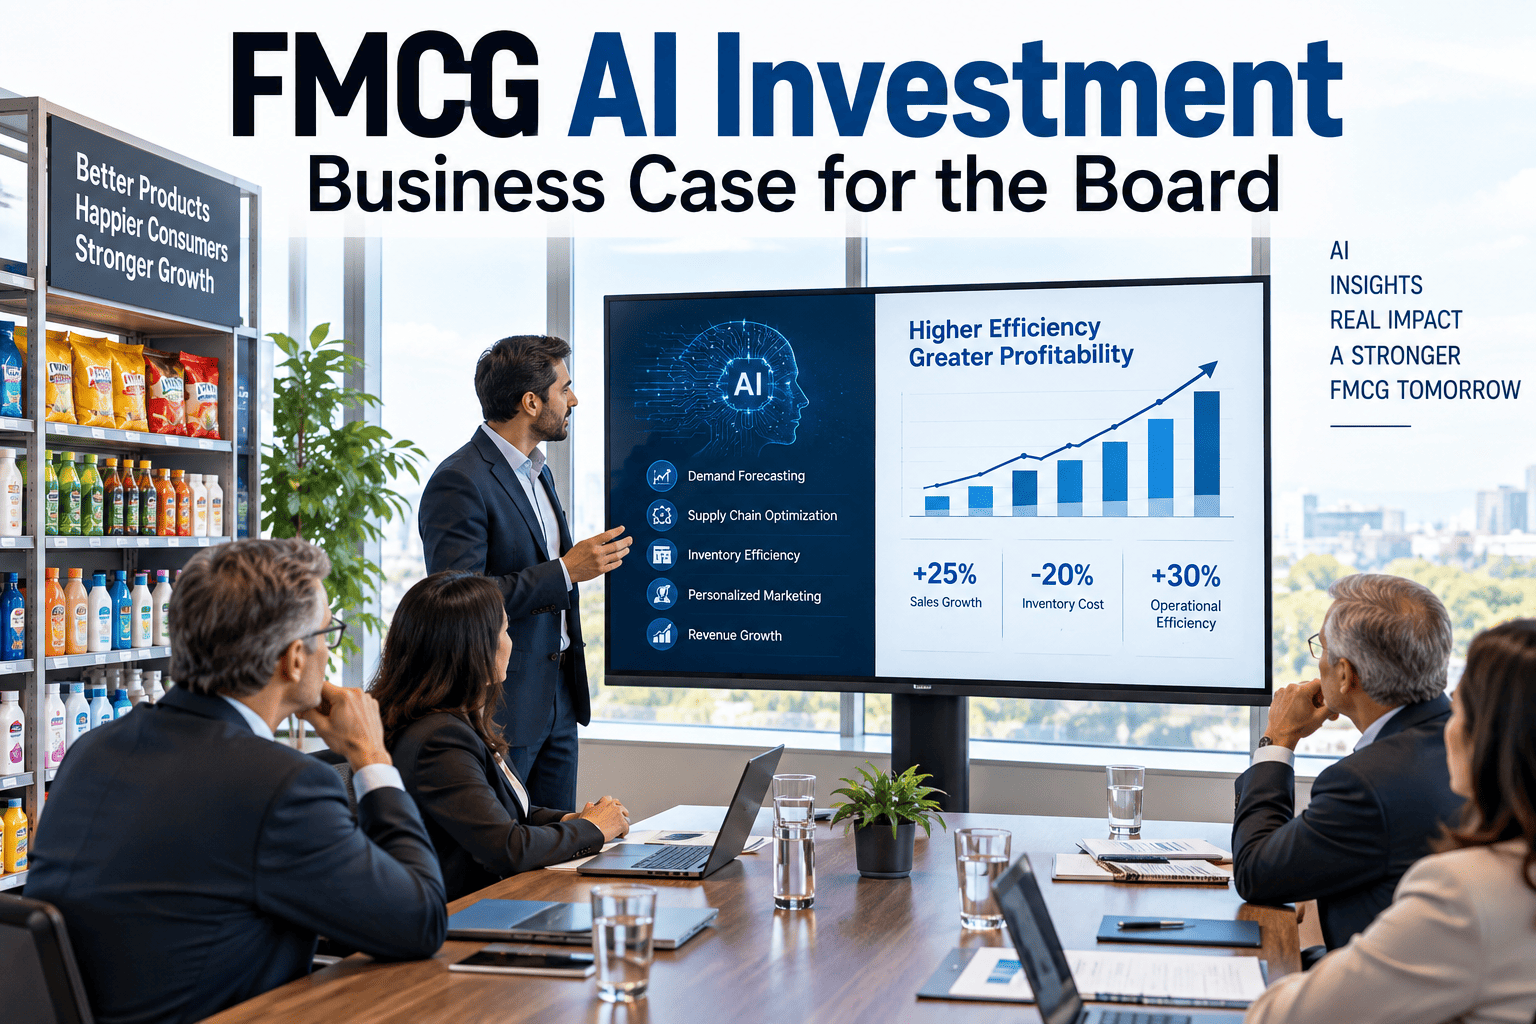
A plant director at a mid-sized FMCG company proposes a $480,000 analytics platform investment to the executive leadership team. The CFO asks for the payback period. The COO asks how it affects OEE. The CEO asks what happens if they wait another year. The plant director has four slides and twelve minutes to answer all three questions — and the data to support the answers must survive scrutiny from finance, operations, and IT. This scenario repeats across hundreds of FMCG organisations every budget cycle, and the outcome depends on a single factor: whether the plant director can present an analytics ROI model that connects technology cost to operational savings in a language the executive team trusts. iFactory AI's analytics platform for FMCG manufacturing addresses this budgeting challenge not only by delivering the operational improvements that generate the ROI, but by providing the data infrastructure that makes the ROI measurable, auditable, and defensible in the boardroom. This guide covers the budgeting framework, ROI calculation methodology, payback analysis, and executive presentation structure that turns a technology investment proposal into a leadership-approved capital expenditure. Book a Demo to see the iFactory AI analytics platform configured for your FMCG operation, or use the ROI framework below to build your own technology investment business case.
The FMCG Analytics ROI Framework — Five Benefit Categories and Three Cost Components
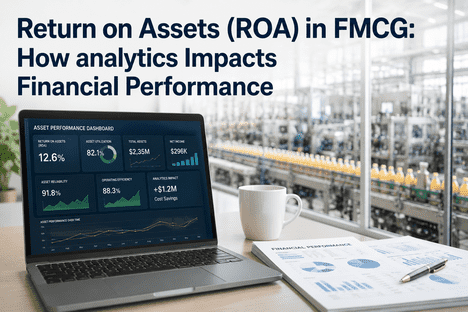
A defensible analytics ROI model for FMCG manufacturing rests on five quantifiable benefit categories and three cost components. The five benefit categories are: reduction in unplanned downtime through predictive maintenance, improvement in OEE through real-time performance tracking, reduction in waste and rework through quality analytics, reduction in manual data collection and reporting labour, and avoidance of compliance penalties through automated audit trail generation. The three cost components are: software platform licensing and subscription fees, implementation and integration services, and ongoing support and training costs. Each benefit category is calculated using the facility's own baseline data — not industry averages — because the executive team will challenge any assumption that cannot be traced to the facility's actual production records. iFactory AI's platform includes a built-in ROI tracking module that captures baseline performance data before deployment and compares it against post-deployment results in real time, generating the audit trail that makes each benefit claim verifiable.
| Benefit Category | Savings Source | Typical Annual Impact (per line) | Data Source for Baseline | Verification Method |
|---|---|---|---|---|
| Downtime Reduction | Predictive maintenance alerts prevent unplanned breakdowns; 30-50% reduction in reactive maintenance events | $85,000–$210,000 | CMMS historical work orders, downtime logs, Shift Logbook records | Month-over-month comparison of MTBF and downtime hours post-deployment |
| OEE Improvement | Real-time performance tracking reduces minor stops and speed losses; 8-20 point OEE gain typical | $120,000–$350,000 | Production records, line speed data, shift output reports | OEE dashboard tracks availability, performance, and quality components continuously |
| Waste & Rework Reduction | Predictive quality analytics flag process deviations before non-conforming product is produced; 20-40% scrap reduction | $60,000–$180,000 | Quality control records, scrap reports, rework labour logs | First-pass yield trend and scrap cost per SKU tracked in analytics dashboard |
| Labour Efficiency | Automated data collection and reporting eliminates manual logbooks, spreadsheet consolidation, and report generation | $40,000–$95,000 | Time allocation studies, administrative headcount, reporting frequency | Hours saved per shift tracked via Shift Logbook usage analytics |
| Compliance & Risk Avoidance | Automated audit trails eliminate non-compliance penalties and reduce audit preparation labour by 60-80% | $25,000–$110,000 | Audit preparation hours, compliance penalty history, documentation gaps | Audit cycle time, compliance score, penalty avoidance tracked per period |
Cost-Benefit Analysis — Building the Three-Year Projection
A three-year cost-benefit projection is the standard analytical framework that FMCG executive teams expect when evaluating analytics technology investments. The projection covers three cost components and five benefit categories across a 36-month time horizon, with separate columns for year one, year two, and year three to account for implementation ramp-up, benefit acceleration, and ongoing operational costs. The net present value calculation discounts future cash flows at the organisation's weighted average cost of capital — typically 8-12% for FMCG manufacturers — to reflect the time value of money. The internal rate of return is calculated as the discount rate at which the net present value equals zero, and the payback period is the point at which cumulative benefits exceed cumulative costs. iFactory AI's platform provides a built-in ROI calculator that generates this three-year projection automatically from the facility's baseline data, producing a dashboard-ready output that can be exported directly into the executive presentation deck.
I presented the iFactory AI analytics platform to our CFO with a three-year projection showing $640,000 in cumulative benefit against a $310,000 total investment — a 2.06x ROI with a nine-month payback. The CFO's first question was whether the baseline downtime data came from our CMMS or from operator estimates. Because iFactory's Shift Logbook had captured 14 months of verified downtime records with reason codes and timestamps, I could show exactly which lines, which shift patterns, and which failure categories the projection was based on. The approval came through in the same meeting. Eighteen months later, our actual ROI is tracking at 2.3x against the projected 2.06x — the platform over-delivered because the predictive maintenance model identified a recurring conveyor bearing failure pattern that we had never connected across shift reports.
— Plant Director, FMCG Manufacturer — Three-Line Analytics Deployment, Year-Two Actual ROI 2.3x Against 2.06x ProjectionThe Executive Presentation — Structuring the Analytics Investment Case for Leadership
The executive presentation for an analytics technology investment follows a four-slide structure that addresses each leadership stakeholder's primary concern. Slide one presents the current state: the facility's OEE baseline, downtime trend, waste cost, and compliance labour hours — each data point sourced from the facility's own production records with the source identified and the calculation methodology documented. Slide two presents the solution: the iFactory AI platform architecture, deployment timeline, and total cost of ownership across three years with separate line items for licensing, implementation, and support. Slide three presents the financial projection: the three-year cost-benefit analysis with NPV, IRR, and payback period calculated using the organisation's standard financial model. Slide four presents the risk assessment and mitigation plan: the three most significant implementation risks — data integration complexity, operator adoption resistance, and benefit realisation timing — with specific mitigation strategies and a governance framework for tracking actuals against projections. iFactory AI provides this four-slide executive presentation template pre-populated with the platform's standard ROI data, customised to the facility's baseline metrics during the platform evaluation process. Talk to an expert to receive the iFactory AI executive presentation template configured for your FMCG operation.
Budgeting for Analytics — CapEx vs OpEx and the Total Cost of Ownership Model
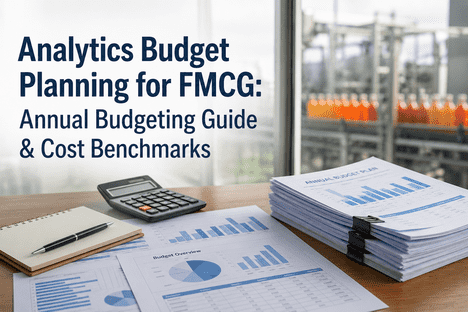
FMCG organisations typically evaluate analytics technology investments through either a capital expenditure framework or an operational expenditure framework, and the choice significantly affects the approval process and the perceived ROI. CapEx treatment capitalises the platform as a fixed asset with depreciation over a three-to-five year useful life, which spreads the cost across multiple budget cycles but requires a formal capital appropriation request with board-level approval for investments above a threshold — typically $250,000 for mid-sized FMCG manufacturers. OpEx treatment classifies the platform as a monthly or annual subscription, which avoids the capital approval threshold entirely and allows the investment to be approved at the plant director or operations VP level, but the recurring cost appears on the P&L as an operating expense that reduces EBITDA in each period. iFactory AI supports both budgeting structures with flexible deployment options: an on-premise perpetual license with annual maintenance for CapEx treatment, and a SaaS subscription with monthly or annual billing for OpEx treatment. The three-year total cost of ownership is comparable between the two models, but the OpEx subscription model typically accelerates approval cycles by four to eight weeks because it avoids the capital appropriation process.
Risk-Adjusted ROI — Accounting for Implementation Uncertainty in the Financial Model
CFOs and finance teams evaluating analytics technology investments will apply a risk adjustment to the projected benefits before approving the investment. The standard approach is to apply a probability-weighted discount to each benefit category based on the organisation's experience with similar technology deployments. A conservative risk adjustment applies a 15-25% discount to year-one benefits (reflecting implementation ramp-up uncertainty), a 5-10% discount to year-two benefits (reflecting model maturity uncertainty), and no discount to year-three benefits (reflecting proven operation). A more sophisticated approach applies Monte Carlo simulation to the benefit projection, modelling each benefit category as a probability distribution rather than a single point estimate. iFactory AI's ROI tracking module supports risk-adjusted projections by generating actual-versus-projected benefit reports at monthly intervals, enabling the finance team to track the accuracy of the original projection against realised results and adjust the risk adjustment factors for future investment cycles.
Conclusion — From Budget Proposal to Approved Investment
Justifying analytics technology investments to FMCG leadership is not a persuasion exercise — it is a financial analysis exercise that demands auditable baseline data, defensible benefit calculations, and a clear payback timeline presented in the language of ROI, NPV, and IRR that the executive team already uses for every capital decision. The plant director or operations leader who arrives at the budget meeting with a three-year cost-benefit projection built from the facility's own production records — downtime data from the Shift Logbook, OEE baselines from production reports, waste costs from quality records — speaks the same analytical language as the CFO and the COO, and the technology investment is evaluated on its financial merits rather than its technical appeal.
iFactory AI's analytics platform provides the ROI tracking infrastructure that makes this possible — not only delivering the operational improvements that generate the savings, but capturing the baseline data, tracking the realised benefits, and generating the audit trail that makes the business case defensible before and after deployment. The platform's built-in ROI calculator, Shift Logbook integration, and automated benefit tracking module ensure that every dollar of projected savings can be traced to a specific operational metric that the platform measures continuously.
Book a Demo to receive the iFactory AI FMCG analytics ROI calculator, three-year projection model, and four-slide executive presentation template configured for your facility. Or talk to an expert about a free analytics investment assessment that includes baseline data collection, ROI projection, and a draft executive presentation for your next budget cycle.
![predictive-analytics-roi-calculator-for-fmcg-[free-tool]](./manage-post-2k26/uploads/predictive-analytics-roi-calculator-for-fmcg-[free-tool].png)