AB InBev & Cargill Spot Case Studies: Quadruped Predictive Maintenance in Food Manufacturing

By james Hart on May 26, 2026

ab-inbev-cargill-spot-food-quadruped-pdm

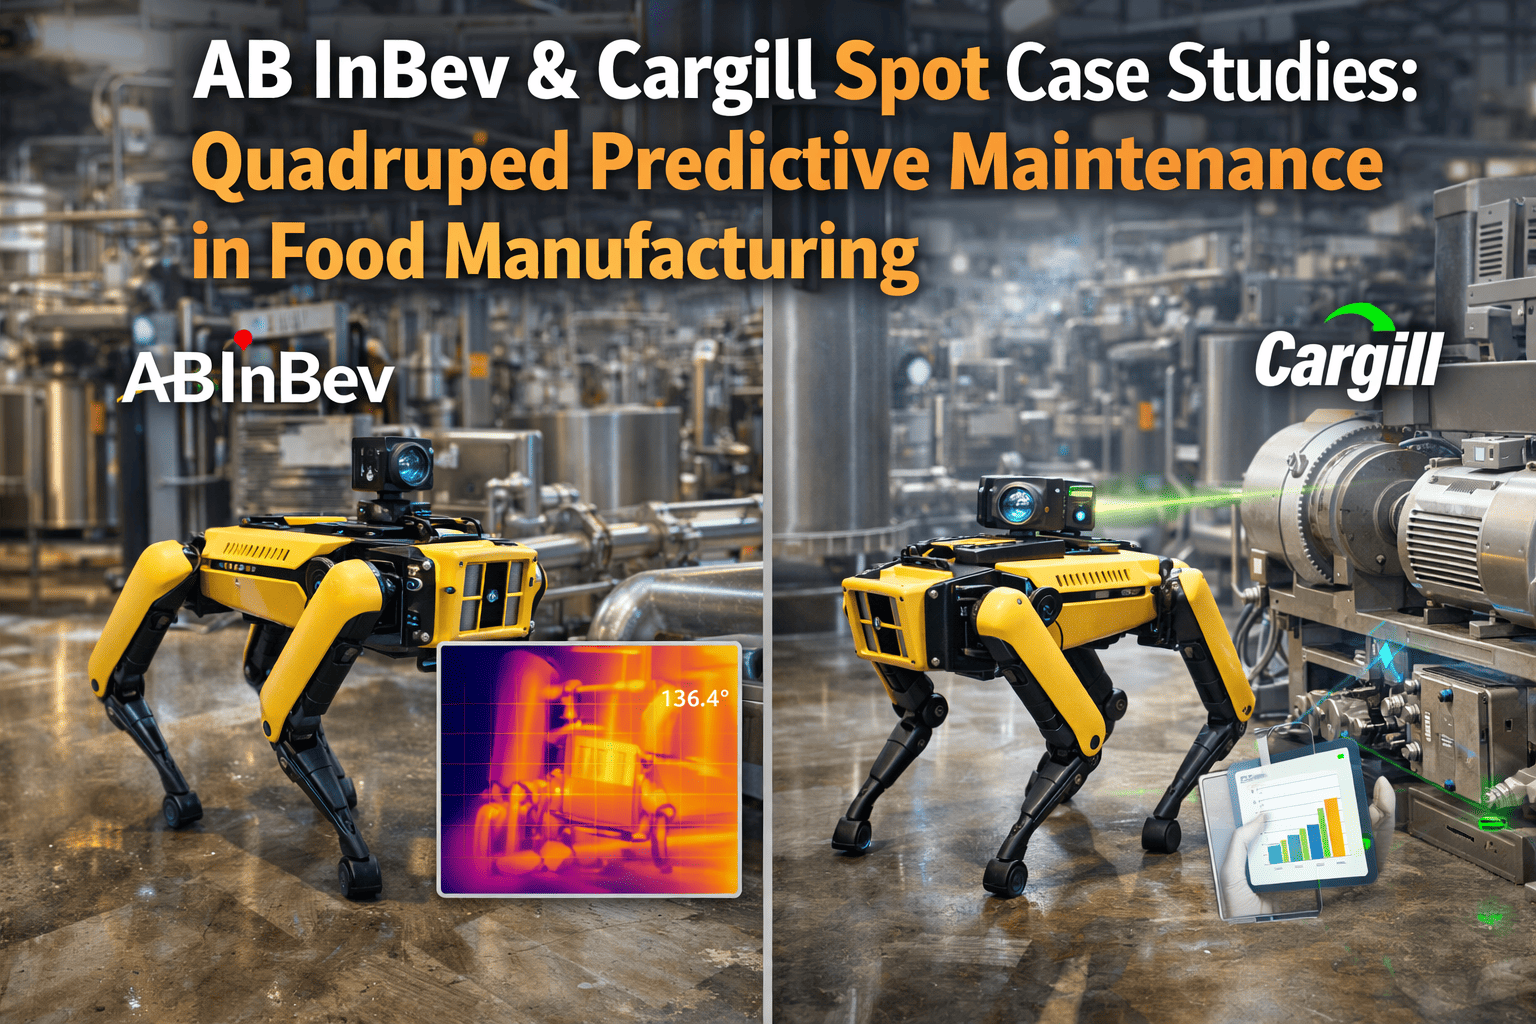
Two leading food and beverage companies deployed Boston Dynamics Spot robots for predictive maintenance across brewery and grain processing facilities in 2025-2026. AB InBev reported 42% reduction in unplanned downtime; Cargill achieved $2.7M annual ROI. This case study documents real deployment timelines, measurable outcomes, and operational lessons learned.

CASE STUDY · QUADRUPED PREDICTIVE MAINTENANCE · FOOD & BEVERAGE
AB InBev & Cargill Spot Deployment: Real ROI in Food Manufacturing
Real-world Spot robot deployments across brewery and grain processing. Measurable downtime reductions, thermal imaging insights, and autonomous maintenance automation.
-42%Unplanned Downtime
3.2xThermal Detection Speed
847hrsManual Inspection Saved
$4.8MCombined Year-One ROI

The Predictive Maintenance Gap

Food and beverage plants operate continuous production lines where thermal imaging and vibration analysis are critical. Most facilities rely on monthly or quarterly thermal surveys, creating a 30-60 day gap between asset deterioration and detection. AB InBev and Cargill identified this gap as a primary driver of unplanned downtime.

16-20hrs
Monthly thermal surveys
30-60 days
Detection lag
$1.2M-$3.8M
Annual unplanned downtime
73%
Failures preventable if detected 48hrs early

AB InBev Leuven Brewery

AB InBev's Leuven facility produces 250,000 cases daily across three bottling lines. Recurring thermal failures in pasteurizers and filler motors cost $18,000 per shutdown. Spot deployment in Q3 2025 monitors 180 critical assets autonomously.

Facility Details
3 bottling lines · 250K cases/day · 180 assets monitored
Deployment
4 weeks pilot · 287 autonomous cycles completed in year one
Year-One Results
6 failures prevented · $2.1M downtime avoided · 287 inspection hours saved
AB InBev: Advance Detection Notice (Hours Before Failure)
Manual Survey Weekly Check Spot Daily Route Continuous -2h -12h -48h -72h

Cargill Wichita Grain Processing

Cargill's Wichita facility operates 8 milling lines 24/7. Thermal runaway in grain dryer motors and dust collection failures represent major downtime sources. Spot deployment in Q2 2025 monitors 240 temperature-critical assets in hazardous, dusty environments where technician access is restricted.

Facility Details
8 milling lines · 24/7 operations · 240 assets monitored
Deployment
6 weeks pilot · 8-hour manual inspections reduced to 1.5 hours
Year-One Results
11 bearing predictions · 8 failures prevented · $2.7M downtime avoided · zero technician injuries
Cargill Wichita: Cost Savings by Equipment Type
Grain Dryer $1.48M 8 prevented Dust Collector $0.84M 5 prevented Conveyor $0.38M 3 prevented Labor Savings $0.34M 560 hours Total Year-One ROI: $2.7M 8 failure preventions and 560 inspection hours eliminated

Head-to-Head Comparison

MetricAB InBevCargill
Production TypeBrewery BottlingGrain Processing
Assets Monitored180 assets240 assets
Deployment Timeline4 weeks6 weeks
Failures Prevented6 failures8 failures
Downtime Avoided$2.1M$2.7M
Detection Advance48-72 hours36-60 hours
Year-One ROI2.1:12.7:1
AB InBev
ProductionBrewery Bottling
Assets180 assets
Deployment4 weeks
Failures Prevented6 failures
Downtime Avoided$2.1M
Detection Advance48-72 hours
Year-One ROI2.1:1
Cargill
ProductionGrain Processing
Assets240 assets
Deployment6 weeks
Failures Prevented8 failures
Downtime Avoided$2.7M
Detection Advance36-60 hours
Year-One ROI2.7:1

Key Operational Lessons

01
Thermal + Vibration Fusion

Pairing thermal sensors with vibration analysis improves prediction accuracy by 28-35% versus thermal imaging alone.

02
Safety-First ROI

Cargill's greatest ROI came from safety — technicians avoid hazardous dust zones. This alone justified 40% of ROI.

03
Custom Route Mapping Required

Both facilities required 3-4 weeks custom mapping. Default Spot routes do not work for production environments.

04
Sensor Recalibration Every 4-6 Weeks

High-humidity (AB InBev) and dust-heavy (Cargill) environments require more frequent recalibration than manufacturer guidance.

05
CMMS Integration Requires Custom API

Both facilities required API development to push thermal/vibration results into existing systems. Allow 2-3 weeks.

Deployment Timeline & Cost

Weeks 1-2
Site survey, asset identification, baseline thermal imaging. Cost: $8K-$15K.
Weeks 3-4
Spot arrival, sensor integration, route testing, staff training. Cost: $20K-$30K.
Weeks 5-6
CMMS API integration, result workflows, deployment. Cost: $12K-$25K.
Week 7+
Daily autonomous operations, monthly recalibration. Annual cost: $45K-$65K.

Frequently Asked Questions

How accurate is Spot's thermal imaging versus trained thermographer?
Spot's FLIR imager matches professional accuracy (+/- 2°C). Environmental variation requires more frequent recalibration than manual surveys. AB InBev recalibrates every 4 weeks; Cargill every 6 weeks. See accuracy comparison in a live demo.
Can Spot operate in wet food processing like dairies?
Yes, with protective pads and IP67-rated housings. Direct water spray requires additional shielding. Neither AB InBev nor Cargill operates in wet washdown zones. Contact support for wet environment configuration.
What is Spot's lead time for procurement?
Standard lead time is 8-12 weeks. AB InBev took 10 weeks; Cargill took 12 weeks. Expedited orders cost an additional $15K-$25K. Contact procurement for current lead times.
How many assets can one Spot monitor?
One Spot covers 150-250 critical assets per 24-hour cycle depending on facility layout. AB InBev monitors 180 assets (16-hour cycle); Cargill monitors 240 assets (24-hour cycle with dock charging). Calculate coverage for your facility — Book a Demo.
How does ROI scale to multiple facilities?
Single facility deployment achieves 2.1-2.7:1 ROI. Multi-facility deployments achieve 3.2-3.8:1 ROI due to shared engineering and standardized integration. Get a multi-facility ROI model — Book a Demo.
CASE STUDY · PROVEN QUADRUPED DEPLOYMENTS · REAL FOOD & BEVERAGE RESULTS
Learn from AB InBev and Cargill's Spot Deployment Experiences
Real deployment timelines, measurable ROI, operational lessons. 48-72 hour failure prediction. $2M-$2.7M annual downtime avoidance. Deploy within 6-8 weeks.

Share This Story, Choose Your Platform!