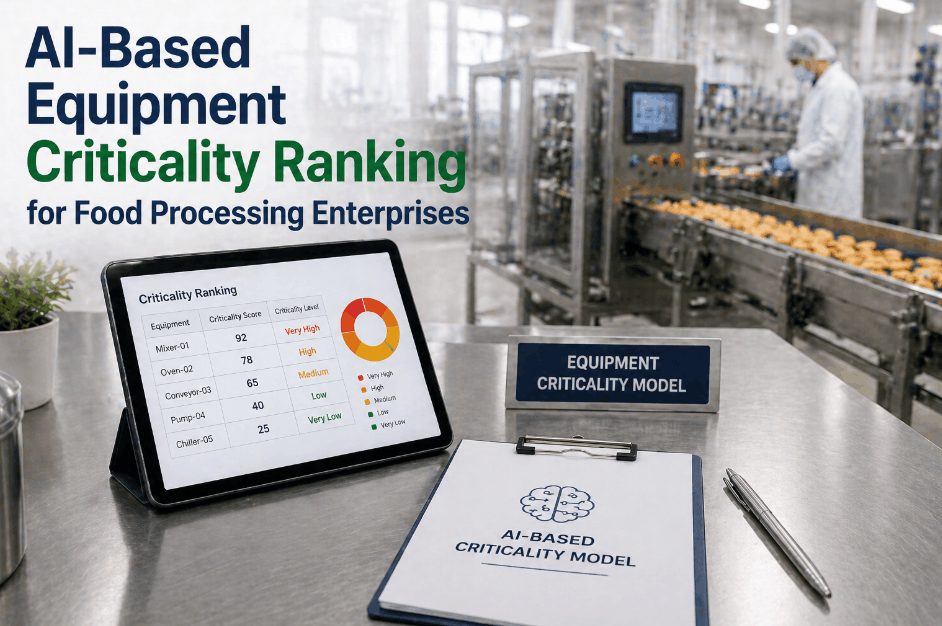
In food processing enterprises, not all machines carry equal risk — yet most maintenance teams allocate resources as if they do. AI-based equipment criticality ranking changes this by applying machine learning and real-time condition data to generate a dynamic, risk-weighted hierarchy of every asset on the production floor. From pasteurizers and homogenizers to high-speed packaging lines and CIP systems, the platform continuously scores each machine based on failure likelihood, production impact, safety exposure, and regulatory consequence. If your facility is still relying on static FMEA spreadsheets or gut-feel prioritization, Book a Demo to see how AI-driven criticality analysis transforms your maintenance planning from reactive to precision-driven.
ASSET CRITICALITY · PREDICTIVE MAINTENANCE · FOOD PROCESSING AI
Rank Every Asset by Risk Before Failure Strikes
Deploy AI-powered criticality scoring across your entire food processing facility and focus maintenance resources where they deliver maximum production and safety impact.
Why Static Criticality Analysis Fails in Modern Food Manufacturing
Traditional reliability centered maintenance programs assign criticality scores once — during an initial FMEA workshop — and rarely revisit them unless a major incident forces a review. This static model is fundamentally incompatible with modern food processing environments where production schedules shift weekly and equipment ages at different rates across multi-line facilities. AI-based asset criticality ranking addresses this gap by treating equipment scoring as a continuous, data-driven process: sensors feeding real-time vibration, temperature, and motor load data allow the system to update risk scores automatically as operating conditions evolve, surfacing asset risks that legacy FMEA documentation had classified as low-priority for years. Facilities that Book a Demo consistently discover hidden failure risks within the first 30 days of deployment.
How AI Calculates Equipment Criticality in Food Plants
The intelligence behind modern criticality analysis software lies in its ability to synthesize multiple risk dimensions simultaneously. Rather than assigning a single failure severity score, the AI model weights each asset across five independent risk axes and combines them into a composite criticality index that maintenance planners can act on immediately.
Production Impact Score
Quantifies the direct yield loss per hour of unplanned downtime on each asset, weighted by downstream line dependency. A single filler failure that stops four packaging lanes scores exponentially higher than an isolated auxiliary pump.
Safety and Compliance Risk
Rates the probability that failure triggers a food safety event, HACCP deviation, or FDA/FSMA regulatory non-conformance. CIP pump failures and pasteurizer temperature excursions carry the highest weighting in this dimension.
Failure Probability Index
Uses sensor telemetry and equipment age curves to compute a real-time probability of failure within the next 30, 60, and 90-day windows. Bayesian models are retrained monthly against actual failure history across your asset fleet.
Maintenance Cost Exposure
Estimates the total corrective maintenance cost including parts, labour, and secondary damage if the asset fails without warning. Assets with long lead-time spares or specialized repair contractors receive escalated scores automatically.
Redundancy and Backup Availability
Assesses whether a standby asset or manual workaround exists. Single-point-of-failure equipment with no backup receives the maximum risk multiplier, pushing it to the top of the maintenance priority queue.
Environmental and Waste Impact
Scores the batch spoilage and raw material waste exposure tied to each failure mode. For high-value ingredients like dairy proteins, confectionery bases, or specialty flavors, this dimension often dominates the overall criticality index.
Asset Criticality Tiers: Translating AI Scores into Maintenance Action
Effective enterprise asset management software translates composite criticality indices into actionable maintenance tiers that maintenance planners can work from without needing to interpret raw model outputs. The following tiering structure is used by leading food processing operators that have deployed AI criticality ranking across their multi-site networks. Book a Demo to review how iFactory maps these tiers into automated work order triggers and spare parts pre-positioning alerts.
| Criticality Tier |
AI Score Range |
Maintenance Strategy |
Inspection Frequency |
Typical Food Plant Assets |
| Tier 1 — Mission Critical |
85 – 100 |
Continuous condition monitoring + predictive alerts |
Real-time sensor streaming |
Pasteurizers, Homogenizers, Primary Fillers |
| Tier 2 — High Impact |
65 – 84 |
Scheduled CBM with 30-day predictive horizon |
Weekly automated health reports |
CIP Pumps, Centrifuges, Conveyor Drives |
| Tier 3 — Moderate Risk |
40 – 64 |
Time-based preventive maintenance |
Bi-weekly manual inspection |
Auxiliary Chillers, Secondary Conveyors |
| Tier 4 — Low Criticality |
20 – 39 |
Run-to-fail or periodic lubrication |
Monthly visual check |
Utility Pumps, Non-Process Fans, Lighting |
| Tier 5 — Non-Critical |
0 – 19 |
Reactive corrective maintenance only |
On-failure basis |
Ancillary HVAC units, Storage Rack Motors |
Integrating Criticality Rankings with Predictive Maintenance Software
Asset criticality ranking delivers its highest ROI when tightly integrated with a predictive maintenance software platform rather than existing as a standalone report. When AI-generated criticality scores dynamically weight alert thresholds inside a condition monitoring system, a Tier 1 asset near its failure ceiling triggers alerts at lower deviation thresholds than the same anomaly on a Tier 4 machine — eliminating both missed failures and nuisance alert fatigue. This also transforms maintenance planning software into a decision support engine: when the system identifies a retort chamber at 78% 30-day failure probability, it auto-schedules the maintenance window, generates a parts requisition, and notifies the reliability engineer before the next production run. Facilities that Book a Demo routinely reduce unplanned downtime by 35 to 50% within the first year.
Criticality-Driven Maintenance: ROI Benchmarks for Food Enterprises
Quantifying the financial return on AI-based equipment criticality ranking is straightforward when the platform tracks the before-and-after impact of prioritization decisions. The following performance benchmarks reflect published outcomes from food and beverage manufacturers deploying industrial analytics platforms with integrated criticality ranking modules.
42%
Reduction in unplanned downtime within 12 months of AI criticality deployment
3.8x
Average ROI achieved versus traditional time-based maintenance programs
28%
Decrease in total maintenance spend through optimized parts stocking strategy
91%
Alert accuracy rate for Tier 1 asset failure prediction at 30-day horizon
Risk-Based Maintenance vs. Traditional FMEA: A Structural Comparison
Food processing enterprises evaluating the transition to AI-driven asset intelligence frequently ask how risk based maintenance software differs from their existing reliability-centered maintenance documentation. The core distinction lies in dynamism: classical FMEA produces a point-in-time snapshot while AI risk-based maintenance generates a continuously updated risk model that responds to real operating data. Book a Demo to see a side-by-side demonstration of how iFactory's criticality engine outperforms manual FMEA in early fault detection across dairy and beverage processing lines.
Average Downtime Cost by Asset Category in Food Processing Plants
One of the most compelling outputs of AI-based equipment criticality ranking is the quantification of downtime cost exposure per asset category. When the platform cross-references historical failure records with production throughput and material cost data, it generates a per-asset financial impact profile that directly feeds the criticality score weighting. The chart below reflects industry-aggregated benchmarks across food and beverage processing facilities — giving maintenance leaders a reference point for understanding which asset classes carry the highest financial risk per hour of unplanned failure. Book a Demo to generate a facility-specific version of this analysis for your plant.
Estimated Downtime Cost per Hour by Asset Type (USD)
Based on industry benchmarks across dairy, beverage, and packaged food operations
Retort / Sterilization Chamber
High-Speed Conveyor Drive
Packaging & Labelling Line
Chart values represent median unplanned downtime cost including lost production, spoilage, and emergency labour. Figures vary by facility size, product value, and regional labour rates.
Maintenance Budget Reallocation: Before vs. After AI Criticality Deployment
One of the most measurable outcomes of deploying an AI-based criticality ranking platform is the structural shift it drives in how maintenance budgets are allocated across reactive, preventive, and predictive strategies. In facilities operating without criticality intelligence, the majority of the maintenance budget is consumed by unplanned reactive repairs — leaving little capacity for strategic asset care. After AI criticality deployment, the budget profile inverts: predictive and condition-based maintenance absorbs the larger share while reactive spending collapses. This reallocation is the financial signature of operational risk management done right.
Reactive (Unplanned)
Preventive (Scheduled)
Predictive / CBM
Before AI Criticality
58% Reactive
30% Preventive
12%
After AI Criticality
14%
28% Preventive
58% Predictive / CBM
↓ 44pts
Drop in reactive maintenance budget share after AI criticality deployment
↑ 46pts
Rise in predictive and CBM budget allocation within 18 months
↓ 28%
Overall maintenance cost reduction driven by eliminating unplanned failures
Frequently Asked Questions: AI Criticality Ranking in Food Processing
How long does it take to generate the first AI criticality ranking for a food plant?
Initial criticality scores are generated within 72 hours of sensor network commissioning and ERP data integration. The AI model produces a preliminary ranking using historical failure records and process parameters, then refines scores continuously as live sensor data accumulates over the first 30 days of operation.
Can the platform rank assets across multiple production lines and facilities simultaneously?
Yes. The enterprise asset management software architecture supports multi-site criticality ranking from a unified cloud dashboard. Plant managers at individual facilities see their local asset hierarchy while enterprise reliability teams access a fleet-wide view that identifies systemic risk patterns across all locations.
Does the system account for FSMA and HACCP compliance requirements when scoring assets?
Compliance risk is one of the five core scoring dimensions in the AI model. Assets whose failure modes directly trigger HACCP deviations — such as pasteurizer temperature control systems, CIP chemical dosing pumps, and allergen barrier seals — receive automatic compliance risk multipliers that elevate them into Tier 1 regardless of mechanical failure probability alone.
What data sources does the AI criticality engine require to operate effectively?
The platform ingests data from three primary sources: industrial IoT condition monitoring sensors (vibration, temperature, motor current), maintenance history records from your existing CMMS or ERP, and production schedule data to contextualize operational load. Additional enrichment from spare parts procurement records further sharpens the maintenance cost exposure dimension of the ranking model.
How does the criticality platform handle seasonal production peaks common in food manufacturing?
The AI model is trained to recognize seasonal load patterns and adjusts failure probability forecasts accordingly. During high-throughput periods such as holiday beverage runs or summer dairy campaigns, assets running above their baseline operating load receive elevated short-term risk scores, prompting pre-season maintenance interventions before production intensity peaks.
How does the AI handle newly installed equipment with no historical failure data?
For new assets with no failure history, the platform applies fleet-average failure probability curves derived from similar equipment classes across its global customer database. As real operational data accumulates over the first 60 to 90 days, the model transitions from fleet-average priors to facility-specific posteriors — delivering progressively sharper criticality estimates as the asset matures in the system.
Can reliability engineers manually override AI-generated criticality scores?
Yes. The platform includes a supervised override layer that allows certified reliability engineers to adjust AI-assigned scores based on domain knowledge not captured in sensor data — such as impending capital replacement plans, supplier lead-time constraints, or recent undocumented process changes. All manual overrides are logged with timestamps and justification notes to maintain audit traceability for RCM review cycles.
What is the difference between AI criticality ranking and traditional Reliability Centered Maintenance?
Traditional RCM is a structured methodology for determining maintenance strategies based on failure mode analysis conducted in periodic workshops. AI criticality ranking automates and continuously updates the risk prioritization layer that sits on top of RCM outputs. Rather than replacing RCM, the AI platform operationalizes it — ensuring that the maintenance strategies RCM defines are applied to the right assets at the right time based on current operating conditions rather than theoretical failure models.
Stop Guessing Which Assets Need Attention Next
Let AI-powered criticality ranking tell your maintenance team exactly where to focus — before a food safety incident or unplanned shutdown forces the decision for you.