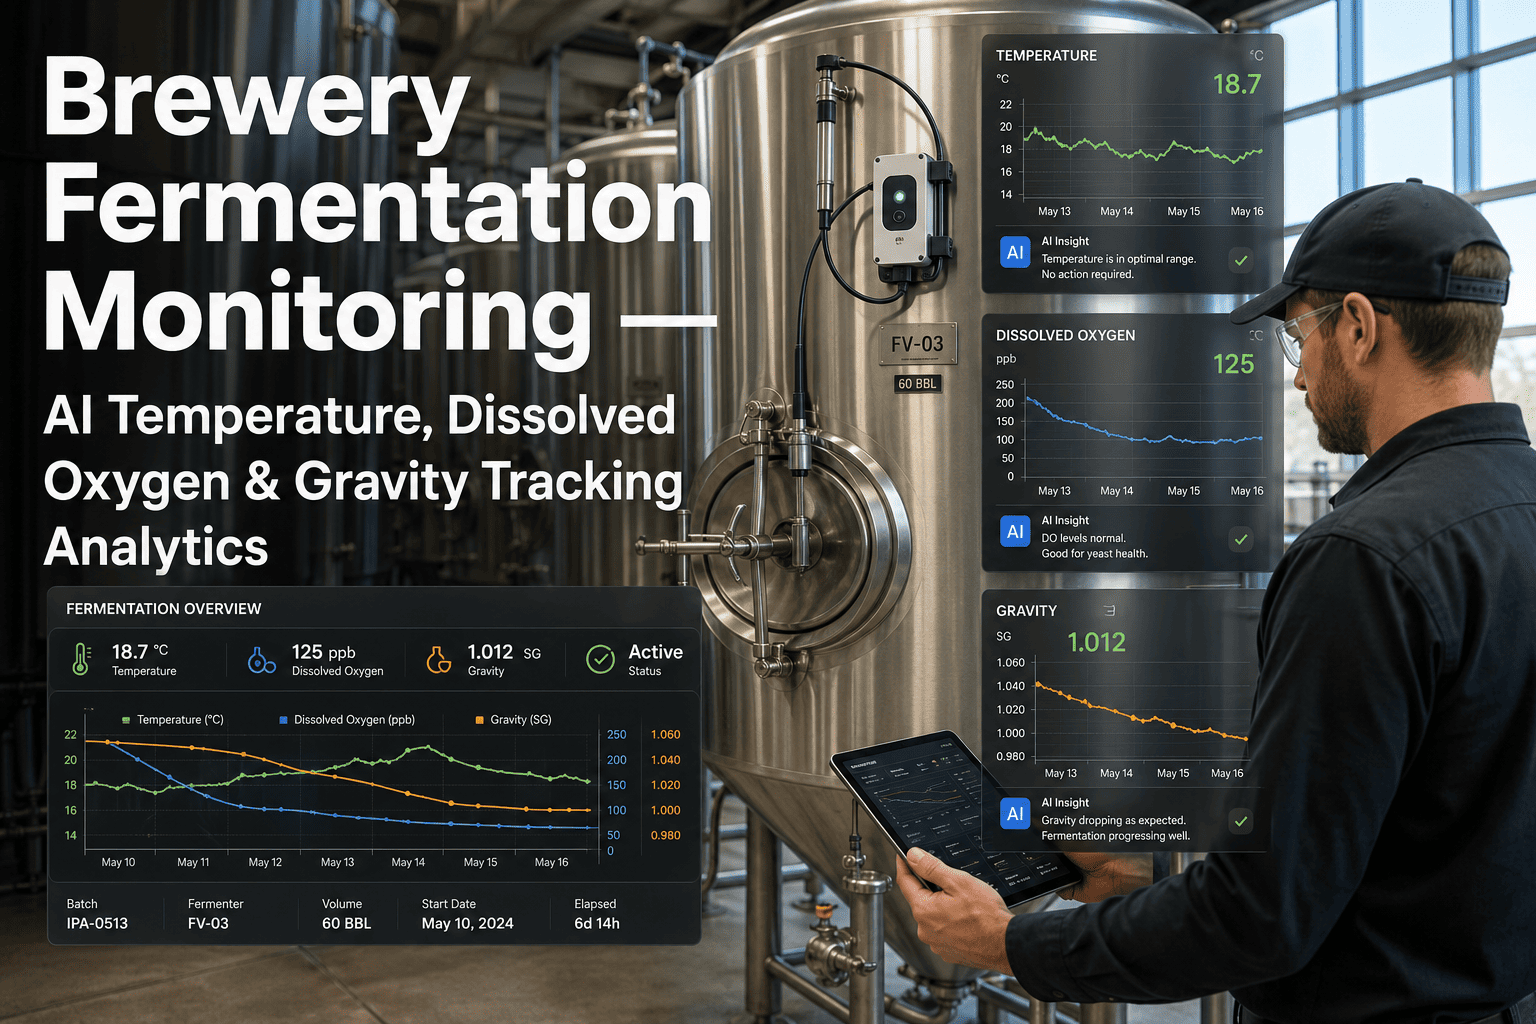
Fermentation is where a brewery's process control either pays off or quietly falls apart, often days before anyone tastes the result. A temperature profile that drifts even slightly outside range can shift flavor development in ways that are difficult to correct once fermentation is underway. Dissolved oxygen levels that creep too high at the wrong stage can stress yeast health, while a gravity reading that plateaus earlier than expected may be the first sign a batch will finish inconsistent with the last one. AI-driven fermentation monitoring tracks all of these signals continuously rather than through periodic manual sampling, giving process engineers the chance to intervene while a batch can still be corrected. Teams looking to tighten this process are increasingly starting with a demo of continuous fermentation tracking on their own tanks.
AI MONITORING FOR BREWERY FERMENTATION
Track Temperature, Oxygen, and Gravity Continuously
Continuous fermentation monitoring gives process engineers early visibility into batch consistency, well before a tasting panel would catch a shift.
Fermentation Signals Worth Watching Continuously
Each of these parameters tells a different part of the fermentation story, and tracking them together builds a fuller picture than any single reading alone.
Temperature Profiling
Continuous temperature tracking across the fermentation curve flags drift that could shift flavor compounds away from the intended profile.
Dissolved Oxygen Control
Oxygen level monitoring at key fermentation stages helps confirm yeast has what it needs early on without excess exposure later in the process.
Gravity Tracking
Continuous specific gravity readings reveal fermentation rate and help confirm attenuation is progressing on the expected schedule.
Yeast Viability Assessment
Tracking yeast health trends across pitches supports more consistent fermentation performance from one batch to the next.
How Fermentation Data Moves From Tank to Decision
1
Continuous Tank Sensing
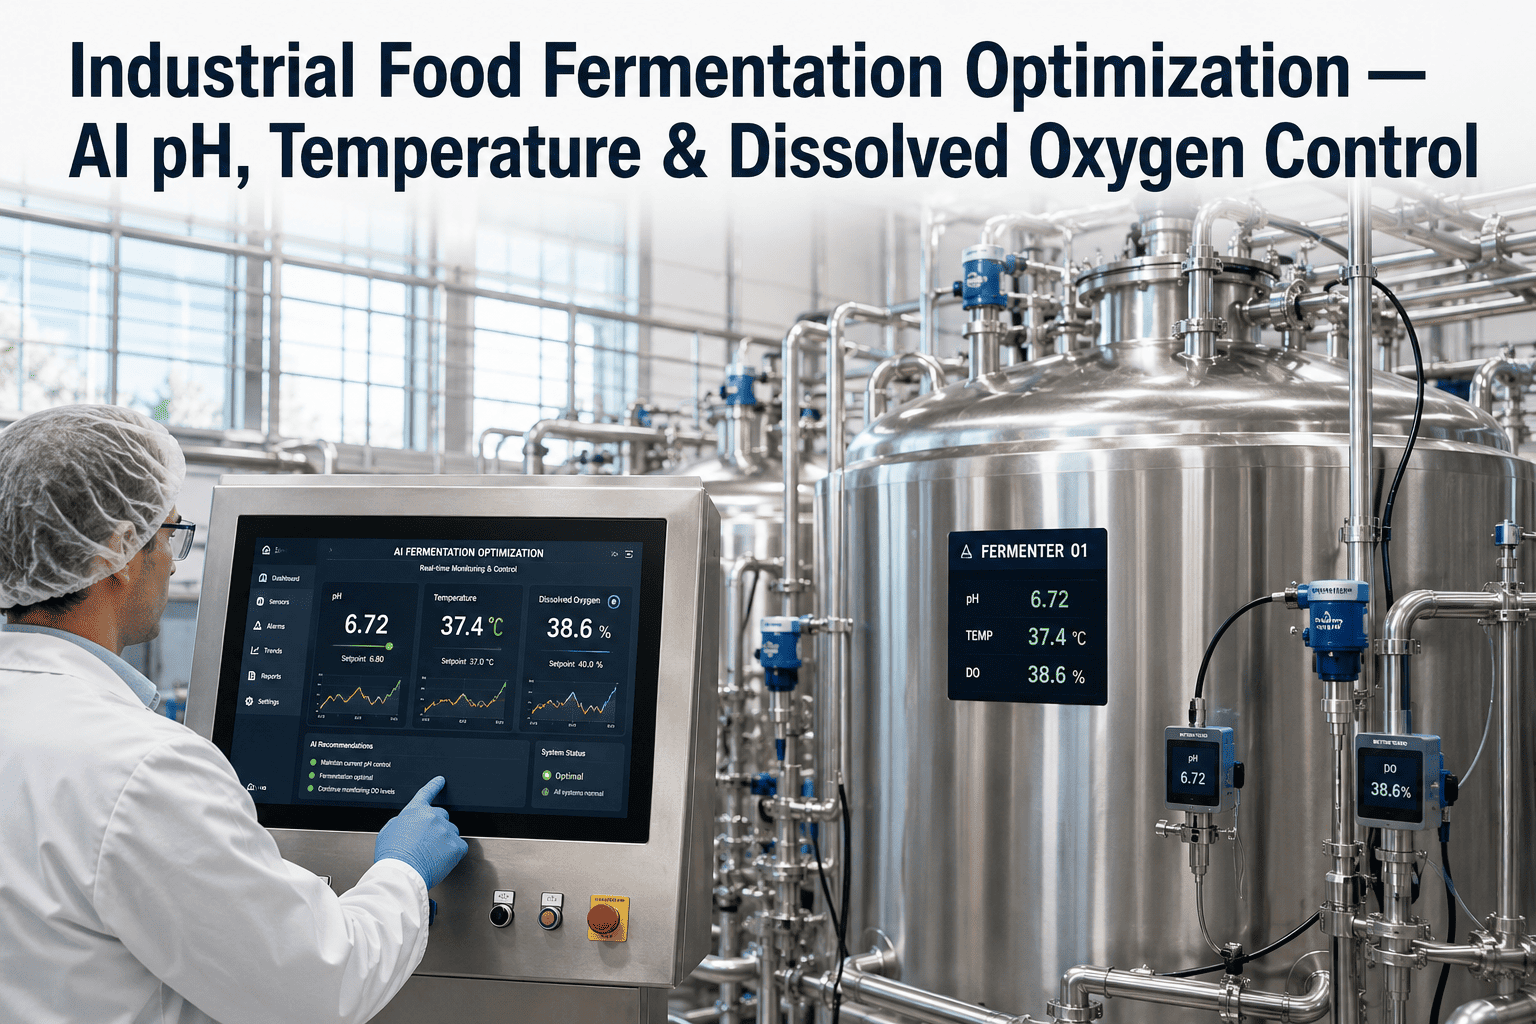
Temperature, dissolved oxygen, and gravity sensors mounted on the fermentation tank read continuously throughout the batch.
2
Curve Comparison Against Recipe Target
Each reading is compared against the expected fermentation curve for that recipe, flagging drift as soon as it starts to diverge.
3
Process Engineer Alert
An alert reaches the process engineer while there is still time to adjust temperature control or investigate a stalling fermentation.
4
Batch Consistency Record
The full fermentation curve is logged and compared against past batches, building a record that supports recipe refinement over time.
Manual Sampling vs Continuous Fermentation Monitoring
Full Curve
Temperature, oxygen, and gravity tracked across the entire fermentation
Early Signal
Drift flagged while a batch can still be corrected
Batch to Batch
Historical curve comparison supports more consistent results over time
Fitting Into Existing Brewery Workflows
Recipe-Specific Baselines
Each recipe gets its own expected fermentation curve, so alerts reflect deviation from that specific recipe rather than a generic threshold.
Batch History Dashboard
Process engineers can compare a current batch's curve directly against previous runs of the same recipe from a single dashboard view.
Mobile Alerts for Off-Hours Fermentation
Since fermentation runs around the clock, alerts reach designated staff on mobile devices even outside regular working hours.
See Your Fermentation Curve in Real Time
Walk through how continuous temperature, oxygen, and gravity tracking would apply to your specific tanks and recipes.
Frequently Asked Questions
CATCH DRIFT WHILE THE BATCH IS STILL FERMENTING
Bring Continuous Fermentation Monitoring to Your Tanks
Get a monitoring plan built around your recipes, tank setup, and fermentation schedule.