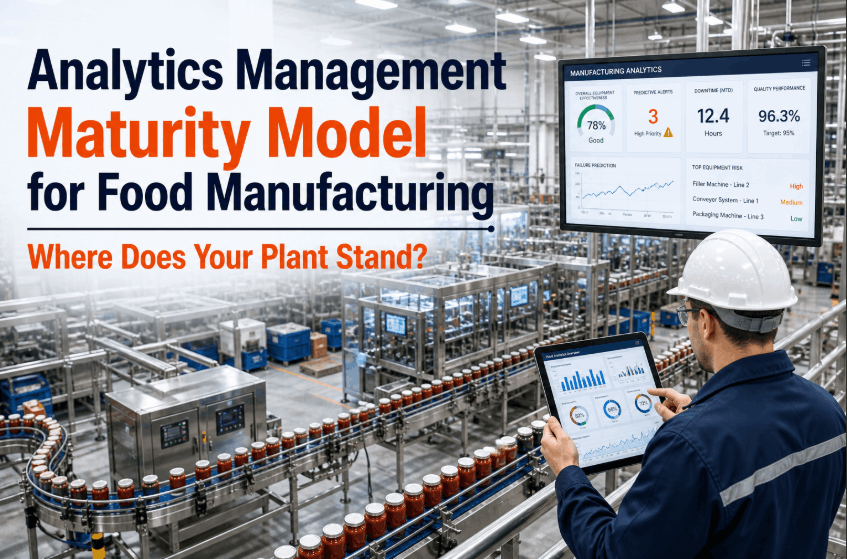
For decades, food manufacturing plants have operated with a mix of legacy machinery, manual data entry, and reactive maintenance schedules. However, the rapid evolution of Industry 4.0 technologies is fundamentally reshaping the competitive landscape. Operations directors now face an urgent need to assess their facility's digital maturity and chart a clear, phased transformation path. Without a structured approach, investments in smart sensors, AI-driven analytics, or cloud-based MES can become disjointed and fail to deliver measurable ROI. This article provides a comprehensive digital maturity model tailored to food manufacturing, a detailed technology gap assessment methodology, a phased roadmap spanning 12 to 36 months, and a robust ROI modeling framework. By following this guide, you can systematically de-risk your digital journey, align technology investments with business outcomes, and build a future-ready food factory. Book a demo to explore how iFactory's end-to-end digital platform can accelerate your maturity journey.
The Five-Level Digital Maturity Model for Food Plants
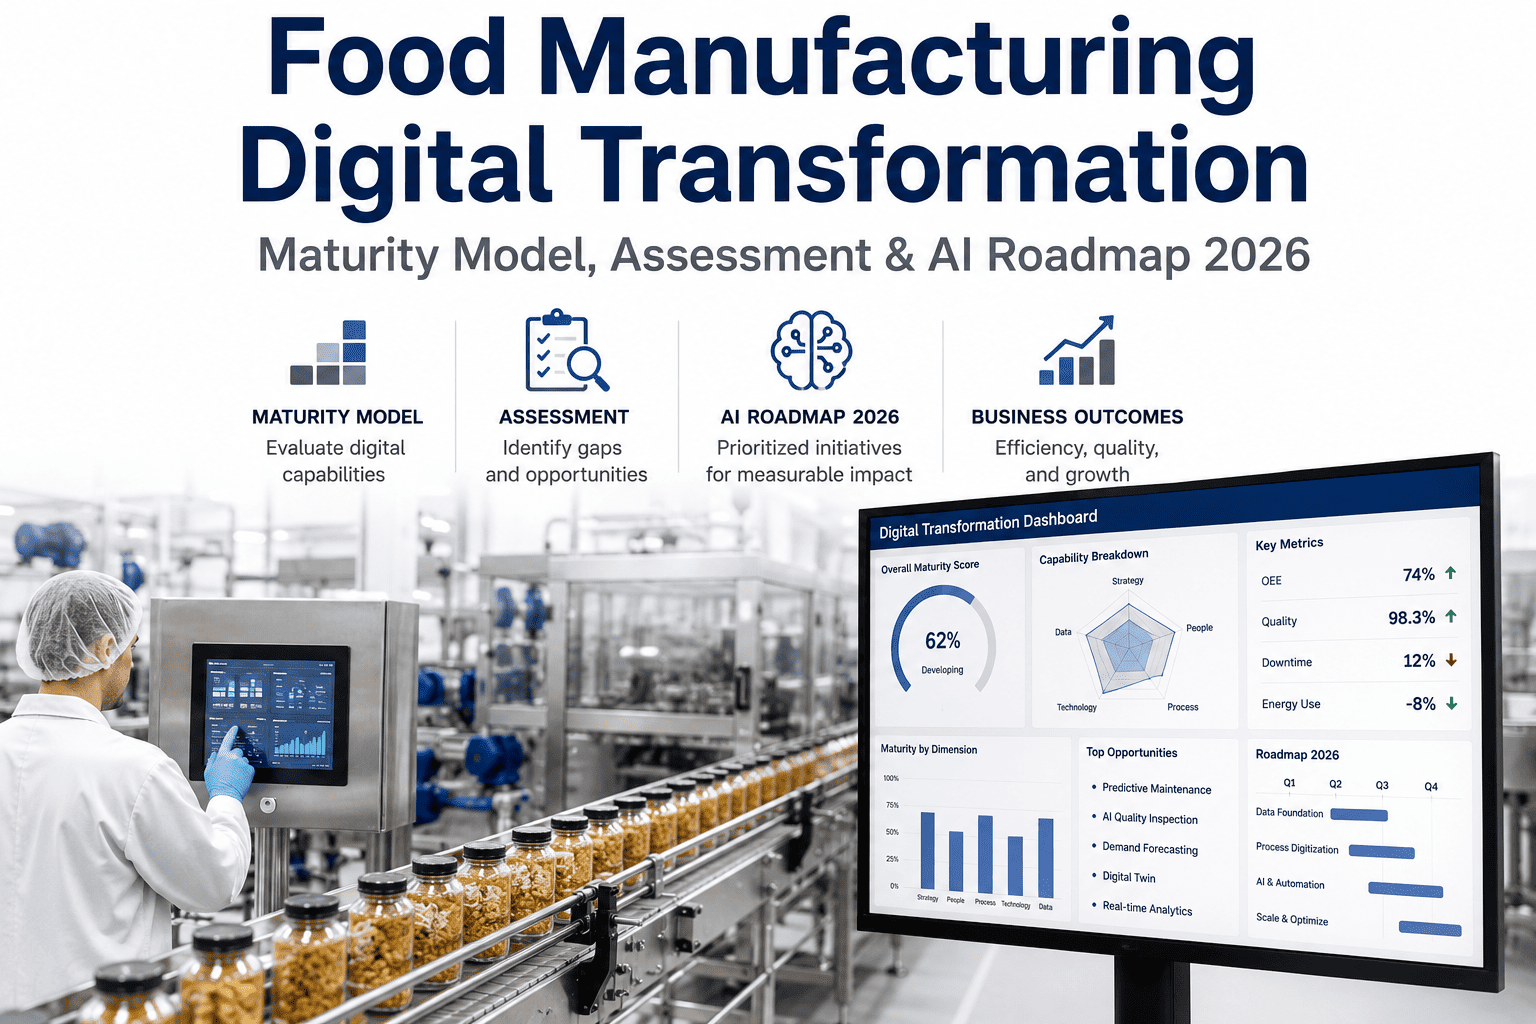
Understanding where your plant currently stands is the first critical step. Our model defines five distinct maturity levels, each with specific capabilities, technology adoption, and cultural readiness. Operations directors can use this framework to benchmark their facility against industry peers and identify priority gaps.
Manual & Paper-Based
All production data is recorded on paper logs. Quality checks are handwritten. Maintenance is purely reactive. No digital connectivity exists between machines or systems. Typical of smaller or older plants with limited capital for IT upgrades.
Basic Digital Islands
Some machines have PLCs and local HMI screens. Data is stored in isolated spreadsheets or basic databases. There is minimal integration between production, quality, and maintenance. Operators still rely heavily on manual data entry.
Connected & Monitored
Key equipment is networked via SCADA or IIoT sensors. Real-time dashboards display OEE and throughput. Quality data is captured digitally. Maintenance shifts from reactive to preventive. However, analytics are descriptive, not predictive.
Predictive & Integrated
AI and machine learning models predict equipment failures and quality deviations. ERP, MES, and WMS are integrated. Digital twins simulate production scenarios. Operators receive prescriptive recommendations via mobile devices. Data flows seamlessly across the enterprise.
Autonomous & Self-Optimizing
The plant operates with minimal human intervention. Production schedules self-adjust based on real-time demand and capacity. AI continuously optimizes yield, energy, and quality. The entire value chain is digitally synchronized from supplier to customer.
Transform Your Plant Today
Ready to move from Level 1 to Level 5? Our experts can guide you through every step. Book a demo to see iFactory in action.
Technology Gap Assessment: Where Is Your Plant Falling Behind?
After establishing your maturity level, the next step is a systematic gap analysis across five critical technology domains. This assessment helps prioritize investments and avoid over-spending on areas that already meet requirements. Use the table below to evaluate your current state and desired target.
| Domain | Current State (Example) | Target State (Level 4) | Technology Gap |
|---|---|---|---|
| Data Collection | Manual write-ups on paper | Real-time IIoT sensor feeds | High |
| Production Scheduling | Excel-based, static | AI-driven dynamic scheduling | Critical |
| Quality Management | Sample-based lab tests | Inline NIR + AI defect detection | High |
| Maintenance | Reactive, after breakdown | Predictive with ML models | Critical |
| Energy Monitoring | Monthly utility bills | Real-time submetering + anomaly detection | Medium |
Each gap should be evaluated for business impact (e.g., downtime cost, quality loss) and implementation complexity (time, budget, skills). This dual-axis prioritization ensures your roadmap focuses on high-impact, feasible projects first. For a detailed assessment template, contact our support team.
Phased Digital Transformation Roadmap: 12-36 Months
A successful transformation is not a single big-bang project but a series of well-orchestrated phases. Each phase builds on the previous one, delivering tangible value while managing risk. The following timeline outlines a realistic progression from a Level 2 plant to Level 4 readiness.
Connect & Collect
Install IIoT sensors on critical equipment (packaging lines, ovens, freezers). Deploy a lightweight SCADA or edge gateway to stream data to a central cloud platform. Train operators on basic dashboards. Target: 20% reduction in unplanned downtime.
Analyze & Alert
Implement a production analytics module with real-time OEE, throughput, and quality dashboards. Set up automated alerts for deviations (e.g., temperature out of spec). Integrate with existing ERP for material tracking. Target: 15% improvement in first-pass yield.
Predict & Prescribe
Deploy machine learning models for predictive maintenance (e.g., bearing wear prediction) and quality prediction (e.g., moisture content). Introduce a digital twin for one production line. Enable mobile alerts for maintenance teams. Target: 30% reduction in maintenance costs.
Optimize & Automate
Expand digital twin to entire plant. Implement AI-driven dynamic scheduling that responds to demand fluctuations. Automate quality release with inline sensors. Achieve Level 4 maturity with integrated MES, ERP, and WMS. Target: 10% increase in overall equipment effectiveness (OEE).
Ready to Build Your Roadmap?
Every plant is unique. Let our team help you tailor a phased plan that fits your budget and goals. Schedule a demo now.
ROI Modeling: Quantifying the Value of Digital Transformation
To secure budget and executive buy-in, operations directors must present a compelling financial case. Below is a simplified ROI model based on a mid-sized food plant with 200 employees and annual revenue of $50 million. All figures are illustrative but based on industry benchmarks.
OEE Improvement
From 65% to 80% over 3 years
$2.5M annual gain
Maintenance Cost Reduction
30% reduction in reactive maintenance
$800K annual savings
Quality Scrap Reduction
50% reduction in defect-related waste
$600K annual savings
Energy Efficiency
15% reduction in energy consumption
$400K annual savings
Total estimated annual benefit: $4.3 million. With a total investment of $1.5 million over 3 years (sensors, software, integration, training), the payback period is approximately 4 months. For a customized ROI calculator tailored to your plant's data, reach out to our support team.
Real-World Case Study: From Level 2 to Level 4 in 18 Months
A regional dairy processor with 3 plants embarked on a digital transformation journey using iFactory's platform. Initially at Level 2, they faced high downtime (12%), frequent quality holds, and manual data reconciliation across shifts. The phased approach included sensor deployment on pasteurizers and fillers, real-time OEE dashboards, and predictive maintenance models for compressors. Within 18 months, they achieved Level 4 maturity on one line, with plans to expand. Results: downtime reduced to 4%, first-pass yield improved from 92% to 98%, and maintenance costs dropped by 35%. The project paid for itself in 6 months. Read the full case study on our support page.
Frequently Asked Questions
How long does a typical digital transformation take for a food plant?
The timeline varies based on starting maturity level, budget, and organizational readiness. For a plant at Level 2, a realistic timeline to reach Level 4 is 24 to 36 months using a phased approach. The first phase (connect and collect) can show results in 3 to 6 months, which helps build momentum. Key factors include the availability of skilled IT/OT staff, the complexity of legacy equipment, and the willingness to change workflows. Many plants achieve significant ROI within the first year by focusing on high-impact areas like predictive maintenance and OEE monitoring. For a detailed timeline assessment tailored to your plant, contact our support team.
What is the typical budget for a food plant digital transformation?
Budgets can range from $200,000 for a small plant with basic IIoT sensors and dashboards to over $2 million for a large facility with full MES integration, digital twins, and AI models. A mid-sized plant (200 employees) typically invests $1 million to $1.5 million over three years. This includes hardware (sensors, gateways), software licenses (MES, analytics, AI), integration services, and training. The payback period is often 6 to 12 months when focusing on high-ROI areas like downtime reduction and quality improvement. For a free budget estimation, reach out to our support team.
How do I get buy-in from plant operators and line managers?
Change management is critical. Start by involving operators in the selection of sensors and dashboards. Show them early wins, such as a simple real-time OEE display that helps them spot issues faster. Provide hands-on training and create a feedback loop where their suggestions are implemented. Celebrate successes publicly, like a reduction in downtime or quality alerts. When operators see that digital tools make their jobs easier, not harder, adoption accelerates. For change management best practices, visit our support page.
What are the most common pitfalls in food plant digitalization?
Common pitfalls include: (1) trying to do too much at once without a phased plan, leading to integration chaos; (2) investing in technology without first cleaning up data quality, resulting in garbage-in-garbage-out; (3) neglecting cybersecurity, especially when connecting legacy OT systems to the internet; (4) underestimating the need for cultural change and training; and (5) choosing proprietary platforms that create vendor lock-in. To avoid these, follow a structured maturity model and work with an experienced partner like iFactory. For a full list of pitfalls and mitigation strategies, contact our support team.
How does AI specifically improve food safety and quality?
AI models can predict quality deviations before they happen by analyzing sensor data (temperature, humidity, pressure) in real time. For example, a model can detect that a freezer's compressor is starting to fail, which would cause temperature fluctuations and potential spoilage. Similarly, computer vision systems inspect packaging for defects or contamination at line speed, far faster than human inspectors. These systems also generate traceability data that satisfies regulatory requirements like FSMA. AI can also optimize cleaning schedules to reduce downtime while maintaining hygiene standards. For a demo of AI quality applications, book a demo here.
Start Your Digital Transformation Journey
Don't let your plant fall behind. With iFactory, you can assess, plan, and execute a digital transformation that delivers measurable results. Book a demo today.