Overall Equipment Effectiveness (OEE) is the gold standard metric for measuring food and beverage production line performance. In an industry where margins are tight, compliance is non-negotiable, and consumer demand shifts without warning, a single percentage point improvement in OEE food manufacturing can translate to hundreds of thousands of dollars in recovered throughput annually. Yet most food plants still operate with OEE scores between 40–65%—far below the world-class benchmark of 85%. This article breaks down proven OEE improvement strategies tailored specifically for food and beverage operations, covering the six big losses, TPM implementation, changeover optimization, and AI-driven analytics dashboards. Book a Demo to see how iFactory's Analytics & Reporting platform brings these strategies to life on your production floor.
Stop Losing Revenue to Hidden Production Inefficiencies
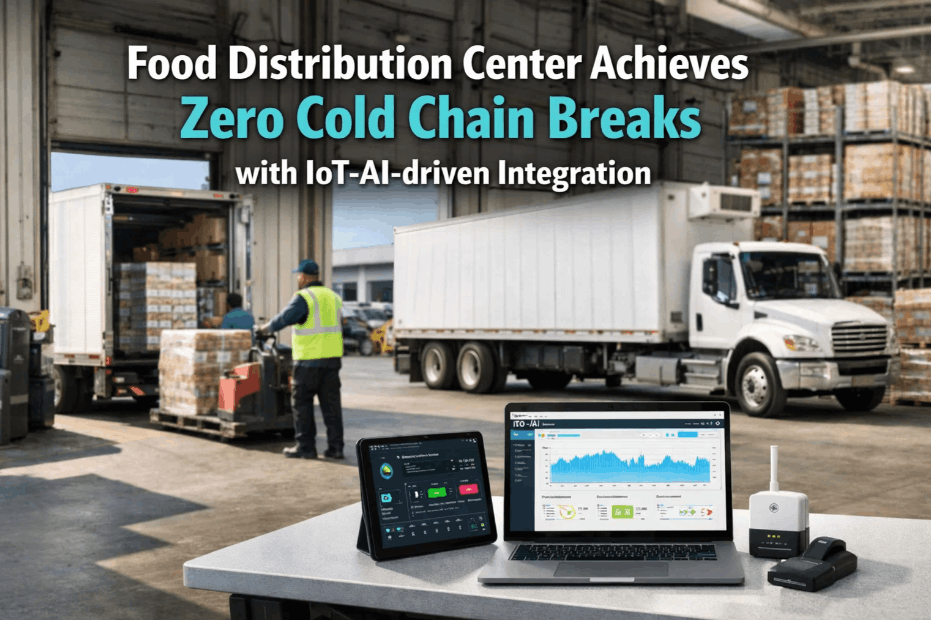
iFactory's AI-driven OEE dashboard identifies your six big losses in real time—so your food production line runs at world-class performance levels.
What Is OEE in Food Manufacturing — And Why Does It Matter?
OEE, or Overall Equipment Effectiveness, is a composite metric calculated by multiplying three performance factors: Availability × Performance × Quality. In food and beverage production, this formula captures the full picture of how efficiently a line converts scheduled time into good product. A line running at 100% OEE produces only conforming product, at maximum speed, with zero unplanned downtime—a theoretical ideal that drives continuous improvement culture.
The food industry faces unique OEE challenges that other sectors don't. Sanitation windows, allergen changeovers, cold-chain constraints, regulatory compliance windows, and high-moisture environments all compress available production time and introduce variability that drives down OEE scores. Understanding how to calculate OEE accurately—and then act on the data—is the difference between a reactive plant and a world-class operation.
Measures losses due to unplanned downtime, equipment failures, and material shortages on your food line.
Captures speed losses—slow cycles, minor stoppages, and reduced throughput during startup or changeover transitions.
Accounts for product defects, rework batches, and weight non-conformances that fail food safety or specification standards.
The Six Big Losses in Food and Beverage Production Lines
The six big losses framework, originally developed under Total Productive Maintenance (TPM), provides a structured taxonomy for every type of OEE loss a food plant encounters. Identifying which of these losses dominates your operation is the essential first step before any food production OEE improvement initiative can succeed. Plants that Book a Demo with iFactory consistently discover that 70–80% of their total OEE gap comes from just two or three of these six categories.
Equipment Failure & Breakdowns
Unplanned stoppages caused by mechanical failures—conveyor jams, filler head failures, sealer breakdowns. In food plants, these often coincide with peak production runs, compounding the cost impact significantly.
Setup & Changeover Losses
Time lost during SKU changeovers, allergen flushes, CIP (Clean-in-Place) cycles, and format adjustments. Changeover losses are among the highest-impact OEE drains in food and beverage manufacturing, especially in multi-SKU facilities.
Idling & Minor Stoppages
Short stops under five minutes—label sensor misreads, brief conveyor jams, fill-level rejects—that individually seem minor but accumulate to significant production time losses across a full shift.
Reduced Speed Losses
Lines running below their designed rate due to worn components, conservative operator settings, or product viscosity variations. Speed losses are notoriously difficult to detect without continuous OEE tracking software.
Startup & Yield Losses
Product wasted during line startups, temperature stabilization periods, or following CIP cycles before the line reaches specification. These losses are especially pronounced in temperature-sensitive dairy, meat, and beverage operations.
Production Defects & Rework
Out-of-spec weight fills, seal failures, label misapplications, and contamination events requiring rework or destruction. In food manufacturing, defect losses carry amplified cost because rework often violates HACCP protocols.
TPM Implementation for Food Manufacturing OEE Improvement
Total Productive Maintenance (TPM) is the operational philosophy underpinning sustainable OEE improvement in food and beverage plants. Unlike reactive maintenance—which responds only after failures occur—TPM distributes ownership of equipment health across operators, technicians, and engineers, creating a proactive culture of prevention. Implementing TPM in food manufacturing requires adapting the eight pillars of TPM to the specific constraints of hygienic equipment design, sanitation schedules, and food safety regulatory requirements.
| TPM Pillar | Food & Beverage Application | OEE Impact |
|---|---|---|
| Autonomous Maintenance | Operators perform daily inspections, lubrication checks, and sanitation verification on filling and sealing equipment | +8–12% Availability |
| Planned Maintenance | Schedule preventive maintenance tasks during CIP windows and sanitation breaks to avoid production interruption | −60% Unplanned Downtime |
| Quality Maintenance | Connect equipment condition data to in-line checkweighers and vision inspection systems for real-time quality correlation | +5–9% Quality Rate |
| Focused Improvement | Cross-functional Kaizen teams analyze chronic minor stoppages at the most constrained point of the food production line | +10–15% Performance |
| Education & Training | Certify operators on OEE calculation, loss categorization, and equipment ownership protocols specific to food line assets | Sustained culture change |
| Safety, Health & Environment | Integrate HACCP critical control points and allergen management into equipment maintenance and changeover procedures | Zero compliance incidents |
Accelerate Your OEE Gains with Real-Time Performance Data
Transition from paper logs to automated AI tracking. See your line performance, downtime reasons, and quality metrics updated every 60 seconds.
The most impactful TPM pillar for food and beverage OEE improvement is typically Autonomous Maintenance combined with Planned Maintenance scheduling. When operators own their equipment—cleaning it, inspecting it, and flagging anomalies—the number of unplanned breakdowns drops dramatically within the first 90 days. Pairing this with data from an AI-driven OEE dashboard enables maintenance teams to shift from calendar-based PM schedules to condition-based intervention, extending asset life while protecting production throughput.
Changeover Optimization: The Fastest OEE Win in Food Production
In food and beverage manufacturing, changeover time is one of the most controllable levers for rapid OEE improvement. SMED (Single-Minute Exchange of Die) methodology—adapted for food production environments—targets the reduction of changeover time from hours to minutes by separating internal activities (line stopped) from external activities (completed while line runs). A food plant running 8–12 changeovers per week with 45-minute average changeover duration is losing over 70 hours of monthly production capacity.
SMED Applied to Food Line Changeovers
The SMED process for food manufacturing begins by filming every changeover and categorizing each task as internal or external. External tasks—such as pre-staging format parts, pre-heating CIP solutions, and pre-printing labels—are moved outside the production window. Internal tasks are then standardized, sequenced, and documented into digital work instructions accessible on the plant floor. Teams that Book a Demo with iFactory's Analytics & Reporting platform report 35–50% changeover time reductions within the first quarter.
Pre-Stage All Format Parts
Kitting format components, gaskets, and tooling before the line stops converts internal changeover time to external, immediately reducing the time the line sits idle between SKUs.
Standardize CIP Sequence Timing
Documenting exact CIP chemical concentrations, contact times, and rinse verification criteria eliminates variability in sanitation cycles and reduces restart delays caused by failed ATP or allergen swab results.
Parallel Tasking with Team Assignments
Assigning specific technicians to parallel changeover tasks—mechanical adjustment, CIP, label verification, and checkweigher calibration—running simultaneously rather than sequentially can cut changeover duration by 40%.
Digital Changeover Checklists
Replacing paper-based changeover logs with timestamped digital checklists creates accountability, identifies chronic bottleneck tasks, and generates audit-ready records for food safety compliance review.
AI-Driven OEE Dashboard for Food & Beverage Lines
Modern food production OEE improvement requires more than manual data collection and monthly Excel reviews. AI-driven OEE dashboards transform real-time sensor data from filling machines, conveyors, labelers, and packaging lines into actionable loss analysis that maintenance and production teams can act on within the same shift. The shift from lagging indicators to leading indicators is where world-class food plants create their competitive advantage.
iFactory's Analytics & Reporting platform ingests data from existing PLCs, SCADA systems, and IoT-enabled food line assets to deliver OEE scores by line, shift, and SKU in real time—without requiring new hardware in most cases. Anomaly detection algorithms flag developing issues before they become downtime events, and automated root-cause tagging categorizes losses against the six big losses framework so engineering teams can prioritize correctly. Plants looking to move from reactive to predictive OEE management can Book a Demo and receive a custom line-level OEE gap analysis as part of the onboarding process.
Key Features of an Effective Food Production OEE Dashboard
Live OEE scores displayed at the line level, shift level, and SKU level—updating every 30–60 seconds so supervisors can intervene before minor stoppages become major downtime events on the food production floor.
AI-driven root-cause tagging that assigns every downtime event to one of the six big loss categories automatically, eliminating the manual data entry burden on operators and ensuring consistent loss classification across shifts.
Machine learning models trained on your equipment's historical signature data predict failure windows 48–72 hours in advance, enabling scheduled maintenance during planned sanitation windows rather than emergency mid-shift stoppages.
Automatic changeover start and end detection benchmarks every changeover against historical best performance, flagging deviations in real time and surfacing specific tasks that are consuming excess time for targeted SMED analysis.
Automated generation of time-stamped performance logs, sanitation records, and equipment calibration histories for SQF, BRC, FSSC 22000, and FDA FSMA compliance—reducing audit preparation time by up to 80%.
Food Manufacturing OEE Benchmarks by Production Category
Understanding where your food plant stands relative to industry OEE benchmarks is essential for setting realistic improvement targets and securing leadership buy-in for technology investment. OEE scores vary significantly across food and beverage production categories due to differences in line complexity, sanitation requirements, and product changeover frequency. The table below provides current benchmarks and world-class targets to guide your food production OEE strategy.
| Production Category | Industry Average OEE | World-Class Target | Primary Loss Driver |
|---|---|---|---|
| Beverage Filling & Packaging | 58–65% | 85%+ | Minor stoppages & changeover |
| Dairy & Liquid Processing | 52–60% | 82%+ | CIP duration & startup yield |
| Bakery & Snack Production | 60–70% | 85%+ | Oven availability & scrap rate |
| Meat & Poultry Processing | 45–55% | 78%+ | Sanitation downtime & yield loss |
| Ready-to-Eat & Frozen | 55–65% | 83%+ | Speed loss & rework |
| Confectionery & Chocolate | 62–72% | 87%+ | Temperature control & changeover |
The 12-Month OEE Improvement Roadmap for Food Plants
Achieving world-class food production OEE is a journey with distinct phases. Plants that attempt to implement everything simultaneously typically fail to sustain any single improvement. A phased roadmap—aligned with TPM maturity stages—delivers compounding results and builds the internal capability needed for long-term OEE performance management. Teams ready to begin this journey can Book a Demo to receive a customized 90-day OEE quick-win plan tailored to your specific production category and loss profile.
Baseline & Loss Visibility
Deploy IoT sensors and OEE data collection on the top two or three highest-loss lines. Establish accurate Availability, Performance, and Quality baselines. Train operators on loss categorization and autonomous maintenance fundamentals.
Changeover & Planned Maintenance Optimization
Apply SMED analysis to the top two changeover types. Shift maintenance scheduling from calendar-based to condition-based using OEE dashboard insights. Launch first focused improvement Kaizen on the dominant minor stoppage category.
Predictive Analytics Activation
AI models have sufficient equipment data to generate high-confidence predictive failure alerts. Maintenance begins scheduling interventions based on predictive windows aligned with sanitation and CIP breaks. Quality correlation analysis connects equipment condition to in-line defect rates.
Autonomous & Sustained World-Class OEE
OEE improvement culture is embedded across all shifts. Operators proactively flag equipment anomalies. Leadership dashboards track OEE trends by line, SKU, and shift. Regulatory audit preparation is automated, eliminating compliance burden from the production team.
Frequently Asked Questions — OEE in Food & Beverage Manufacturing
How is OEE calculated differently for food production lines?
OEE calculation in food manufacturing follows the same Availability × Performance × Quality formula, but Planned Production Time must account for mandatory sanitation windows, CIP cycles, and regulatory-required downtime that are excluded from the OEE denominator. Misclassifying sanitation downtime as unplanned loss artificially deflates OEE scores and misdirects improvement efforts.
What is a good OEE score for a food and beverage plant?
Industry average OEE in food and beverage manufacturing ranges from 45–65%, depending on production category. A score of 75% or above indicates above-average performance, while 85%+ is considered world-class. Most food plants have significant headroom for improvement, with the largest gains typically found in changeover time reduction and minor stoppage elimination.
How does TPM differ from preventive maintenance in food plants?
Preventive maintenance focuses on scheduled equipment servicing by maintenance technicians. TPM is a broader organizational philosophy that transfers day-to-day equipment ownership to operators, who perform autonomous maintenance tasks—cleaning, inspection, and basic adjustments—as part of their standard work. TPM creates the cultural foundation that makes preventive maintenance programs more effective and sustainable over time in food manufacturing environments.
Can OEE tracking software integrate with existing food plant SCADA systems?
Yes. Modern OEE platforms like iFactory connect to existing PLCs, SCADA systems, MES platforms, and IoT-enabled food line equipment via standard industrial protocols including OPC-UA, MQTT, and Modbus. This eliminates the need for full infrastructure replacement and enables real-time OEE data collection from your current installed base of food line assets within days of deployment.
How long does it take to see OEE improvement results in food manufacturing?
Initial OEE improvements from loss visibility and basic autonomous maintenance are typically visible within the first 30–60 days of a structured program. Changeover optimization yields measurable results within 60–90 days. Predictive analytics benefits—including significant reduction in unplanned downtime—begin compounding from Month 4 onward as AI models learn your specific equipment behavior patterns.
Transform Your Food Production Line Performance with AI-Driven OEE Analytics
Join the food and beverage manufacturers achieving 85%+ OEE. iFactory will show you exactly where your six big losses are costing you throughput—and how to eliminate them systematically.


-inspection-checklist.png)