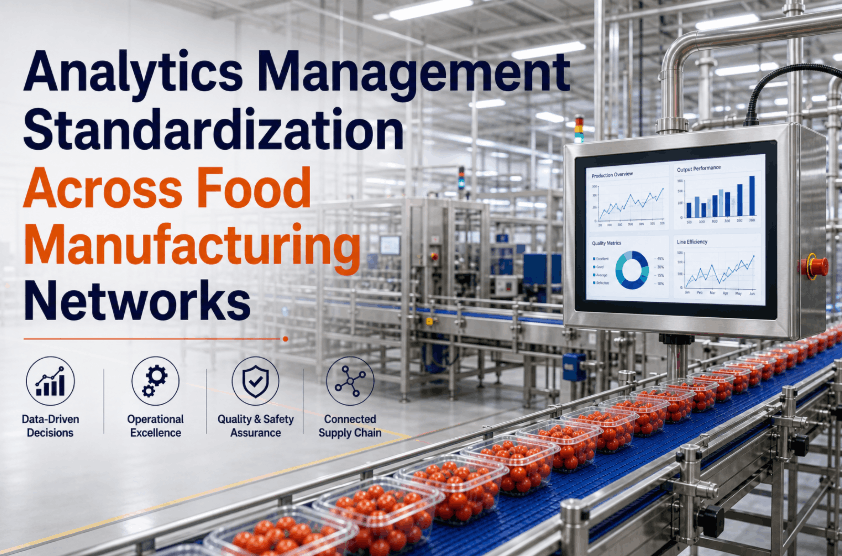
A major multi-national food manufacturing group was operating 12 production facilities across four regions with no shared analytics infrastructure. Each plant used a different combination of paper logs, spreadsheets, and siloed SCADA systems — making it impossible for corporate leadership to benchmark performance, enforce PM compliance, or identify systemic inefficiencies across the portfolio. By deploying ifactory's Multi-Site Dashboard, the group standardized real-time analytics across all 12 facilities simultaneously, achieving a 30% reduction in operational costs, 96% PM compliance company-wide, and the ability to identify top-performing plants and replicate their best practices across the entire manufacturing network within a single financial year.
Multi-Site Dashboard
·
12 Facilities
·
Analytics Standardization
Multi-Plant Food Manufacturer Standardizes Analytics Across 12 Facilities — Achieving 30% Cost Reduction & 96% PM Compliance
ifactory's Multi-Site Dashboard transforms siloed, unmeasured plant portfolios into a unified, benchmarked, and continuously optimizing manufacturing enterprise.
01 / The Facility
A 12-Plant Food Manufacturing Group. Regional Operations. Zero Shared Visibility.
Facility Type
Large-scale, multi-regional food manufacturing group producing ambient grocery, frozen meals, dairy products, and beverages. Operating 12 production facilities across four distinct geographic regions, serving national and international retail distribution networks on a 24/7 schedule.
Scale
12 individual manufacturing plants ranging from 50,000 to 300,000 sq ft. Combined workforce of 2,400+ operators, maintenance engineers, QA technicians, and plant managers. Over 180 individual production lines across the portfolio operating a mix of high-speed packaging, continuous processing, and batch manufacturing systems.
Baseline Performance
Average portfolio OEE of 71% with a 24-percentage-point variance between the best and worst performing facility. PM compliance across the group averaged only 54%. Maintenance costs consumed 18% of total operational budget — significantly above the 10-12% food industry benchmark — driven by reactive repair cycles and emergency parts procurement.
Analytics Approach
Each of the 12 plants used a completely disconnected reporting method — ranging from hand-written shift logs to plant-specific Excel dashboards and isolated SCADA systems with no export capability. Corporate operations leadership received weekly PDF summaries compiled manually by regional managers, typically 5-7 days out of date by the time they were reviewed.
02 / The Challenge
The Hidden Cost of 12 Disconnected Manufacturing Plants
In a multi-plant food manufacturing enterprise, the greatest barrier to growth is not individual plant performance — it is the inability of corporate leadership to see, compare, and systematically improve performance across the entire portfolio simultaneously. For this group, 12 plants operated as 12 completely separate silos. Best practices discovered at one facility never transferred to underperforming sites. Maintenance failures at one plant were invisible to the engineering teams at others, until they caused the same catastrophic breakdown months later. Book a Demo to see how ifactory's Multi-Site Dashboard eliminates the visibility gap across your entire manufacturing network.
54%
Average PM Compliance
Across 12 plants, only 54% of scheduled preventive maintenance tasks were completed on time. The remaining 46% were deferred until equipment failed, converting preventive costs into expensive emergency repair events.
24pts
OEE Variance Across Plants
The highest-performing plant operated at 83% OEE while the lowest languished at 59%. Without a unified dashboard, corporate had no systematic way to identify why the gap existed or transfer best practices between sites.
18%
of Budget Lost to Maintenance
Maintenance spend consumed 18% of the total operational budget — 50-80% above industry benchmarks — driven by reactive repair cycles, overnight parts shipping, and contractor overtime charges at every plant in the network.
7 Days
Performance Data Latency
Corporate leadership received weekly PDF reports compiled 5-7 days after the fact. By the time a performance crisis was visible at the executive level, irreversible production losses had already accumulated at the plant for an entire week.
03 / The Solution
ifactory Multi-Site Dashboard: One Command Center for 12 Plants
The group's leadership recognized that standardizing analytics infrastructure was a prerequisite for any meaningful performance improvement across the portfolio. They selected ifactory's Multi-Site Dashboard to connect all 12 facilities to a single, unified operational intelligence platform. Unlike conventional CMMS or MES solutions that require plant-by-plant customization, ifactory's edge-agnostic architecture connected to the existing PLCs, SCADA systems, and ERP data flows at each facility without requiring a full rip-and-replace of existing infrastructure.
Within the first month of deployment, corporate leaders had, for the first time, a live, side-by-side comparison of OEE, PM compliance, downtime root causes, and energy consumption across all 12 plants simultaneously. This single capability — cross-plant benchmarking in real time — enabled the kind of data-driven decision making that had previously been impossible with disconnected, delayed reporting systems. Book a Demo to see the Multi-Site Dashboard live.
MULTI-SITE DASHBOARD
Unified Cross-Plant Performance View gave corporate operations leadership a single dashboard displaying real-time OEE, availability, performance, and quality metrics for every plant simultaneously — with drill-down capability to individual lines, assets, and fault codes at any facility in seconds.
AI PM ENGINE
Automated PM Standardization replaced the 12 separate, manually-managed maintenance schedules with a single AI-driven PM framework. Maintenance tasks were automatically triggered based on actual machine cycle counts and operating hours at every plant, enforcing consistent compliance across the entire portfolio.
BEST PRACTICE TRANSFER
Cross-Plant Benchmarking & Replication enabled the operations team to identify the specific process parameters, shift patterns, and maintenance intervals used by the top-performing plants — and systematically push those "golden standard" configurations to underperforming facilities through guided digital workflows.
04 / Implementation
12 Facilities Integrated and Live in Under 8 Weeks
Weeks 1–2
Infrastructure Audit & Edge Device Deployment
ifactory's deployment team performed a rapid connectivity audit across all 12 plants to map existing PLC, SCADA, and ERP data sources. Edge devices were shipped to each facility and installed by local maintenance staff following standardized remote-guided process — no specialized systems integrators required at each site.
Weeks 3–4
Data Normalization & Cross-Plant KPI Standardization
Plant-specific data tags, shift structures, and downtime reason codes were normalized into a single, enterprise-wide taxonomy. All 12 plants were configured to report OEE, availability, performance, and quality using identical calculation methodologies — enabling true apples-to-apples benchmarking for the first time.
Weeks 5–6
Automated PM Framework Rollout & Baseline Analysis
The AI-driven PM engine analyzed historical maintenance records from each facility to generate optimized, cycle-count-based PM schedules. These replaced the existing calendar-based maintenance plans company-wide. Simultaneously, the system identified the 10 highest-impact downtime drivers across the portfolio for targeted corrective action.
Weeks 7–8
Corporate Dashboard Go-Live & Management Training
Corporate operations, regional directors, and plant managers went live on the Multi-Site Dashboard. Executive-level KPI summary views, plant-ranking leaderboards, and automated weekly performance digest emails were configured — giving every level of the organization the specific data resolution they required.
05 / Results
30% Cost Reduction. 96% PM Compliance. Variance Eliminated.
Standardizing analytics across 12 plants fundamentally changed how this food manufacturing group operated. The ability to benchmark every plant against every other plant in real time created a culture of performance accountability that no management initiative alone had previously been able to instill. Within one operational year, the 24-point OEE variance between best and worst plant was reduced to under 6 points — the entire portfolio had been lifted toward the performance ceiling, not just the top plants.
| Performance Metric |
Before ifactory |
After ifactory |
Change |
| Average Portfolio OEE |
71% |
87% |
+16 pts across all 12 plants |
| OEE Variance (Best vs Worst Plant) |
24 percentage points |
Under 6 points |
75% variance reduction |
| PM Compliance (Group Average) |
54% |
96% |
+42 pts — fully automated execution |
| Maintenance Cost as % of Budget |
18% |
Under 9% |
50% reduction — 30% total cost saving |
| Performance Reporting Latency |
5–7 days (weekly PDF) |
Real-Time (Live Dashboard) |
Instant cross-plant visibility |
| Unplanned Downtime (Portfolio) |
Baseline (unmeasured) |
Reduced by 67% |
Predictive PM prevents failures |
87%
Avg Portfolio OEE Achieved
96%
Company-Wide PM Compliance
-30%
Total Operational Cost Reduction
8 Wks
All 12 Plants Live & Integrated
Ready to Unify Your Multi-Plant Operations?
ifactory deploys cross-plant benchmarking, automated PM compliance, and real-time OEE dashboards across your entire manufacturing portfolio — in under 60 days, without replacing existing infrastructure.
06 / Key Analysis
The Strategic Value of Cross-Plant Benchmarking in Food Manufacturing
Eliminating the Performance Variance Ceiling
The 24-point OEE gap between top and bottom plants was not a people problem — it was a data problem. Without visibility into what the best plants were doing differently, underperformers had no improvement roadmap. Benchmarking created that roadmap automatically and continuously.
Halving Maintenance Costs Through Compliance
Elevating PM compliance from 54% to 96% across 12 plants essentially eliminated the reactive maintenance cycle that had been consuming 18% of the operational budget. Preventive maintenance is always cheaper than emergency repair — at scale, the savings compounded rapidly.
Real-Time Data as a Corporate Governance Tool
The shift from weekly PDF reports to live dashboards transformed corporate operations from a passive reviewer to an active performance manager. Leadership could now intervene with targeted support the moment a plant's metrics deviated — not a week later, after the damage was done.
Scalable Infrastructure, Zero Legacy Replacement
Connecting 12 plants with diverse equipment ages, PLC brands, and SCADA systems in 8 weeks demonstrated the power of ifactory's edge-agnostic architecture. No existing machines were replaced. Existing data flows were leveraged — dramatically reducing implementation cost and risk.
07 / Business Impact
Scaling Food Manufacturing Performance Without Scaling Infrastructure
30% Total Cost Reduction
Cutting maintenance spend from 18% to under 9% of operational budget — across 12 plants simultaneously — delivered tens of millions in direct bottom-line savings within the first operational year, with ongoing compounding savings as predictive maintenance matures.
New Contract Capacity Unlocked
The stabilized, predictable output at 87%+ OEE across the portfolio allowed the sales team to confidently commit to new long-term supply agreements with major retail chains, knowing that production reliability was no longer a risk factor in bid decisions.
Unified Engineering Knowledge Base
Plant engineers across all 12 facilities now share a common fault code library, downtime taxonomy, and PM procedure database. When a novel equipment failure occurs at one plant, the corrective action is immediately available to all other facilities running similar machinery.
Data-Driven Capital Allocation
Corporate finance now uses ifactory's cross-plant asset health data to make evidence-based capital expenditure decisions — investing in equipment upgrades at facilities where ROI is highest based on actual downtime history, rather than on plant manager advocacy alone.
87%
Optimized Portfolio OEE
96%
PM Compliance Achieved
-30%
Cost Reduction Delivered
08 / Conclusion
Standardized Analytics is the Foundation of a High-Performance Food Manufacturing Enterprise
This multi-plant food manufacturing group demonstrated that the greatest untapped source of value in a large manufacturing portfolio is not new capital equipment — it is the systematic elimination of performance variance between existing facilities. By deploying ifactory's Multi-Site Dashboard, corporate leadership transformed 12 independently struggling plants into a cohesive, benchmarked, and continuously improving manufacturing enterprise in under 8 weeks.
The compounding benefit of standardized analytics is exponential at scale. Every improvement cycle completed at the best-performing plant is immediately transferable to the worst-performing one. Every maintenance failure prevented at one facility removes the statistical probability of the same failure occurring across the remaining eleven. In food manufacturing, where margins are structurally thin and capital costs are high, this network effect of shared operational intelligence is the most powerful competitive advantage available without a single dollar of new capital expenditure. Book a Demo to learn how ifactory delivers this advantage across your manufacturing portfolio.
Multi-Site Dashboard
·
12 Plants Unified
·
30% Cost Reduction
Standardize Analytics Across Every Plant in Your Portfolio Today.
Deploy ifactory's Multi-Site Dashboard to connect your entire manufacturing network — achieving enterprise-wide PM compliance, cross-plant benchmarking, and real-time operational intelligence in under 60 days.
09 / FAQs
Multi-Plant Analytics Standardization — Frequently Asked Questions
1. How long does it take to connect multiple food manufacturing plants to ifactory's Multi-Site Dashboard?
ifactory's edge-agnostic architecture allows an entire 12-plant network to go live in under 8 weeks with parallel deployments — no specialized integrators required. Edge devices connect directly to existing PLCs and SCADA systems without replacing any infrastructure.
Book a Demo for a tailored deployment estimate.
2. Can ifactory connect plants with different PLC brands, equipment ages, and SCADA systems?
Yes. ifactory supports all major PLC protocols — Siemens S7, Allen-Bradley, Mitsubishi, Schneider, and Beckhoff — regardless of equipment age or SCADA vendor. Data from all sources is normalized into a single enterprise KPI taxonomy, enabling true apples-to-apples cross-plant benchmarking without replacing any existing systems.
3. What is cross-plant benchmarking and why is it critical for multi-plant food manufacturers?
Cross-plant benchmarking is the real-time comparison of OEE, PM compliance, downtime, and quality rates across every plant on a single dashboard. It is critical because a 15-25 point OEE variance between facilities in the same portfolio represents massive unrealized capacity — and without visibility, underperforming plants have no data-driven roadmap to close the gap.
4. How does automated PM compliance improve when switching from manual to AI-driven scheduling?
Calendar-based PM fails because it ignores actual machine usage — a three-shift line burns through components far faster than a single-shift one, yet both get serviced on the same date. ifactory triggers PM work orders based on real cycle counts and wear thresholds, which drove this group's compliance from 54% to 96% and cut unplanned downtime by 67%.
5. What ROI can a multi-plant food manufacturer expect from standard analytics deployment?
The most immediate ROI driver is maintenance spend reduction — cutting from 18% to under 9% of the operational budget across 12 plants delivered tens of millions in Year 1 savings alone. Secondary gains include reclaimed OEE capacity, lower energy costs, and improved on-time delivery rates.
Book a Demo for a tailored ROI model.
6. Does ifactory replace existing CMMS or ERP systems in a multi-plant environment?
No. ifactory complements existing CMMS, ERP, and MES systems — it does not replace them. The platform adds a real-time analytics and cross-plant intelligence layer on top of current infrastructure, with open API support for SAP, Oracle, Infor, and all major enterprise platforms. PM work orders flow directly into existing systems for approval and parts procurement.