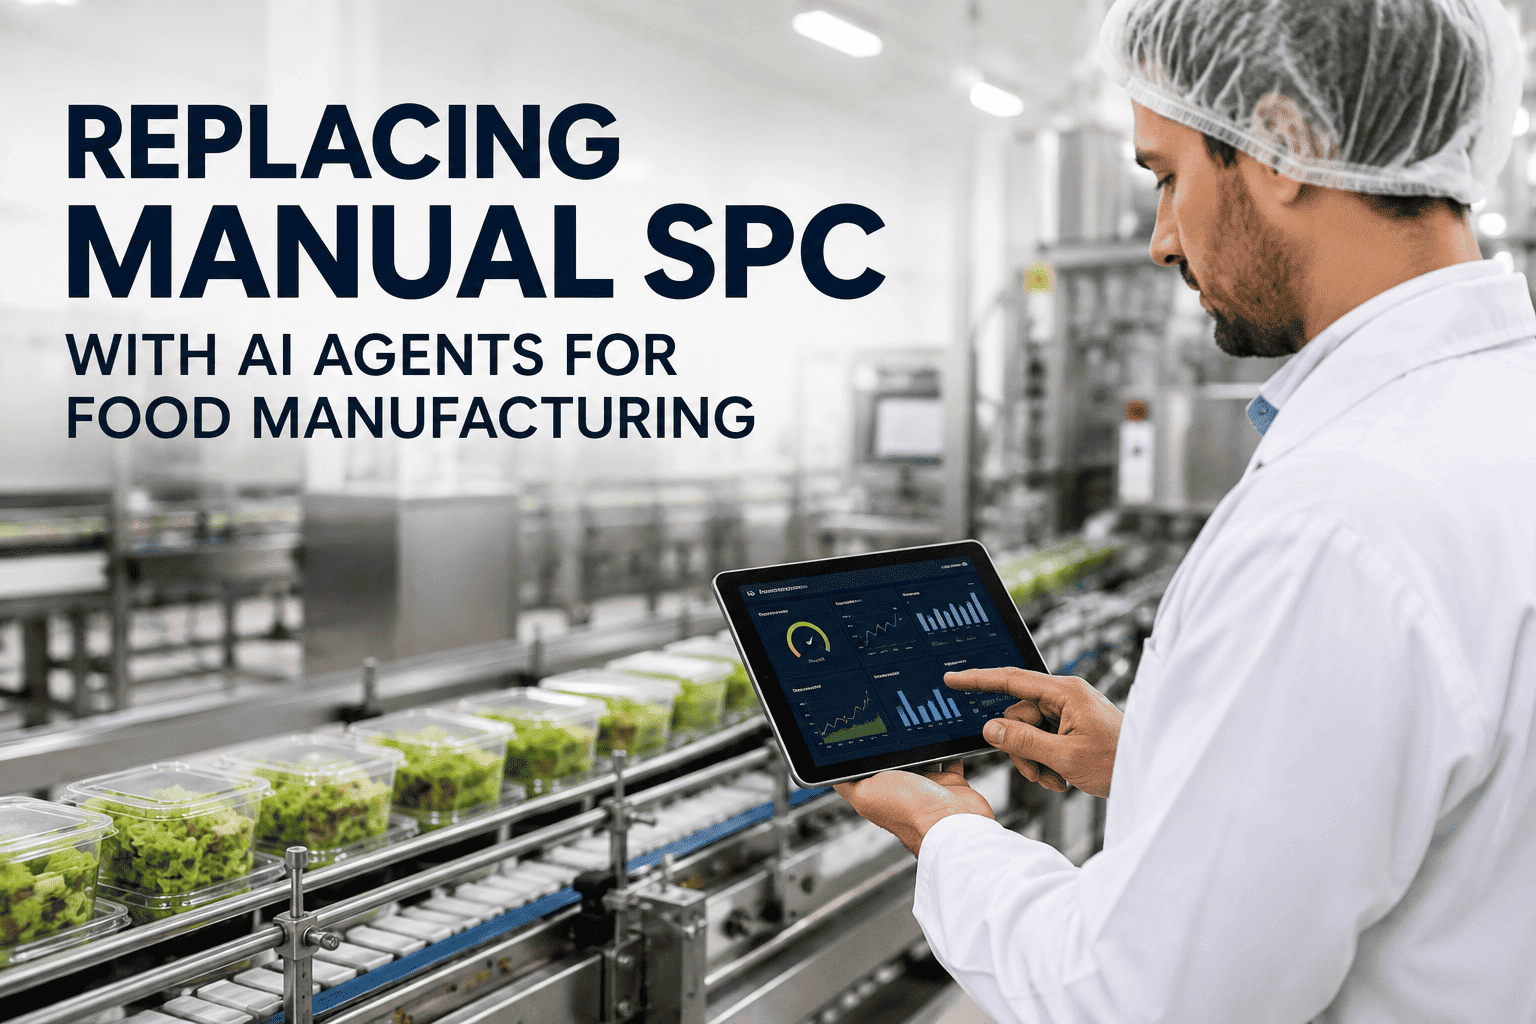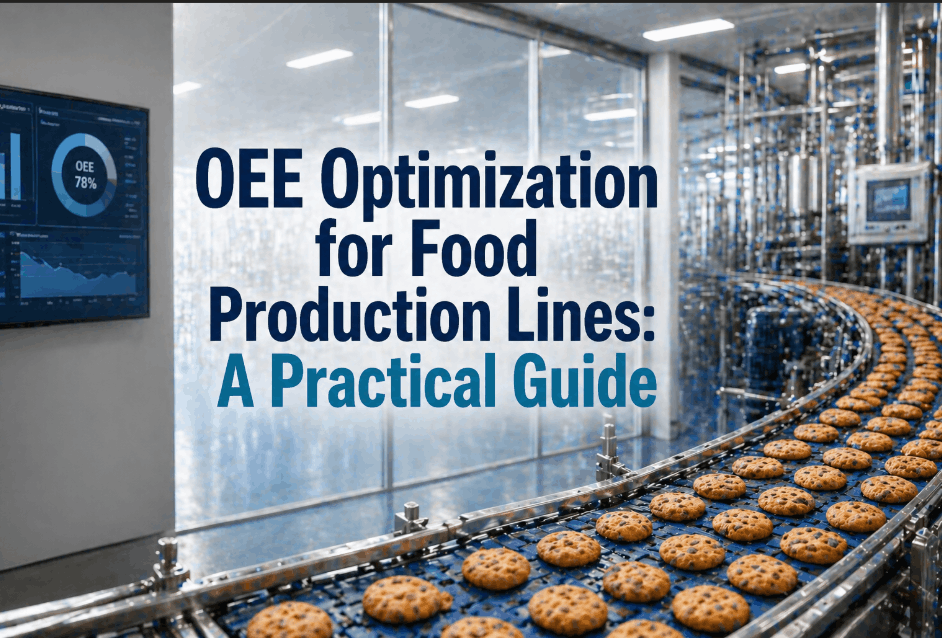
Overall Equipment Effectiveness (OEE) optimization in food production lines is a measurable, data-driven imperative for every plant manager facing margin pressure and SKU complexity in 2026. Food manufacturers running at 55 to 65 percent OEE are leaving recoverable capacity and yield on the table every shift. The three OEE pillars — Availability, Performance, and Quality — each carry distinct loss categories in food processing that require specific analytical frameworks to close. If your facility is ready to move from OEE reporting to real OEE improvement, Book a Demo to see how iFactory's AI-driven OEE platform delivers measurable efficiency gains across your food production lines.
What OEE Actually Measures in a Food Production Context
Understanding the Three OEE Pillars Specific to Food Manufacturing Loss Profiles
OEE in food manufacturing is simple to calculate but difficult to improve because each pillar carries a different root cause structure. Availability losses are dominated by CIP cycles, sanitation changeovers, and regulatory hold events. Performance losses stem from speed reductions during allergen transitions, line imbalance, and micro-stop accumulation on checkweighers. Quality losses trace to fill weight variance, seal degradation, and temperature excursion rejects — all recoverable yield that AI OEE monitoring quantifies and eliminates. Operations managers can Book a Demo to benchmark their loss profile against iFactory's food production OEE database.
OEE Benchmarks for Food Production Lines in 2026
What Good OEE Looks Like Across Food Manufacturing Segments and Line Types
Applying a single OEE benchmark across all food environments creates misleading performance narratives. A high-speed beverage filling line runs under fundamentally different OEE dynamics than a short-run sauce line managing twelve allergen changeovers weekly. The table below provides segment-specific OEE benchmarks across the most common food production line categories — giving operations managers an accurate improvement target rather than a generic 85 percent world-class number that ignores food processing complexity.
| Food Production Line Type | Typical OEE Range | World Class Target | Primary Loss Driver | AI Improvement Lever |
|---|---|---|---|---|
| High-Speed Beverage Filling | 68–76% | 88–92% | Micro-Stops & Speed Loss | Pattern-Based Micro-Stop Prediction |
| Dairy Processing & Packaging | 57–66% | 80–85% | CIP & Sanitation Downtime | Predictive CIP Scheduling |
| Bakery & Confectionery Lines | 54–63% | 78–83% | Changeover & Quality Rejects | AI Changeover Sequence Optimization |
| Ready-to-Eat Meal Assembly | 49–60% | 74–80% | Allergen Changeover Frequency | Allergen Schedule Optimization |
| Meat & Protein Processing | 52–62% | 76–82% | Quality Rejects & Yield Loss | Inline Quality Prediction Models |
| Snack Food & Dry Goods | 62–71% | 82–88% | Speed Loss & Minor Stoppages | Real-Time Speed Loss Analytics |
| Sauce, Condiment & Liquid Fill | 50–61% | 75–82% | Short Run Changeover Frequency | Run Sequence Scheduling AI |
| Frozen Food & IQF Lines | 55–64% | 79–84% | Temperature-Driven Quality Holds | Predictive Temperature Excursion Alerts |
The Six OEE Loss Categories Costing Food Plants the Most in 2026
Mapping the Six Big Losses Framework to Food Manufacturing Reality
The six big losses framework requires food-specific interpretation to drive real improvement actions. Operations managers using discrete manufacturing definitions will systematically undercount the losses that dominate food production — especially those embedded in sanitation compliance, regulatory hold protocols, and biological raw material variability. The breakdown below gives food-specific definitions for each loss type. Facilities can Book a Demo to run a loss category attribution analysis on their own line performance history.
How AI-Driven OEE Tracking Changes Food Production Line Management
From Lagging Shift Reports to Real-Time OEE Intelligence on the Production Floor
Traditional OEE data collection relies on operator-entered shift logs and paper-based downtime records — systems that undercount micro-stops, misclassify loss categories, and produce figures that tell managers what happened yesterday. AI-driven OEE platforms ingest machine state signals and process parameter streams in real time, constructing an automated performance record without operator input. When supervisors see OEE degrading in real time rather than reading a shift summary the next morning, intervention lead time collapses from hours to minutes. Facilities evaluating real-time OEE tracking can Book a Demo for a live dashboard demonstration.
OEE Improvement Strategies: A Pillar-by-Pillar Framework
Practical OEE Optimization Actions Mapped to Availability, Performance, and Quality
Effective OEE improvement in food manufacturing requires a different intervention framework for each pillar — because the loss drivers and available improvement levers differ fundamentally between Availability, Performance, and Quality losses. The improvement actions below are prioritized by measurable OEE impact in food production environments, giving operations managers a sequenced roadmap rather than a generic best-practice list. Facilities can Book a Demo to model the OEE impact applicable to their specific production line configurations.
Building the Business Case for AI OEE Investment in Food Manufacturing
Quantifying the Financial Return on OEE Optimization Technology for Food Plant Leadership
The financial case for AI-driven OEE investment is built on four compounding value streams: recovered production capacity that eliminates capital-intensive line additions, reduced unplanned maintenance expenditure, decreased raw material waste, and enhanced compliance posture that reduces production hold frequency. Food manufacturers deploying AI OEE platforms report measurable outcomes across all four streams within the first operational year — with recovered capacity value alone typically delivering a payback period under 14 months. Operations leaders can Book a Demo to work through a facility-specific financial model with the iFactory analytics team.
Frequently Asked Questions
What is a realistic OEE target for a food manufacturing plant in 2026?
For high-speed single-SKU lines, world-class OEE sits at 85–92%. For multi-SKU allergen-managed lines with frequent changeovers and mandatory CIP cycles, a realistic target is 75–82% — representing a 12–20 point improvement over the industry average of 58–65% for comparable line types.
How does AI improve OEE measurement accuracy compared to manual data collection?
Manual systems undercount micro-stops, misclassify downtime categories, and miss unreported speed reductions. AI automated platforms capture every machine state transition with millisecond accuracy — typically revealing OEE figures 8–15 points lower than manual reports, exposing the true loss landscape that improvement programs need to address.
Which OEE pillar delivers the fastest improvement ROI in food manufacturing?
Availability delivers the fastest ROI through unplanned downtime reduction via predictive maintenance — generating immediate, quantifiable capacity recovery. Performance comes next via micro-stop elimination with low capital requirement. Quality yields the highest long-term ROI through yield recovery and compliance cost reduction.
Can AI OEE monitoring integrate with existing ERP and MES systems in food plants?
Yes. AI OEE platforms integrate bi-directionally with SAP, Oracle, Microsoft Dynamics, and major MES platforms through standard API connections and OPC-UA interfaces. OEE data flows directly into production planning and maintenance modules — and production plan data flows back to enable plan-versus-actual efficiency analysis at the production order level.
How long does it take to implement an AI OEE monitoring system in a food facility?
For a facility with four to ten monitored lines and existing digital sensor infrastructure, implementation runs four to seven weeks from kickoff to live real-time OEE dashboards — covering data connection, model configuration, ERP integration, and team onboarding with zero production line interruption at any stage.
Does OEE improvement in food manufacturing require significant capital investment in new equipment?
No. Analysis consistently shows that 65–75% of recoverable OEE losses in food plants are addressable through operational improvements — predictive maintenance on existing assets, changeover standardization, and process parameter optimization — without capital equipment replacement or approval cycles.