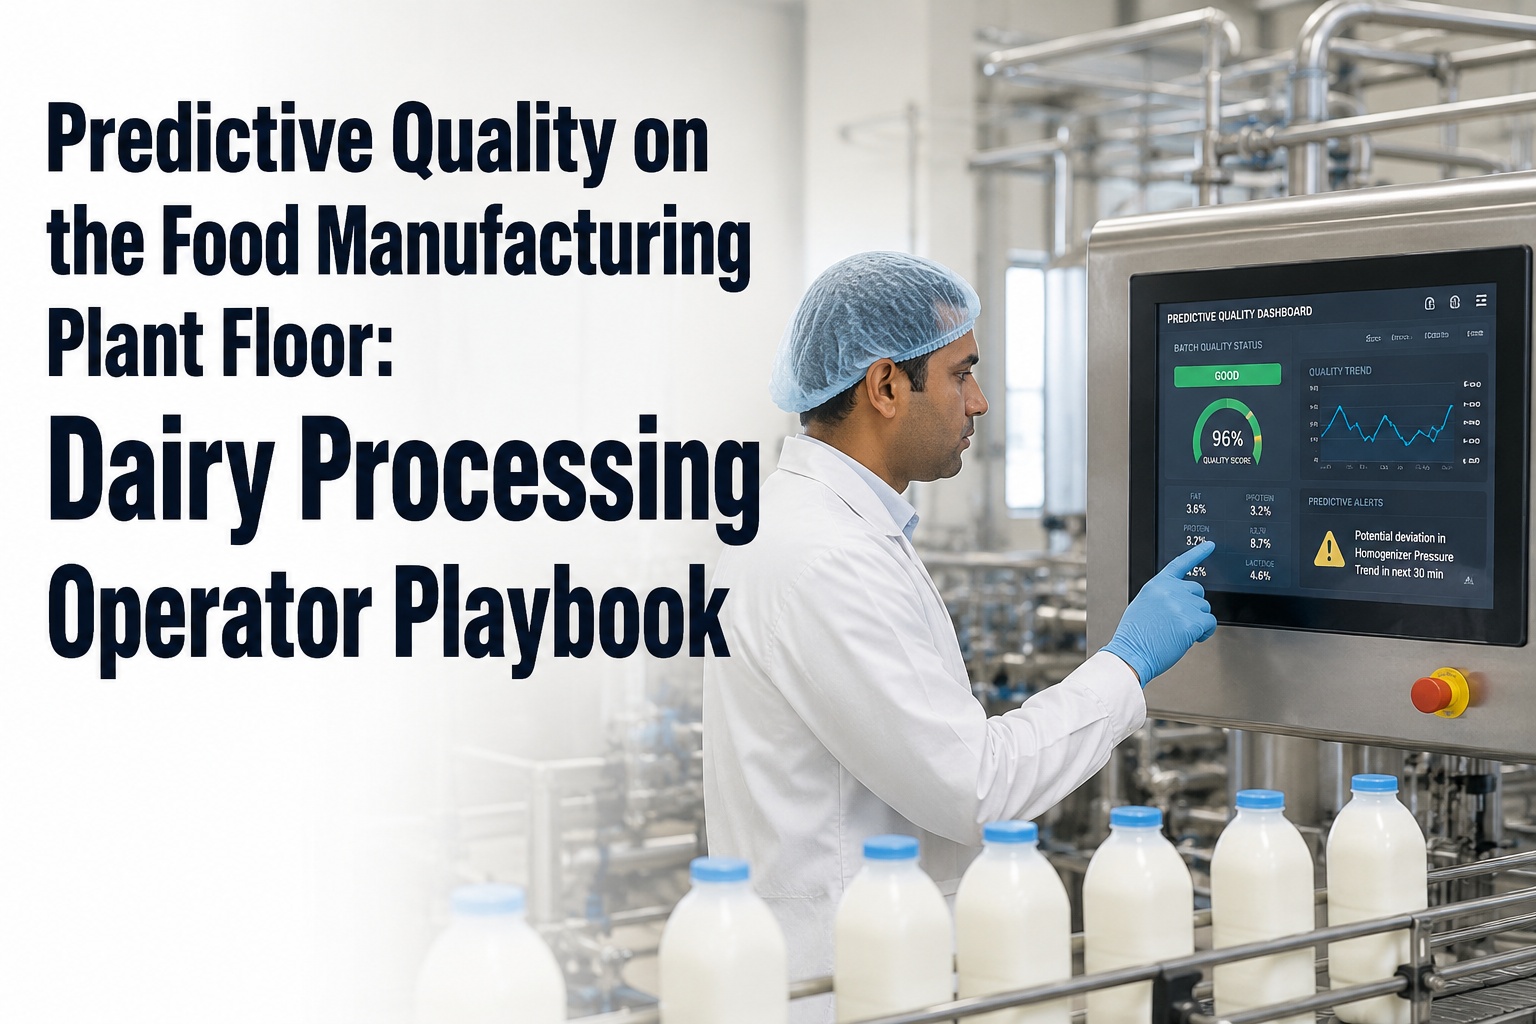
Predictive OEE to Improve Batch Consistency in Dairy Processing
By Riley Quinn on May 27, 2026
CIP consumes 10–20% of total production time in a typical dairy plant — not as a planned cost of doing business, but as the most under-monitored variable cost on the line. A CIP cycle that overruns by 18 minutes doesn’t just steal 18 minutes of availability; it pushes the next batch start into a window where caustic residuals haven’t fully cleared, conductivity hasn’t fully normalized, and the first 200 units of the new batch carry quality variance that wouldn’t have existed otherwise. CIP overruns and batch consistency problems aren’t two separate issues — they are the same problem viewed from two angles. The plants that figured this out in 2026 stopped buying generic OEE software and started evaluating predictive OEE platforms specifically against their CIP cycle behavior. This guide is for dairy operations leaders evaluating predictive OEE for the CIP-to-batch causal chain — how CIP variance degrades batch consistency, what predictive monitoring catches that reactive monitoring misses, the vendor evaluation framework, and the 12-week deployment path. Book a demo with us to see predictive OEE applied to your line’s actual CIP cycle data.
The CIP Cycle Anatomy
Six Phases · Six Drift Points · One Cascading Impact
Predictive OEE monitors every phase continuously. Drift caught in any phase prevents cascading impact on the next batch.
01
Pre-rinse
Warm water flushes product residue
3–5 min
02
Alkaline Wash
Caustic removes protein, fat fouling
15–30 min
03
Intermediate Rinse
Flushes caustic to acid-safe pH
5–8 min
04
Acid Wash
Removes mineral, calcium scale
8–15 min
05
Final Rinse
Clears acid to neutral pH
5–10 min
06
Sanitization
Hot water or chemical sanitizer
8–15 min
44–83
min total cycle
10–20%
of production time
6
independent drift points
The CIP-to-Batch Causal Chain — Where Consistency Problems Begin
Batch consistency problems on dairy lines rarely originate during the batch itself. They originate during the CIP cycle that preceded it. The chain has four links — CIP drift cascades to phase overrun cascades to incomplete rinse cascades to batch variance. Predictive OEE breaks the chain at link two, before residuals reach the product.
01
Cause
CIP Cycle Drift
Alkaline phase runs longer than baseline. Soil load heavier than expected, pump pressure degraded, or temperature below 70°C target.
Caught 5–15 min before phase completes
02
Effect
Phase Overrun
Intermediate rinse forced to run longer to compensate. Conductivity sensor shows residual caustic taking extra time to clear acid-safe pH threshold.
Visible in conductivity curve before timeout
03
Cascade
Incomplete Rinse-Out
Final rinse declared complete on time, but conductivity profile shows a flatter curve than baseline. Residual chemistry remains in piping and equipment.
Curve shape predicts residual contamination
04
Result
Batch Variance
First 200–500 units of the new batch carry pH variance, conductivity variance, or trace chemistry that wouldn’t exist with clean rinse-out.
Variance traceable to specific CIP phase
What Predictive OEE Catches in Each Phase — The Signature Table
Each CIP phase produces a characteristic signature in temperature, pressure, flow, and conductivity data. Predictive OEE monitors all four streams continuously and recognizes drift from baseline. Here’s what the platform watches in each phase — the technical credibility most generic OEE platforms can’t match.
Swipe horizontally to see each phase signature
CIP Phase
Variables monitored
Drift signature predictive OEE catches
01 · Pre-rinse
Flow rate · temperature · turbidity
Heavy soil load detected via flushed turbidity peak — CIP duration auto-extends in alkaline phase
02 · Alkaline Wash
Caustic concentration · temperature · flow velocity
Concentration drift below 1.5% NaOH or temperature below 70°C — alert before phase completes
Flatter conductivity curve than baseline — predicts incomplete rinse-out 3–5 min before timeout
04 · Acid Wash
Acid concentration · temperature · conductivity
HNO3 concentration drift outside 0.5–1.0% range — mineral scale removal incomplete
05 · Final Rinse
Conductivity to baseline · pH neutralization · duration
Conductivity curve shape vs historical baseline — predicts batches that will carry rinse residuals
06 · Sanitization
Temperature hold · duration · sanitizer concentration
Hold-temperature dwell below 85°C for < 5 min — sanitization risk alert before declared complete
The Three Batch Metrics That Actually Move
The commercial question isn’t whether predictive OEE catches CIP drift — it’s whether catching drift improves batch consistency in measurable ways. Three metrics matter on dairy lines. Each responds differently to predictive CIP monitoring. The math is mechanical, not theoretical.
Batch-to-Batch Variance
σ across consecutive batches
Before
15–25%
After
5–10%
CIP drift caught before residuals enter next batch — first 200–500 units stay in spec
First-Pass Yield
Good batches ÷ Total batches
Before
85–92%
After
96–99%
Rework batches reduced via structural elimination of CIP-induced startup variance
CIP Cycle Time Compliance
Cycles within window ÷ total
Before
65–78%
After
92–98%
Phase drift caught early enough to remediate within cycle window rather than overrun
Want a baseline projection for these three metrics on your line based on your historian data? Book a CIP-batch baseline assessment with our dairy OEE specialists.
From CIP Variance to Batch Consistency in 6–12 Weeks
iFactory ships a pre-configured predictive OEE server tuned for dairy CIP cycles — pasteurizers, separators, homogenizers, fillers, tanks. Reads existing conductivity, flow, temperature, and pressure sensors. Delivers first phase-drift alerts within 6–8 weeks of deployment.
OEE software vendors broadly handle availability, performance, and quality. CIP-aware predictive OEE is a more specialized capability set. Eight criteria determine whether a vendor actually models CIP cycle behavior or just measures total downtime. Walk into vendor conversations with this checklist and close the gap between “we monitor downtime” and “we predict batch consistency outcomes.”
01
Phase-level CIP modeling
Ask:
"Does your platform model each of the six CIP phases separately, or is the whole CIP cycle a single block?"
Single-block CIP monitoring tells you the cycle was long. Phase-level modeling tells you which phase drifted, why, and what to do. The difference between Tier 2 and Tier 3 OEE platforms shows up here first.
02
Conductivity curve baseline learning
Ask:
"Does your platform learn each asset’s normal conductivity curve shape and flag deviations?"
Conductivity curve shape during intermediate and final rinse is the strongest predictor of residual contamination. Platforms that only check end-of-rinse conductivity miss the curve-shape variance that predicts batch variance.
03
Multi-variable phase correlation
Ask:
"How many sensor streams does your platform correlate per CIP phase?"
Each phase has 3–5 variables that matter (temperature, pressure, flow, concentration, conductivity). Production-grade platforms correlate all of them. Single-variable platforms miss combination drift.
04
Predictive lead time per phase
Ask:
"How many minutes before phase timeout does the platform alert on drift?"
3–15 minutes per phase is the production-grade benchmark. Less than 3 minutes is too late to remediate. More than 15 minutes suggests the platform may flag false positives rather than real drift.
05
Soil-load adaptation
Ask:
"Does the platform adjust CIP expectations based on previous batch SKU?"
CIP after high-fat cream has different signatures than CIP after skim milk. Platforms that ignore previous-batch context generate false alerts. Production-grade platforms learn SKU-specific CIP baselines automatically.
06
Batch-CIP causal linkage
Ask:
"Does your platform trace batch variance back to the specific CIP phase that caused it?"
Tracing batch variance to a CIP phase turns the platform from monitoring tool to root-cause tool. Without this linkage, the platform produces reports but doesn’t close the consistency loop.
07
PLC and SCADA integration
Ask:
"Which industrial protocols do you support natively for CIP controllers?"
OPC UA, Modbus TCP, EtherNet/IP, PROFINET should all be native. Most dairy CIP controllers (Tetra Pak, GEA, Alfa Laval) communicate over one of these. Custom adapters add deployment risk.
08
Deployment timeline
Ask:
"When does first validated CIP phase alert appear in production?"
6–8 weeks is the production-grade benchmark with pre-configured dairy CIP templates. Vendors quoting 6+ months are building from scratch, not deploying.
The First 90 Days — What Operators Actually Do Differently
The change isn’t about adding work. It’s about shifting from reactive CIP closeout to proactive phase intervention. Three operator behaviors change during the first 90 days post-deployment — each one compounds into measurable batch consistency improvement by quarter end.
30
days
Phase alerts replace cycle alarms
Instead of waiting for total CIP timeout, operators receive alerts during phase 02 or 03 saying “alkaline wash trending 4 minutes over baseline.” Intervention happens during the cycle, not after.
60
days
Conductivity curves become routine reading
Operators learn to read conductivity curve shape during intermediate and final rinse. A flat curve where it should be steep means residuals — visible 5–8 minutes before phase timeout would have declared completion.
90
days
Batch consistency tracks to CIP variance
Operators start seeing the causal linkage in their dashboards. A batch with 12% pH variance in the first 200 units traces back to a specific rinse with abnormal conductivity curve. Investigation becomes lookup.
"CIP consumes 10–20% of total dairy production time and accounts for an outsized share of batch consistency problems — yet most dairy plants still treat CIP as a black box between production runs. The plants moving to predictive OEE specifically for CIP cycle modeling in 2026 aren’t buying availability monitoring — they’re buying the causal linkage between CIP variance and batch variance that has been invisible to operators for forty years. Conductivity curve shape during intermediate and final rinse is the single strongest predictor of which batches will carry quality variance. Phase-level CIP modeling combined with conductivity baseline learning is the capability that separates real predictive OEE from rebranded reactive monitoring."
— Dairy Manufacturing CIP Practice, 2026 industry insight
10–20%
share of dairy production time consumed by CIP operations
6 phases
each modeled independently in production-grade predictive OEE
3–15 min
predictive lead time per CIP phase before timeout would declare completion
Conclusion: CIP Was Always the Hidden OEE Variable — Now It’s Visible
Batch consistency problems on dairy lines have a CIP cycle in their causal history far more often than the OEE dashboard shows. Reactive OEE software treated CIP as planned downtime — a single block between batches. Predictive OEE inverts that. CIP is six phases, each with its own signature, each capable of drift, each capable of cascading into batch variance the operator will see hours later. The plants that figured this out in 2026 stopped buying generic OEE software and started evaluating vendors specifically against the CIP-to-batch causal chain — phase-level modeling, conductivity curve baseline learning, multi-variable correlation per phase, soil-load adaptation, batch-CIP linkage. Eight criteria, one decision. The deployment runs 6–12 weeks. The first phase-drift alerts arrive within 6–8 weeks. Batch consistency starts climbing within the first quarter. The CIP cycle that consumed 10–20% of production time becomes the single largest source of OEE improvement once predictive monitoring makes it visible. Book a demo with us to see predictive CIP monitoring applied to your line’s actual cycle data.
Run the CIP-Specific Vendor Evaluation for Your Line
iFactory’s dairy CIP practice runs a 30-minute working session through every criterion in the framework against your line’s real CIP cycle data. You leave with a baseline projection for batch-to-batch variance, first-pass yield, and CIP cycle time compliance — plus a clear path through 12-week deployment.
Why are CIP overruns connected to batch consistency rather than just availability?
Because CIP isn’t just cleaning — it’s the controlled preparation of equipment for the next batch’s starting conditions. When CIP phases drift, the resulting incomplete rinse-out leaves caustic, acid, or other chemistry residuals in piping, plate heat exchangers, separators, and tanks. The first 200–500 units of the next batch carry that residual chemistry, producing measurable pH variance, conductivity variance, and trace contamination that wouldn’t exist with a clean rinse-out. The causal chain is: CIP cycle drift → phase overrun or incomplete rinse-out → residual chemistry → first-batch units off-spec. Predictive OEE breaks every link by catching drift in phases 02, 03, and 05 before residuals reach the next batch.
What does "conductivity curve baseline learning" actually mean in practice?
Every dairy asset has a characteristic conductivity curve shape during intermediate and final rinse phases — a fingerprint that reflects piping geometry, surface area, and flow paths specific to that asset. Baseline learning means the predictive OEE platform observes 100–200 CIP cycles per asset, builds a statistical envelope around the normal curve shape, and flags new cycles whose curve shape falls outside that envelope. A flat curve where the baseline shows a steep one indicates residual caustic. A late peak indicates pump degradation. A noisy curve indicates valve issues. Each shape deviation predicts a specific kind of batch consistency risk — before the operator would see it through end-of-rinse conductivity alone.
How quickly should batch consistency metrics actually improve after deployment?
The first 30 days post-deployment typically show 20–30% reduction in batch-to-batch variance just from operators receiving phase-level alerts and intervening within the CIP cycle rather than after timeout. Days 30–60 add another 15–20% improvement as conductivity curve baseline learning matures and the platform predicts which specific CIP cycles will produce variance. Days 60–90 deliver the structural improvement as soil-load adaptation kicks in and CIP cycles adjust automatically to previous-batch SKU characteristics. Typical 90-day baseline: batch-to-batch variance from 15–25% pre-deployment to 5–10% post-deployment, first-pass yield from 85–92% to 96–99%. These numbers are documented across multiple recent dairy deployments — not theoretical projections.
Does this replace our existing CIP controller, PLC, or SCADA?
No. Predictive OEE sits above your existing CIP controller (Tetra Pak, GEA, Alfa Laval, or other), PLC, and SCADA. The CIP controller continues running cycle logic exactly as today — phases, temperatures, durations, conductivity thresholds. The PLC continues handling control actuation. SCADA continues displaying alarms operators are trained on. What changes is that conductivity, flow, temperature, and pressure data from all those existing systems now flow through a predictive OEE layer that learns each asset’s baseline, watches each phase for drift, and surfaces phase-level alerts on the operator HMI 3–15 minutes before timeout. Deployment runs 6–12 weeks because the platform is additive, not replacement.
What separates a CIP-aware predictive OEE vendor from a generic OEE vendor?
Eight CIP-specific criteria distinguish CIP-aware vendors from generic OEE vendors: phase-level modeling of all six CIP phases (not single-block CIP duration tracking); conductivity curve baseline learning per asset (not just threshold alarms); multi-variable correlation across temperature, pressure, flow, concentration, and conductivity per phase; 3–15 minute predictive lead time per phase; soil-load adaptation that adjusts CIP expectations based on previous-batch SKU; batch-CIP causal linkage tracing batch variance back to specific phases; native protocol support for OPC UA, Modbus TCP, EtherNet/IP, PROFINET; and 6–8 week deployment with pre-configured dairy CIP templates. Generic OEE platforms cover availability/performance/quality at the asset level. CIP-aware platforms cover the same plus the six-phase CIP cycle that consumes 10–20% of dairy production time.