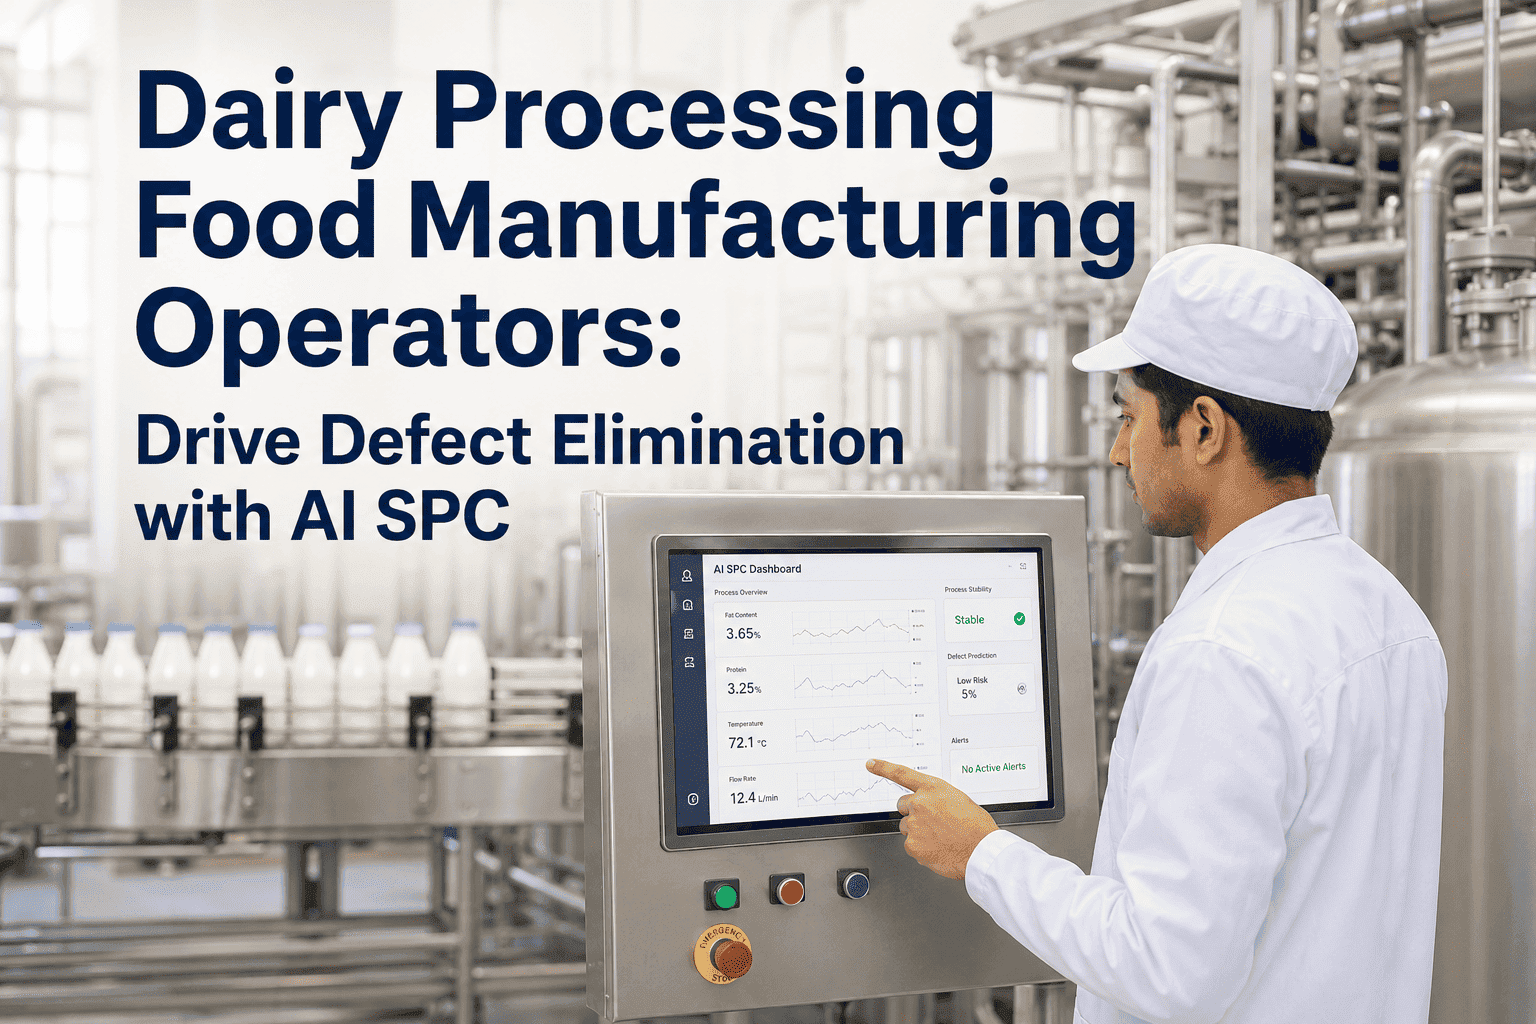
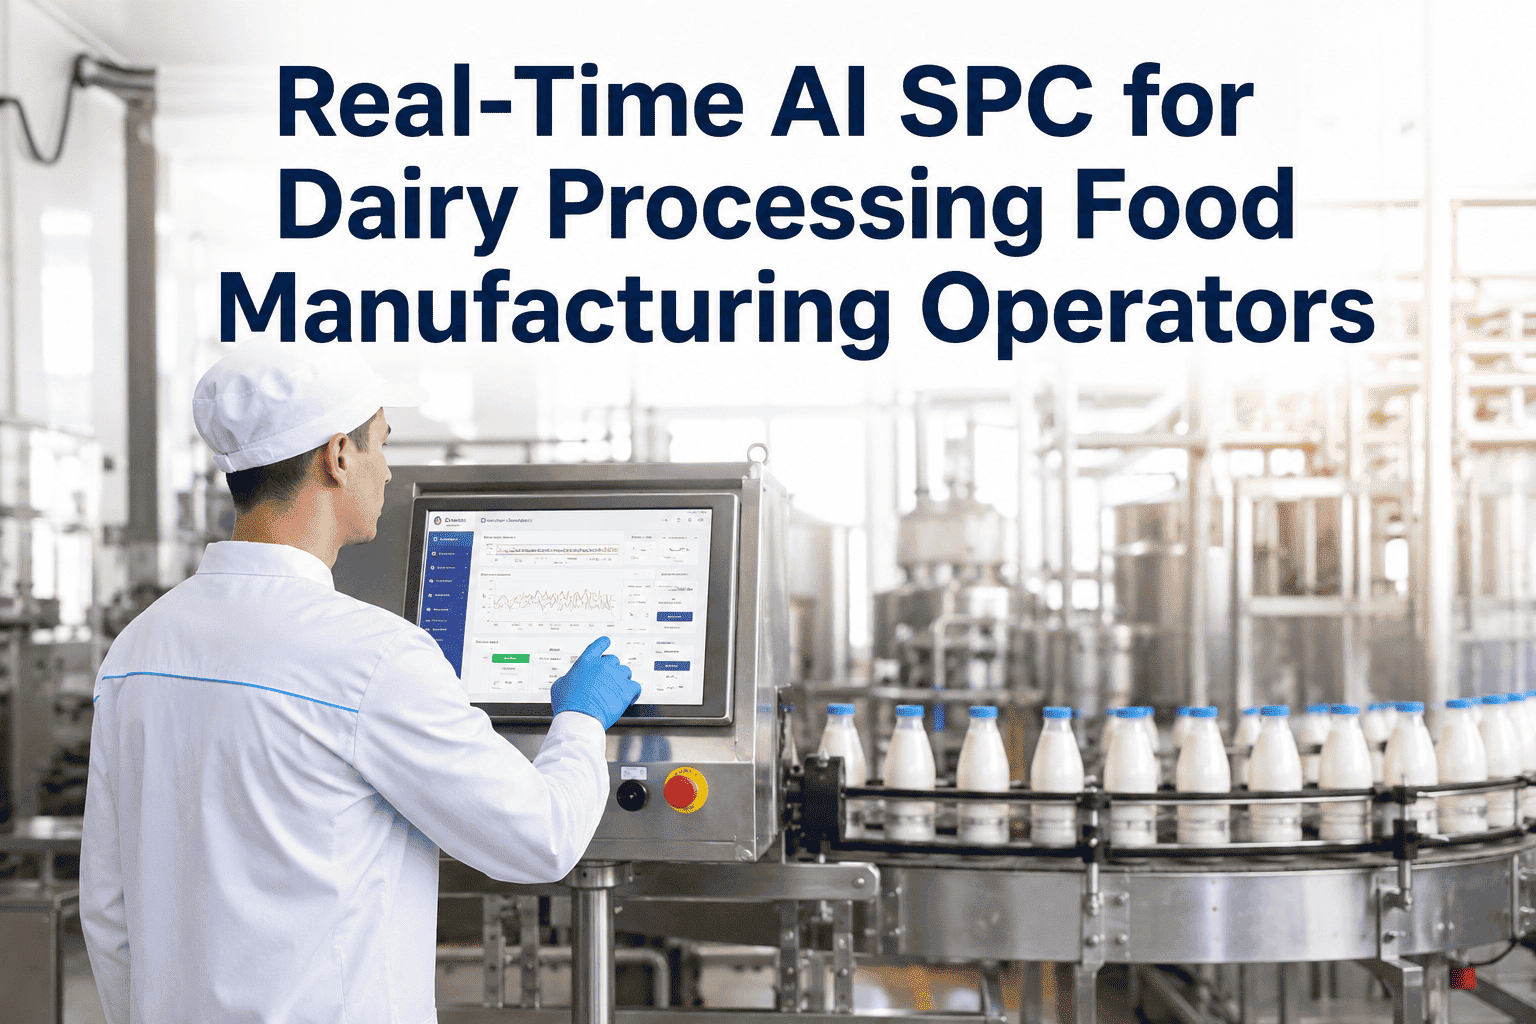
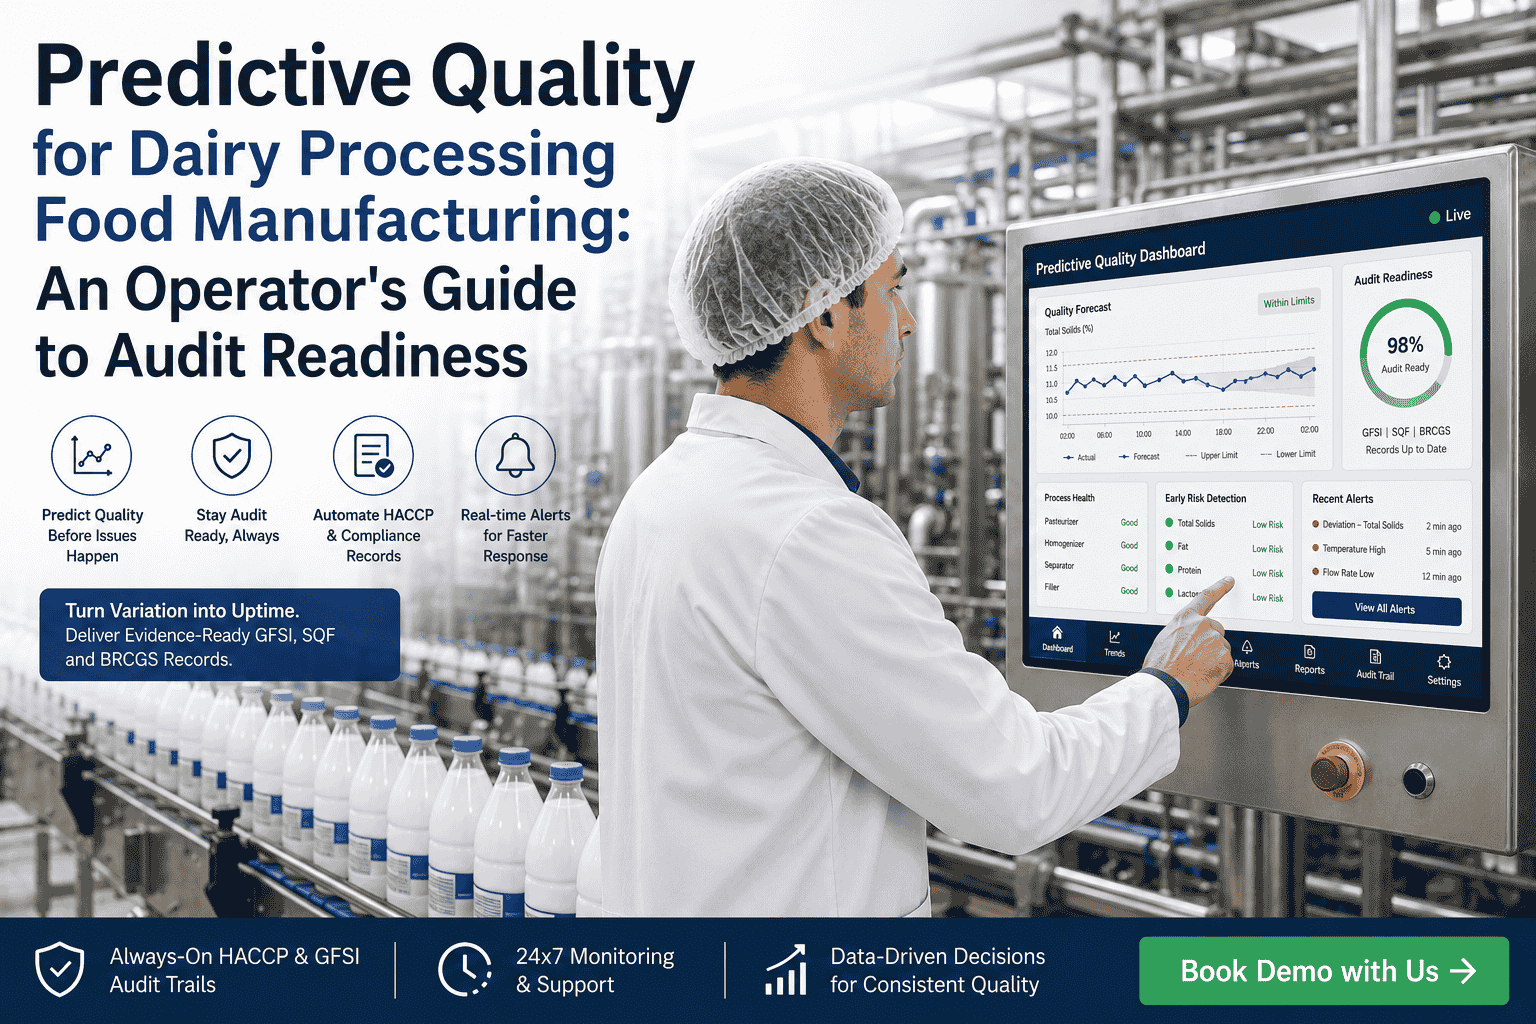
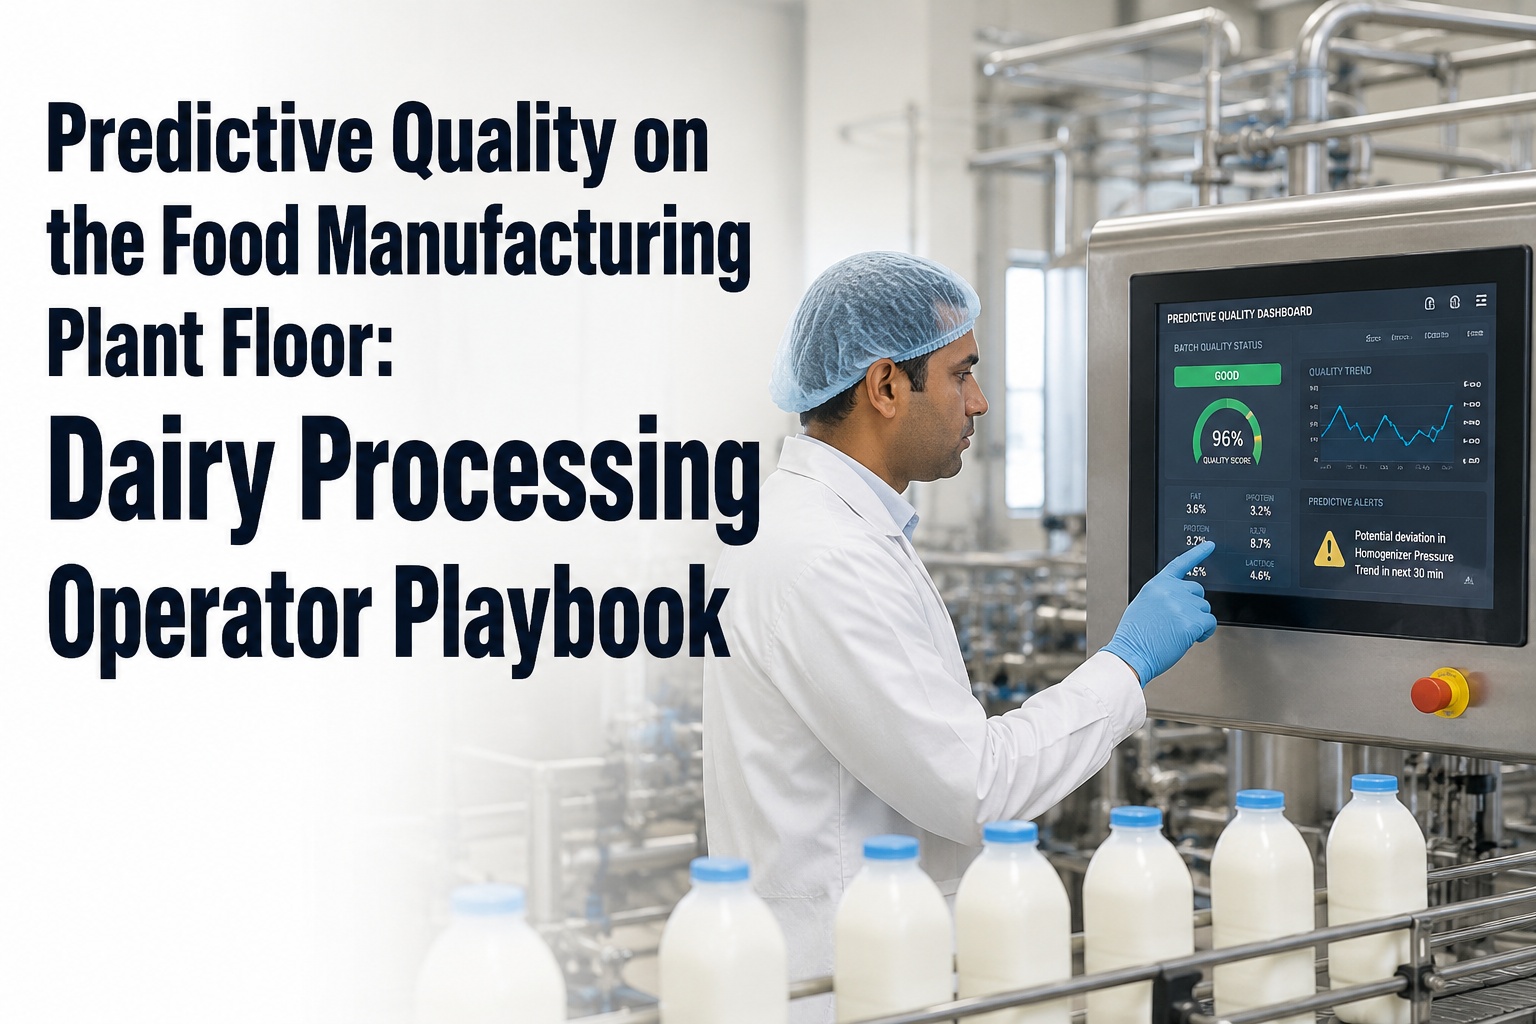
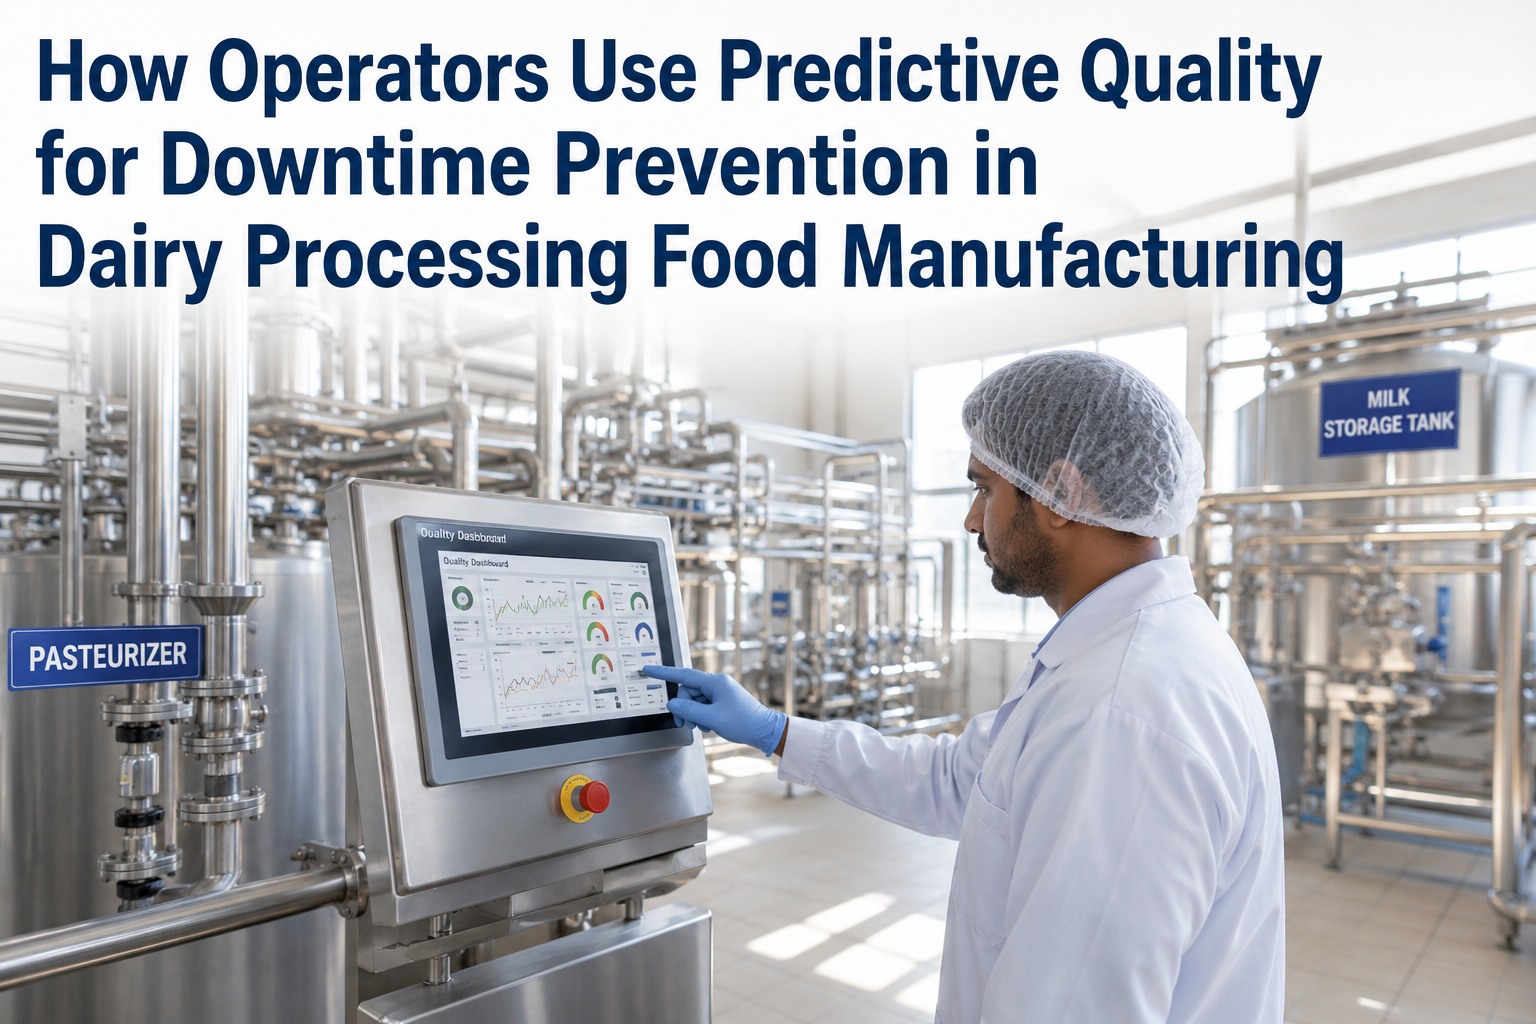
It’s 03:47 on a Tuesday graveyard shift. The filler line is humming at 240 packs a minute. You’re three hours into a yogurt run when the panel flashes amber: Fat content drifting toward upper spec limit on Line 3. You haven’t pulled a lab sample in 40 minutes. Your old training says wait for the next QA pull and adjust. Your new platform says you have nine minutes before the trend crosses spec and triggers a forced stop, with a recommended valve adjustment two screens away. This is what predictive quality analytics actually changes for a dairy line operator — not abstract AI, but a clear, early, actionable signal that turns variation into uptime instead of into a stoppage and a CAPA ticket. This guide walks through how it works on the shop floor, what alerts look like, and how to act on them. Book a demo with us to see your filler, your viscosity sensor, your CIP cycles, on a live platform.
Pasteurizer
73.8°C
Stable · 6 min holdup
Homogenizer
180 bar
In window
Filler Line 3
+0.18%
Fat drifting up · 9 min
CIP cycle
On schedule
Next: 06:00
Predicted spec breach in 9 min · Filler Line 3
Recommended action: trim cream metering valve V-204 by 1.2% — eliminates breach in 3 min
What Predictive Quality Actually Does on a Dairy Line
Traditional dairy quality is reactive: you pull a sample, send it to the lab, get a result 30–90 minutes later, then adjust. By that time, an entire pallet of off-spec product may already be sealed and stacked. Predictive quality flips this. AI models running on existing PLC and SCADA data spot the early signals of drift — viscosity creep, temperature wobble, fat content trend, filler nozzle variance — and give you minutes of lead time to correct before the line goes out of spec.
Without predictive quality
Reactive Loop
1
Lab sample pulled every 30–60 min
2
Result back 30–90 min later — problem already 60+ min in
3
Line stop, rework, CAPA, batch loss
4
Same defect recurs next shift
With predictive quality
Proactive Loop
1
AI watches 80+ tags continuously, 24/7
2
Drift detected before spec breach — 5–15 min lead time
3
Operator HMI alert with ranked corrective action
4
Line stays in spec, batch saved, knowledge logged
The 5 Signals Your Predictive Quality Layer Watches
Most dairy operators are surprised at how many process variables actually correlate with quality defects. The AI doesn’t look at one tag in isolation — it watches the relationship between them. Here are the five signal families that matter most on a typical dairy line.
01
Fat & Solids Content Drift
Inline NIR and density sensors stream composition data. AI flags when fat or total solids start trending toward upper or lower spec limits — usually 5–10 minutes before lab confirmation.
Pasteurizer · Separator · Standardizer
02
Viscosity & Mouthfeel Indicators
Yogurt and cream cheese batches develop characteristic viscosity curves. Deviation from the expected curve at fermentation milestones predicts texture defects long before sensory QA picks them up.
Fermentation tanks · Homogenizer
03
Pasteurization Time-Temperature
HTST and UHT cycles have non-negotiable T-t profiles. AI catches small holdup deviations and predicts microbial risk windows — protecting both quality and food safety compliance.
HTST · UHT · Holding tubes
04
Filler & Packaging Variance
Overfills and underfills are the largest hidden cost on most dairy lines. AI models forecast nozzle drift cycle-by-cycle — cutting overfills by 50% on viscous products like cheese spreads and yogurt.
Filler · Cappers · Sealers
05
CIP Cycle Effectiveness
Conductivity, turbidity, and temperature curves during cleaning cycles predict residue carryover risk into the next batch. Missed CIP issues are a top source of cross-contamination incidents.
CIP loops · Buffer tanks
See it on your line
Walk through your specific signals with our dairy specialists in a 30-minute demo.
Book a Demo
Curious which of these five signals is driving the most variation on your line? Book a quick demo and we’ll show you on your historian data.
Anatomy of an Alert: From Signal to Action in 3 Steps
The whole point of predictive quality is that it stays out of your way until it has something useful to say. Then it gives you exactly enough information to act — no dashboard archaeology, no calling QA, no waiting on lab results. Here’s what that looks like in practice.
Step 01
The Signal Surfaces
A small banner appears on your HMI. Yellow = early warning, orange = imminent breach, red = action required now. The banner shows the asset, the variable trending, and the predicted time-to-spec-breach.
Filler Line 3 · Fat % trending up
Predicted breach in 9 min
Step 02
The Recommended Action
One tap on the banner opens the prescriptive action. It tells you exactly which valve, setpoint, or recipe parameter to change — based on what worked for this defect pattern across thousands of previous events.
Trim valve V-204 by 1.2%
Expected resolution in 3 min · Confidence 94%
Step 03
The Closed Loop
You confirm the action, the AI watches the result, the event is logged in the failure-pattern library for the next operator. No CAPA paperwork, no shift-handoff confusion — it’s already documented.
Resolved · line in spec
Logged automatically · CAPA: none required
What This Means in Numbers Your Plant Manager Will Care About
The operator-level value is concrete: fewer line stops, fewer surprise CAPAs, fewer 4am calls to QA. The plant-level ROI follows directly from those same operator wins. Here are the numbers documented across dairy and food-and-beverage deployments.
50%
Quality variability reduction
Average drop in batch-to-batch variation across dairy processors running AI quality control
50%+
Overfill reduction on filler lines
Cream cheese, mayonnaise, and viscous spread fillers reducing overfill waste with negligible underfill risk
~10%
Throughput improvement
Processors using AI-driven quality prediction models report measurable line throughput gains
94.3%
Failure prediction accuracy
LSTM machine learning models in benchmark studies on manufacturing equipment failure forecasting
From First Alert to Stable Line — in 6–12 Weeks
iFactory ships a pre-configured AI server tailored to dairy processing, integrates with your existing PLC and SCADA, and delivers first validated alerts to operators within 6–8 weeks. 24x7 monitoring, mobile alerts, no rip-and-replace.
How It Plugs In — Without Replacing Your PLC or SCADA
This is the part most operators worry about: “Is someone going to rip out the controls I’ve relied on for ten years?” No. The predictive quality layer sits above your existing stack. It reads from your PLCs and SCADA over standard protocols, runs models on a pre-configured AI server, and pushes alerts back to your HMI or your phone. Nothing in the control loop changes.
Operator Interface
HMI banner alerts · Mobile push notifications · Shift dashboards · Mobile-first design
iFactory AI Layer
Pre-configured AI server · Anomaly detection · Predictive models · Prescriptive actions · 24x7 monitoring
Your Existing Stack — Untouched
PLC · SCADA · Historian · MES · LIMS · Existing sensors and inline analyzers
Wondering if your specific PLC vendor and SCADA stack are supported? Book a 30-minute integration demo and bring your stack list.
Expert Perspective
"The biggest gain isn’t the technology — it’s what happens to the operator’s job. Predictive alerts move people from reactive firefighting to confident, planned interventions. Operators report less stress, fewer surprise stoppages, and a clear sense of ownership over their line’s performance. That’s before any of the quality variability or throughput numbers show up on the plant manager’s dashboard. The math works because the human work works first."
— Dairy Processing Digitalisation Practice, 2026 industry insight
$48.99B
AI in food and beverage market by 2029
38.3%
annual growth rate of AI in F&B sector
6–8 wk
typical time from go-live to first validated alerts
Conclusion: The 3am Shift Just Got Quieter
Dairy operators don’t need more dashboards. They need fewer surprises. Predictive quality analytics deliver exactly that — not flashy AI demos, but a quiet, reliable layer that watches every tag on the line, catches drift before it becomes defect, and tells you in plain language what to adjust. The 50% variability drop, the 50% overfill cut, the 10% throughput lift are downstream consequences. The upstream change is that the line stops surprising you, the QA team stops chasing you, and the next operator who walks in for the next shift finds a line that’s already learned from yours. That’s what turns variation into uptime. Book a demo with us to see it on your line.
Bring Predictive Quality to Your Line
iFactory’s dairy practice deploys in 6–12 weeks with a pre-configured AI server, 24x7 monitoring, and integration with your existing PLC and SCADA. See your filler, your CIP, your pasteurizer running with predictive alerts in a single working session.
Frequently Asked Questions
What is predictive quality analytics for dairy processing?
Predictive quality analytics is AI software that continuously monitors dairy processing data from PLCs, SCADA, inline analyzers, and historians, identifies the early signals of quality drift, and gives operators 5–15 minutes of lead time to correct before the line goes out of specification. It tracks fat and solids content, viscosity curves, pasteurization time-temperature, filler nozzle variance, and CIP cycle effectiveness simultaneously, surfacing prescriptive actions on the operator HMI rather than dashboards that require interpretation. Plants typically see 50% reductions in quality variability, 50%+ reduction in filler overfills, and around 10% throughput improvement within the first year.
How does the operator actually receive the alerts on the shop floor?
Alerts appear directly on the operator’s HMI as a banner that escalates from yellow (early warning) through orange (imminent breach) to red (action required). The banner shows the asset, the variable trending, the predicted time-to-breach, and a one-tap recommended corrective action with confidence score. Mobile push notifications are also available for shift supervisors and maintenance leads, with the same prescriptive action attached. Once the operator confirms the action, the AI watches the result, automatically logs the event, and updates the failure-pattern library — no separate CAPA workflow needed for in-spec corrections.
Do we need to replace our PLC, SCADA, or existing dairy quality systems?
No. iFactory’s predictive quality layer is hardware-agnostic and sits above your existing controls stack. It reads data from any PLC vendor and SCADA system through standard industrial protocols, runs predictive models on a pre-configured AI server, and pushes alerts back to your existing HMI or operator dashboards. Your historian, MES, LIMS, and inline analyzers continue to function exactly as they do today. Nothing in the control loop changes, and no operator retraining on the controls layer is needed.
How long does it take to deploy predictive quality analytics on a dairy line?
Typical deployment runs 6–12 weeks from kickoff to operators receiving validated alerts. The first 2–3 weeks cover sensor inventory, PLC and SCADA integration, and data flow validation. The next 4–6 weeks are model calibration against 6–8 weeks of your historian data, with iFactory’s dairy-specific pre-configured AI templates accelerating most of this work. The final 2–4 weeks involve alert threshold tuning with the operator team to eliminate false positives while preserving early-warning lead time. Most plants report first validated alerts within 6–8 weeks and full operator adoption by week 10–12.
Will operators trust prescriptive AI recommendations on the line?
Trust is built through validation, not assertion. iFactory runs every prescriptive action against historical events from your plant before exposing it to operators, with a confidence score attached to each recommendation. Early in deployment, every alert is reviewed alongside the operator and either confirmed or refined. Once the model demonstrates consistent accuracy — typically after the first 4–6 weeks of calibration — operator adoption follows naturally because the alerts are clearly saving them firefighting time. Dairy industry research consistently shows that intuitive mobile-first interfaces and real-time insights foster a sense of ownership, reduce stress, and boost morale on the line.