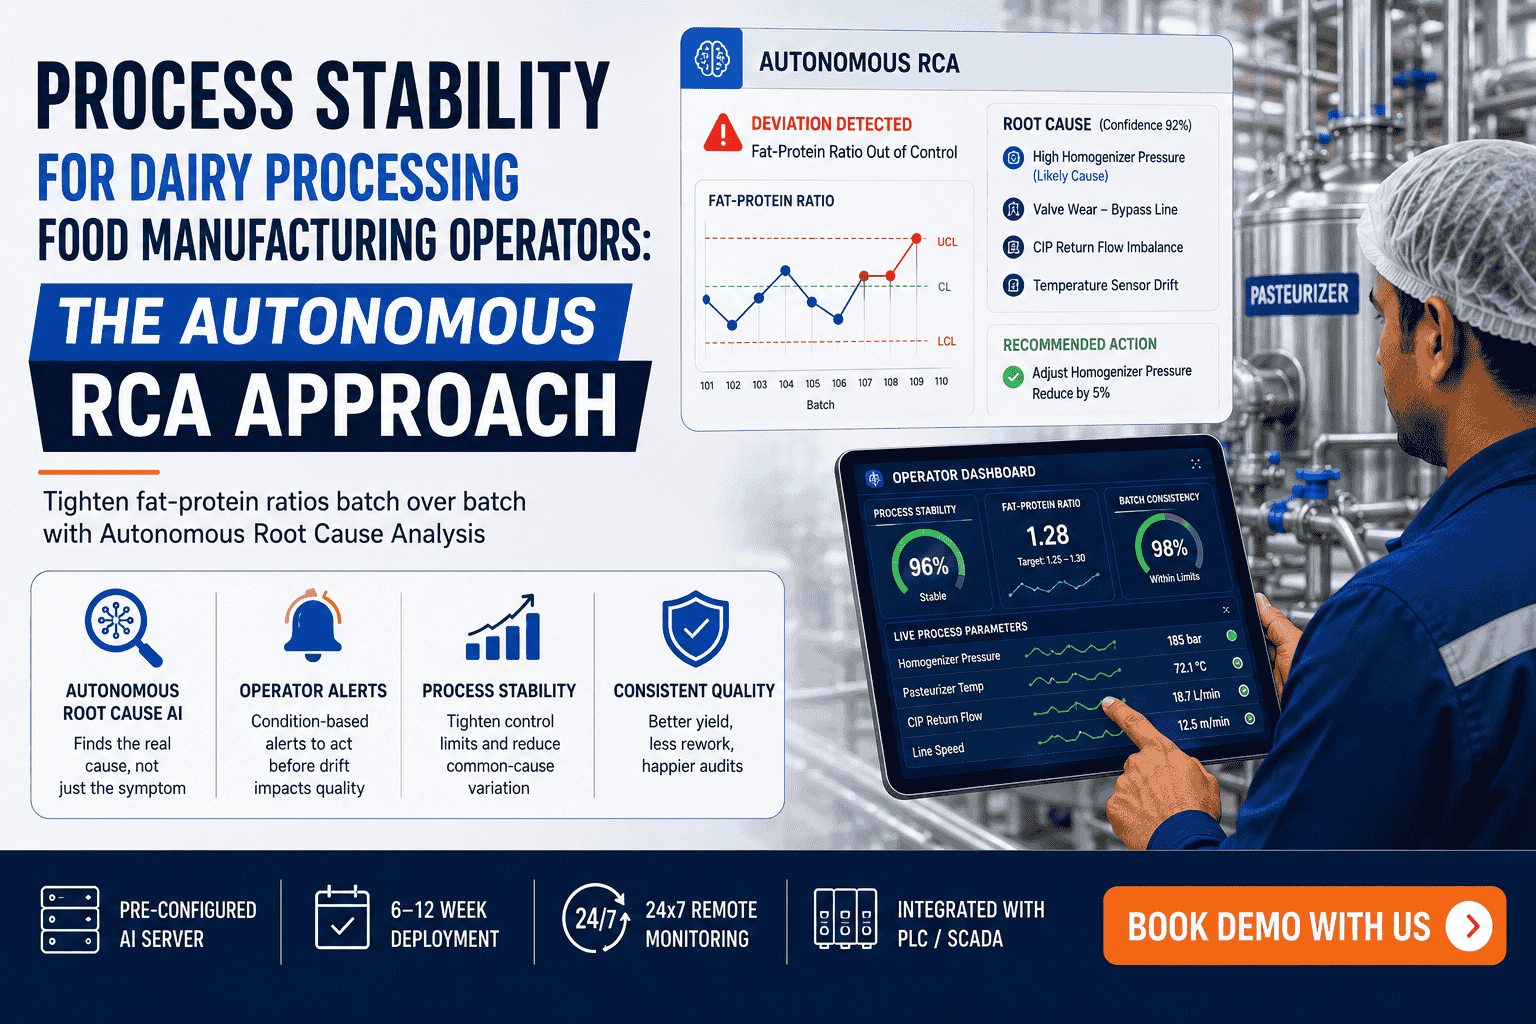
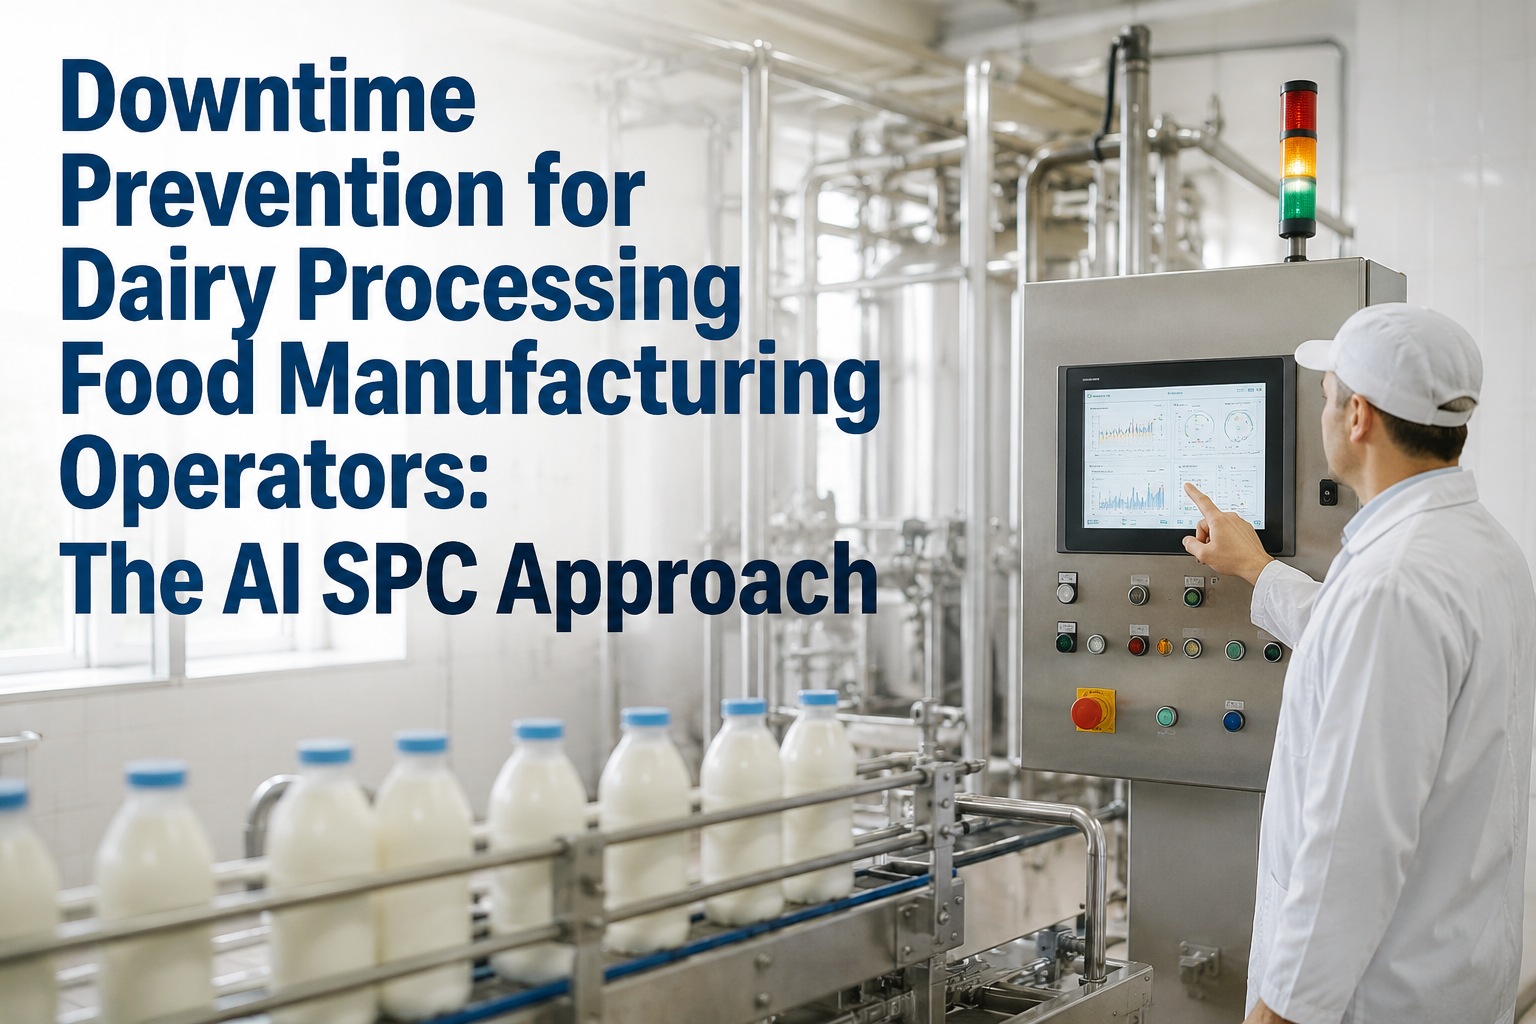
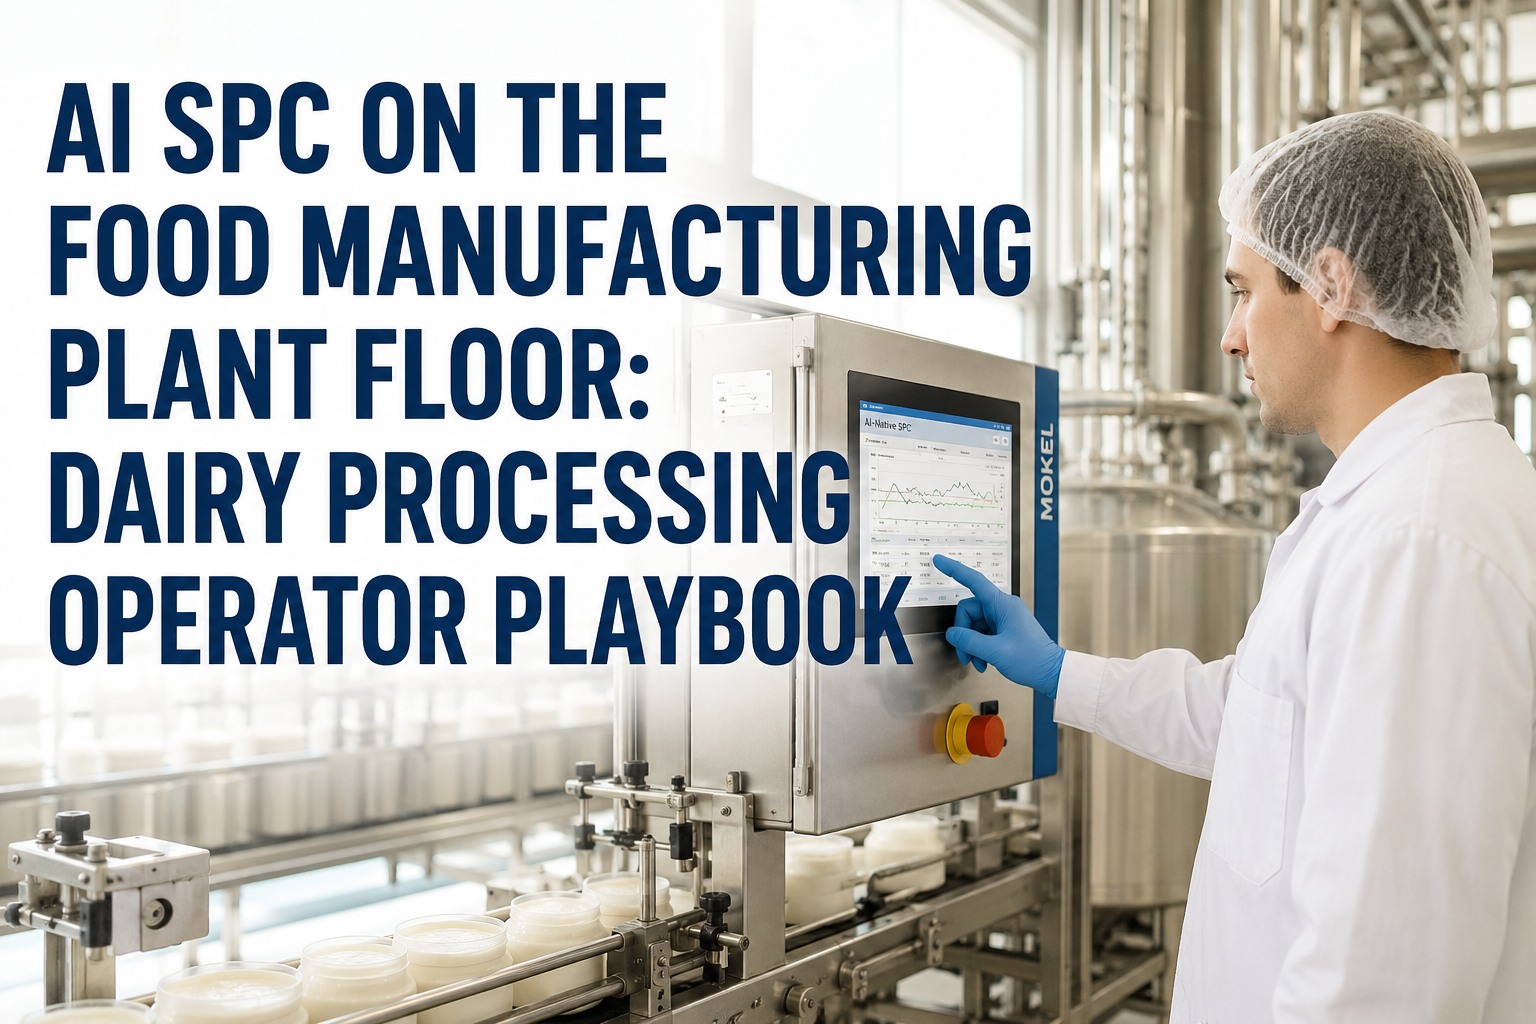
Every dairy operator knows the defects that keep coming back: syneresis on the yogurt line, grainy texture on the cottage cheese, off-flavors on the sour cream, fat separation on the cream products. The complaint log reads like the same story month after month because the root causes never get fixed — they get worked around. AI-native SPC changes that by catching the upstream drift that creates each recurring defect, automating Western Electric and Nelson rule detection across every CCP, and integrating CIP skid performance with downstream process data. Plants running AI-native SPC report 40–60% reductions in customer complaints within the first two quarters of deployment. Book a demo with us to walk through your top three recurring defects and see how AI SPC eliminates the root causes.
Defect Elimination for Dairy Operators
Cut Customer Complaints 40–60% on the Lines You Run
AI-native SPC catches the upstream drift that creates recurring defects — syneresis, grainy texture, off-flavors, fat separation. Western Electric and Nelson rules automated. CIP skid integrated with pasteurizer and fermentation data. Deployed in 6–12 weeks on your existing PLC/SCADA.
40–60%customer complaint reduction (2 quarters)
6 defectsrecurring dairy defects covered
6–12 wkdeployment to live monitoring
Complaint Trend · Yogurt Line
−52% vs baseline
Before
Transition
Stable AI SPC
The 6 Recurring Defects That Show Up on Every Dairy Complaint Log
Talk to any quality manager at a dairy plant and they’ll name the same six defects that keep coming back: syneresis, grainy texture, off-flavors, fat separation, over-acidification, and weak gel body. The defects aren’t mysterious — the root causes are well-known. What’s broken is the connection between upstream process drift and downstream defect occurrence. Operators see the defect on the line or in the warehouse return, but the drift that caused it happened hours or days earlier in equipment they’re not actively watching. AI-native SPC closes that loop.
Defect 01
Syneresis / Wheying Off
Yogurt, sour cream, cream cheese
Root causes
Total solids too low
Protein-fat ratio off
Homogenization pressure low
Fermentation temperature drift
Defect 02
Grainy / Gritty Texture
Yogurt, cottage cheese
Root causes
Fermentation temperature too high
Protein denaturation issues
Heat treatment variability
Culture activity inconsistency
Defect 03
Off-Flavors (Oxidized, Rancid, Bitter)
All dairy products
Root causes
Incoming milk freshness variance
CIP residue contamination
Over-pasteurization
Wrong culture or culture activity
Defect 04
Fat Separation / Cream Layer
Milk, cream, fluid dairy
Root causes
Homogenization pressure inadequate
Standardization fat % drift
Separator bowl speed variance
Storage temperature excursion
Defect 05
Over-Acidification / Sour Off-Flavor
Yogurt, cultured products
Root causes
Fermentation temperature elevated
Cooling cycle delayed/inadequate
Culture inoculation level off
Hold time at fermentation excess
Defect 06
Weak Gel / Poor Body
Yogurt, set cheese
Root causes
Protein content too low (incoming)
Fermentation temperature too low
Heat treatment insufficient
Culture activity below spec
Where Defects Originate — Process Map of Root Cause Sources
Every recurring defect traces back to one or more upstream process variables. Mapping the equipment that creates each defect lets operators monitor the right parameters with the right thresholds. AI-native SPC connects this map to live data, so when one of the root-cause variables drifts, the operator gets a plain-language alert naming the downstream defect risk — not just “temperature high” on an HMI tag.
01
Raw Milk Receiving
Fat %
Protein %
SCC
Plate Count
Defects affected: 03, 04, 06
→
02
CIP Skid
Caustic Conc
Acid Conc
Rinse Temp
Cycle Time
Defects affected: 03 (off-flavors)
→
03
Standardization
Fat Target
Protein Target
Total Solids
SNF
Defects affected: 01, 04, 06
→
04
Pasteurization (HTST)
Temperature
Hold Time
Flow Rate
Diff Pressure
Defects affected: 02, 03, 06
→
05
Homogenization
Pressure Stage 1
Pressure Stage 2
Temperature
Defects affected: 01, 04
→
06
Fermentation
Temp Profile
Time Profile
pH Curve
Culture Activity
Defects affected: 01, 02, 05, 06
Want this process map applied to your specific lines and complaint history? Book a demo with us — we’ll walk through your top three recurring defects and trace each one to its upstream process source.
Western Electric Rules & Nelson Rules — Pattern Detection Automated
Western Electric Rules (1956, Bell Labs) and the expanded Nelson Rules (1984) are the standard frameworks for detecting non-random patterns in SPC charts — the early warning signs that a process is drifting toward defects before any single value crosses a control limit. The problem: operators can’t scan all 8 Western Electric Rules and all 8 Nelson Rules across every chart in real time. Pattern detection gets done in retrospective review — after defects have already occurred. AI-native SPC automates both rule sets across every chart, every second, with plain-language alerts when a pattern triggers.
Rule 01
Single point beyond 3σ
Most basic out-of-control signal. Static SPC handles this. AI adds context: which root-cause variable, which downstream defect risk.
Rule 02
9 points one side of center line
Process mean has shifted. Often missed by operators because no single point looks alarming. AI detects continuously and explains the shift.
Rule 03
6 points trending up or down
Sustained drift signal. Critical early warning before defects appear. AI catches this across multiple variables simultaneously.
Rule 04
14 points alternating up/down
Oscillation pattern. Often indicates control loop instability or sampling/measurement issue. AI flags with diagnostic suggestion.
Rule 05
2 of 3 points beyond 2σ (same side)
Process variance shifting outside normal range. AI cross-references with related variables to identify likely cause.
Rule 06
4 of 5 points beyond 1σ (same side)
Process shifting toward one side. Common in cultured product fermentation when temperature setpoint drifts.
Rule 07
15 points within 1σ of center
Stratification or reduced variability. Often signals sensor freezing or measurement artifact rather than improved process.
Rule 08
8 points outside 1σ (either side)
Bimodal distribution or process mixing. AI flags with hypothesis about contributing variables for operator investigation.
CIP Skid — The Hidden Defect Source Operators Rarely See
CIP (Clean-in-Place) skid performance is the single most under-monitored source of dairy defects. CIP cycles run between every batch — if caustic concentration, rinse temperature, or cycle time drifts, contamination carries through to the next batch. The defect shows up hours or days later as off-flavors, premature spoilage, or biofilm-related issues, and the operator running the affected batch has no visibility into what happened in the CIP cycle that preceded it. AI-native SPC integrates CIP skid data with downstream process SPC so the connection becomes visible.
Pre-Rinse
Rinse Temp38–43°C
Duration3–5 min
Flow RateMin velocity
Caustic Wash
NaOH Conc1.0–2.0%
Temperature75–85°C
Contact Time15–30 min
Intermediate Rinse
Rinse Conductivity< 50 µS/cm
Duration5–10 min
Drain VerificationComplete
Acid Wash
HNO₃ Conc0.5–1.0%
Temperature60–70°C
Contact Time10–20 min
Final Rinse
Water QualityPotable
Conductivity< 30 µS/cm
Duration3–5 min
Sanitization
Sanitizer ConcPer chemical
Contact TimeMin validated
ATP VerificationPass threshold
Connect CIP Performance to Downstream Defects
AI-native SPC integrates CIP skid data with batch-by-batch process SPC. When a CIP cycle drifts on caustic concentration or rinse conductivity, the AI flags the risk of downstream contamination on the next batch — before the defect appears on the complaint log.
Fat & Protein Control — The Yogurt Manufacturing Lever
Yogurt defects concentrate on two variables: fat content and protein content (and their ratio). Standardization that hits the fat target but misses protein produces syneresis. Standardization that hits protein but runs fat low produces weak body. Standardization that hits both but inconsistent total solids produces grainy texture. AI-native SPC tracks the fat-protein control loop continuously, including incoming milk variability, standardization output, and downstream impact on yogurt texture and shelf-life metrics.
Fat ON target
Protein ON target
Target texture, body, shelf life
Fat ON target
Protein LOW
Weak gel body, syneresis
Fat LOW
Protein ON target
Reduced mouthfeel, fat-replacement off-notes
Fat HIGH
Protein LOW
Fat separation + weak body (worst case)
AI-Native Fat/Protein Loop
iFactory’s AI SPC tracks the fat-protein relationship continuously, predicting standardization adjustments needed to hit both targets simultaneously based on incoming milk composition. Operators see live recommendations when incoming variability requires standardization recipe adjustment — before the batch enters the line.
How 40–60% Complaint Reduction Breaks Down
The 40–60% complaint reduction target across two quarters isn’t marketing math — it’s a documented breakdown of where the savings come from. Different defects respond differently to AI-native SPC: some get caught by adaptive limits, some by pattern detection, some by CIP integration, some by fat-protein control loop integration. The aggregate hits 40–60% when all four mechanisms run in production for two full quarters with continuous learning.
Mechanism 01
Adaptive limits catch upstream drift
15–20%
Process drift caught before defect occurs. Most impact on pasteurization-related and fermentation-temperature defects.
Mechanism 02
Western Electric & Nelson rules automated
10–15%
Pattern detection across all charts catches drift signatures operators miss in real time. Targets gradual shift defects.
Mechanism 03
CIP skid integration with process SPC
10–15%
Connects CIP cycle quality to downstream batch quality. Eliminates contamination-driven off-flavor and spoilage complaints.
Mechanism 04
Fat/protein control loop integration
5–10%
Yogurt-specific. Texture and body defects from standardization drift reduce sharply when fat-protein loop is continuously tuned.
6–12 Week Deployment — Same Timeline, Defect-Elimination Focus
AI-native SPC deployment runs 6–12 weeks from kickoff to live operator monitoring. For defect-elimination outcomes specifically, the deployment focuses on connecting upstream process variables to documented historical defect patterns — so the AI starts catching root causes for your specific recurring complaints from week 7 onward, not waiting for a generic model to learn from scratch.
Week 1–2
Defect History Analysis
Customer complaint log reviewed for recurring defects
Defect-to-process variable mapping documented
Pre-configured AI server installed in plant network
PLC/SCADA/historian tag mapping completed
Week 3–6
Model Tuning to Your Defects
AI runs in shadow mode alongside existing SPC
Pattern detection validated against historical defect events
CIP skid integration with downstream batch data
Fat/protein control loop calibrated to your standardization recipes
Week 7–12
Live Defect Prevention
Operators transition to AI SPC primary view
Recurring defects begin trending down in week 8–10
CAPA workflows linked to AI alerts for closed-loop learning
First quarterly complaint trend review baseline established
Expert Perspective
"The reason dairy plants see the same six defects recur is not that operators don’t know the root causes — they often do. The problem is the disconnection between upstream process drift and downstream defect occurrence. Syneresis on the yogurt line traces back to a homogenization pressure variance or fermentation temperature drift that happened hours earlier. Off-flavors on the sour cream trace back to a CIP caustic concentration that ran low two cycles ago. The defects appear at the end of the line; the root causes happen at the beginning. Traditional SPC monitors each variable independently and alarms only when it crosses a hard limit. AI-native SPC monitors patterns across variables and connects them to documented defect outcomes. The 40–60% complaint reduction across two quarters is what happens when this connection becomes visible to operators in real time. The plants that hit the higher end of that range (closer to 60%) are the ones that integrate CIP skid data — because CIP-driven contamination defects are usually the most preventable and most frequently missed by traditional monitoring approaches."
— Dairy Quality Practice, 2026 industry perspective
40–60%
customer complaint reduction in two quarters
8 + 8
Western Electric + Nelson rules automated
6 defects
recurring dairy defects covered out-of-box
Walk Through Your Top 3 Recurring Defects
A demo session reviews your actual customer complaint log, traces each recurring defect to its upstream process source, and shows how AI-native SPC would catch the drift before the defect appears. 6–12 week deployment, no PLC/SCADA replacement required.
Frequently Asked Questions
How realistic is 40–60% complaint reduction for our plant specifically?
The 40–60% range is documented across dairy plants that complete the full 6–12 week deployment and run AI-native SPC for at least two quarters. Plants at the lower end (closer to 40%) typically deploy without CIP skid integration or without fat/protein loop tuning. Plants at the higher end (closer to 60%) deploy all four mechanisms together. Your plant’s specific outcome depends on your current complaint baseline (plants with high baselines have more room for reduction), which defects dominate your complaint log (CIP-related defects respond especially well), and how integrated your CIP skid data currently is. The demo session reviews your specific complaint log and projects a realistic range for your environment before any deployment commitment.
What about defects that don’t show in our process data at all?
Some defects originate outside the monitored process — supplier ingredient issues, packaging defects, transport temperature excursions. AI-native SPC won’t catch those because they’re not in the data stream. The 40–60% complaint reduction target applies to process-driven defects, which typically represent 70–85% of recurring dairy complaints. Non-process defects (5–15% of complaint volume) require different controls: supplier quality management, packaging inspection, cold-chain monitoring. iFactory’s practice integrates with supplier quality and cold-chain systems where available, but the AI SPC value is concentrated on the process-driven defect categories. The demo walks through your complaint log to confirm what percentage is addressable by AI SPC vs other interventions.
How does this work with our existing SAP QM or quality management system?
AI-native SPC complements SAP QM or any quality management system rather than replacing it. The integration runs both directions: SAP QM provides batch specifications, inspection plans, and CAPA workflows that AI SPC respects; AI SPC feeds early-warning signals into SAP QM as preventive control records under FSMA 21 CFR 117 Subpart C. When a defect would have occurred, AI SPC’s pattern detection creates a documented record of the intervention — useful for both quality engineering and regulatory documentation. CAPA workflows in SAP QM get richer because the AI provides hypothesis-level root cause data, not just symptom records. For plants on Rockwell PharmaSuite, ETQ, or other QMS platforms, the integration approach is similar — AI SPC as the predictive layer, QMS as the system of record.
What if our operators don’t trust the AI alerts?
Operator trust builds during the shadow-mode phase (weeks 3–6) when AI runs alongside existing SPC without operators acting on AI alerts yet. Operators see the AI flag patterns and can validate against what they observe in practice. By week 7, most operators trust the AI on the patterns they’ve seen it catch correctly; remaining skepticism gets resolved over the next 4–8 weeks of live operation as the AI catches drift the legacy system missed. Plain-language alert content matters here — alerts that explain the pattern, name the recommended action, and reference the downstream defect risk build trust faster than alerts that just say “anomaly detected.” The continuous learning mechanism also matters: when an operator marks an alert as “not actionable,” that feedback tunes the model and reduces similar future alerts. Operator trust is built through alert quality over time, not assumed at deployment.
How is recurring defect prevention different from reactive defect investigation?
Reactive defect investigation happens after a customer complaint, retail return, or in-plant quality failure. Investigation reviews logs, interviews operators, and traces backwards to find the root cause — usually weeks after the fact. The investigation may identify the cause but rarely prevents the next occurrence because the underlying drift pattern isn’t being monitored continuously. Recurring defect prevention is forward-looking: AI SPC monitors the process variables associated with each defect class continuously, alerts when drift patterns emerge, and recommends operator action before the defect occurs. The shift in operations is from “respond to complaints” to “prevent the drift that creates complaints.” Plants that make this shift typically see CAPA workflows evolve from primarily corrective to primarily preventive, which is the FSMA 21 CFR 117 Subpart C orientation regulators now expect.
Can we measure complaint reduction reliably with this much variability in our complaint log?
Reliable measurement requires a stable baseline window and consistent complaint categorization. iFactory’s deployment includes complaint baseline analysis in weeks 1–2 that establishes the pre-deployment complaint rate by category. Post-deployment measurement uses the same categorization to ensure apples-to-apples comparison. Two-quarter measurement windows smooth out month-to-month variation. Plants with high noise in their complaint logs (small sample sizes, inconsistent categorization, seasonal demand variation) may need longer measurement windows or focus on specific defect categories rather than total complaint volume. The demo session reviews your complaint log structure to confirm reliable measurement is achievable before deployment commitment.