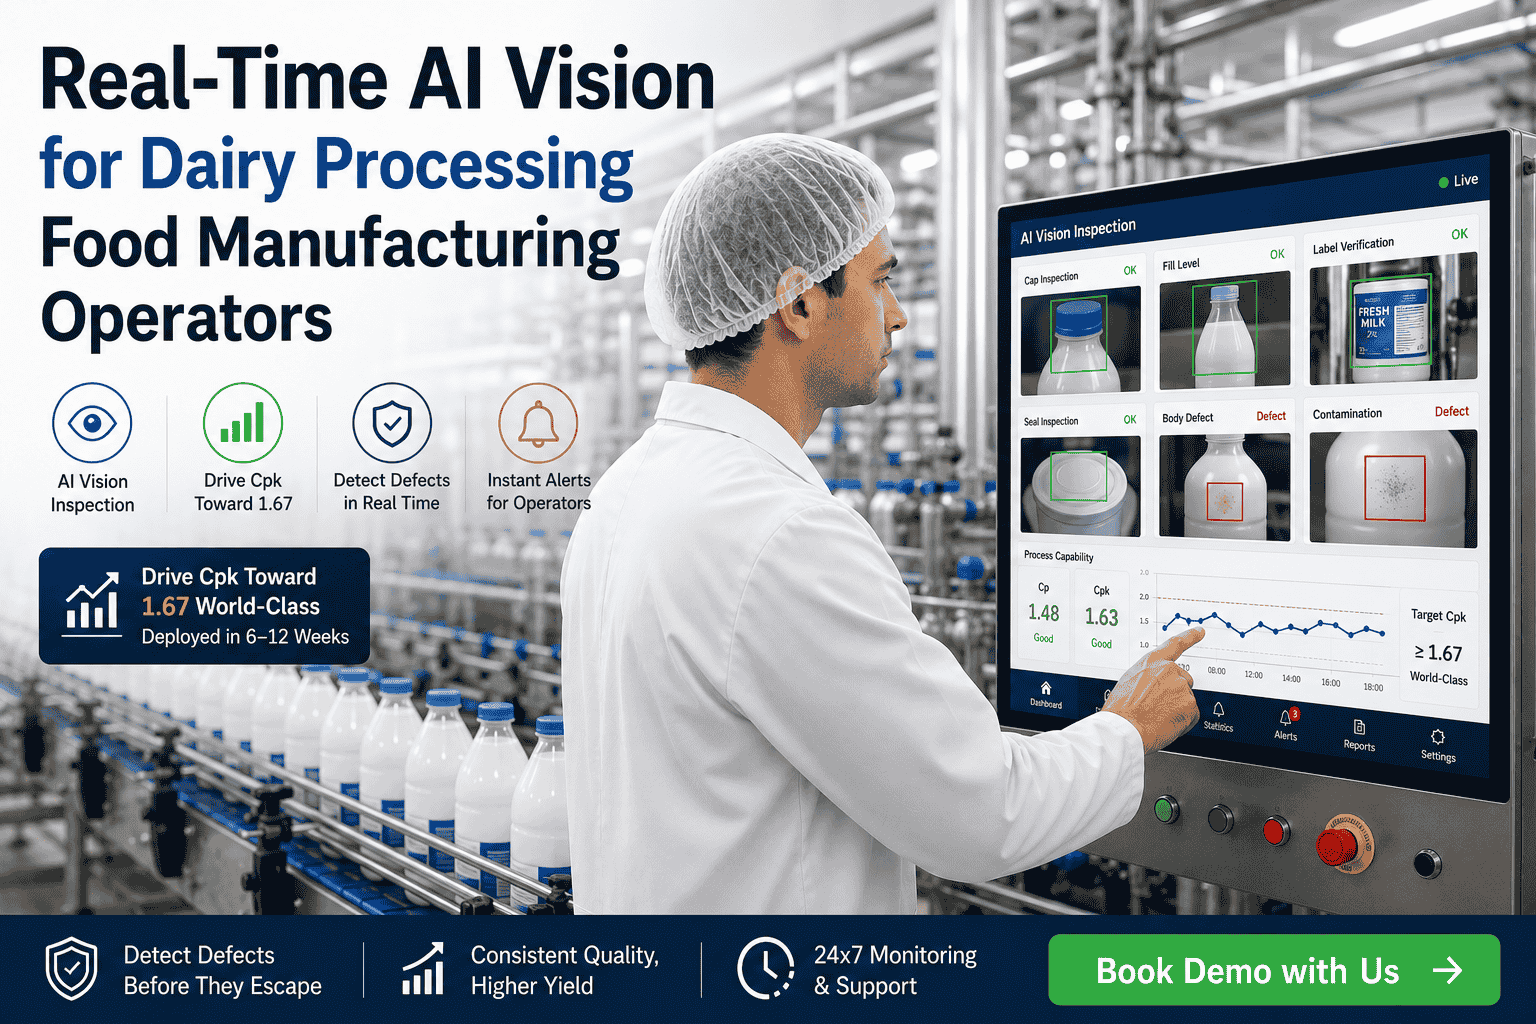
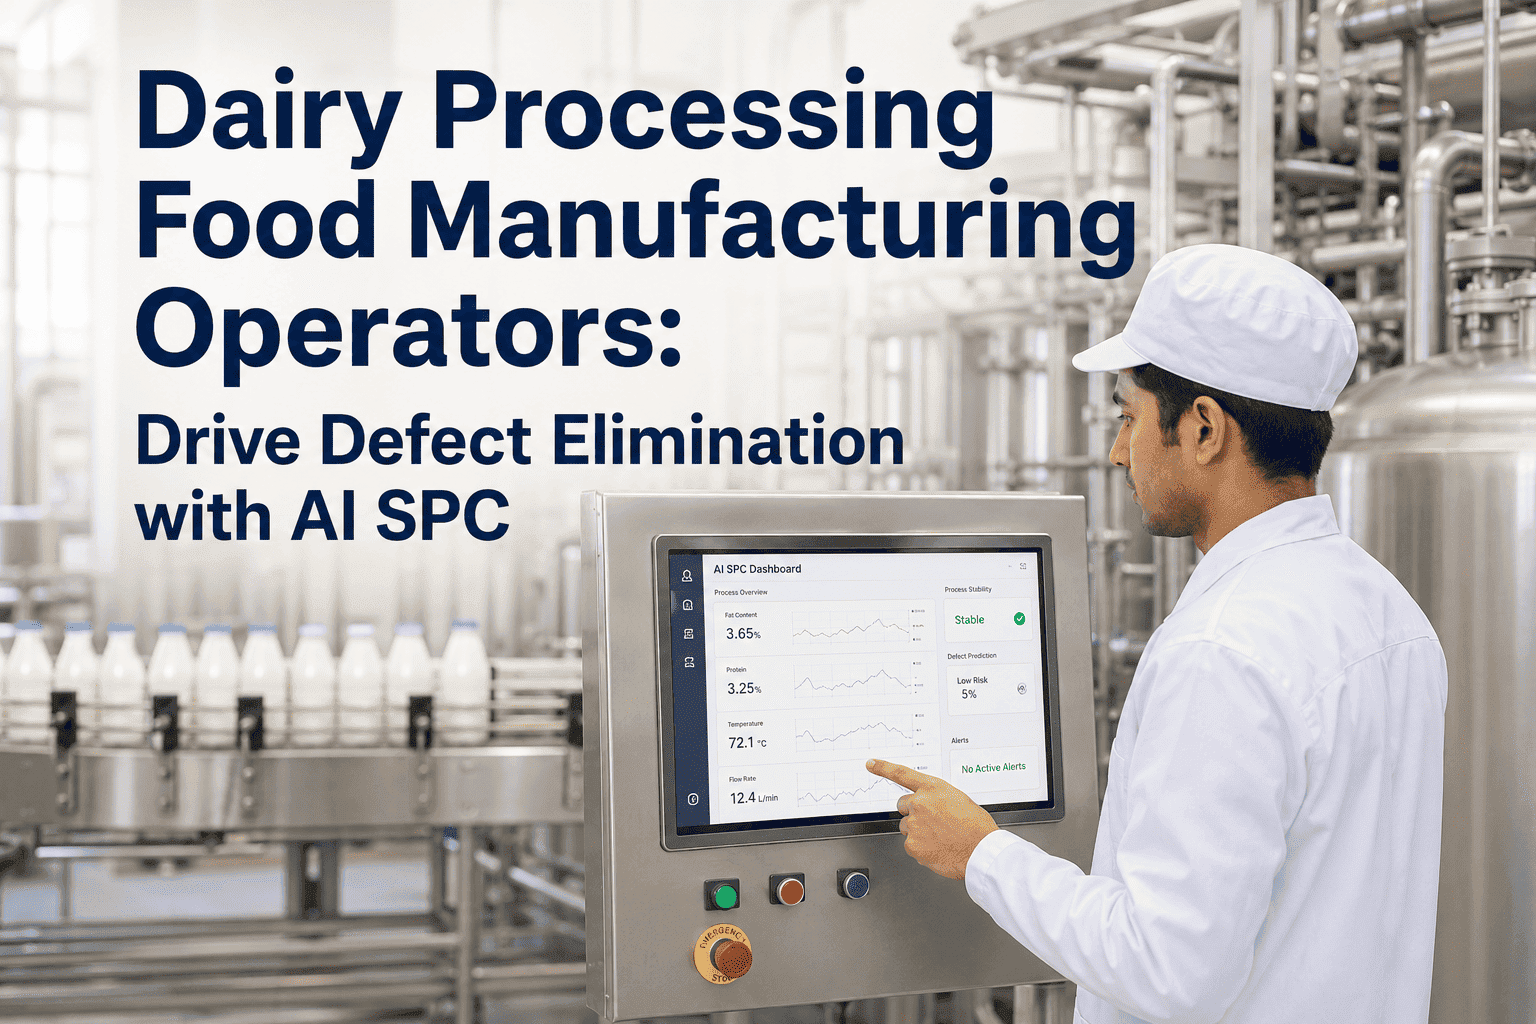
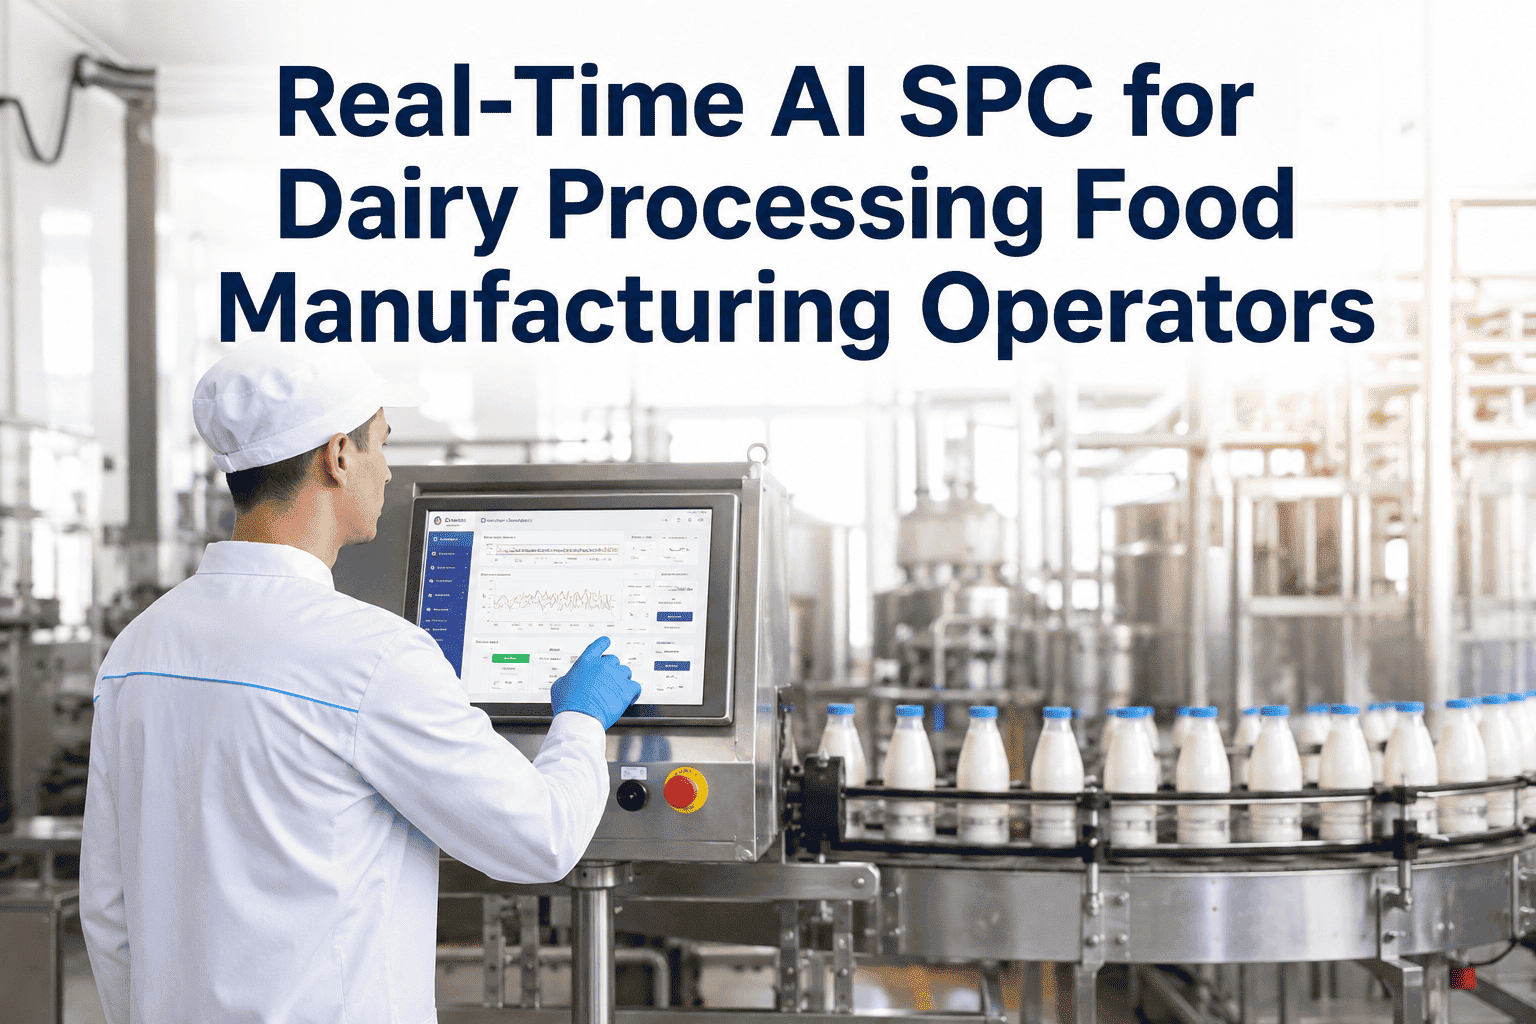
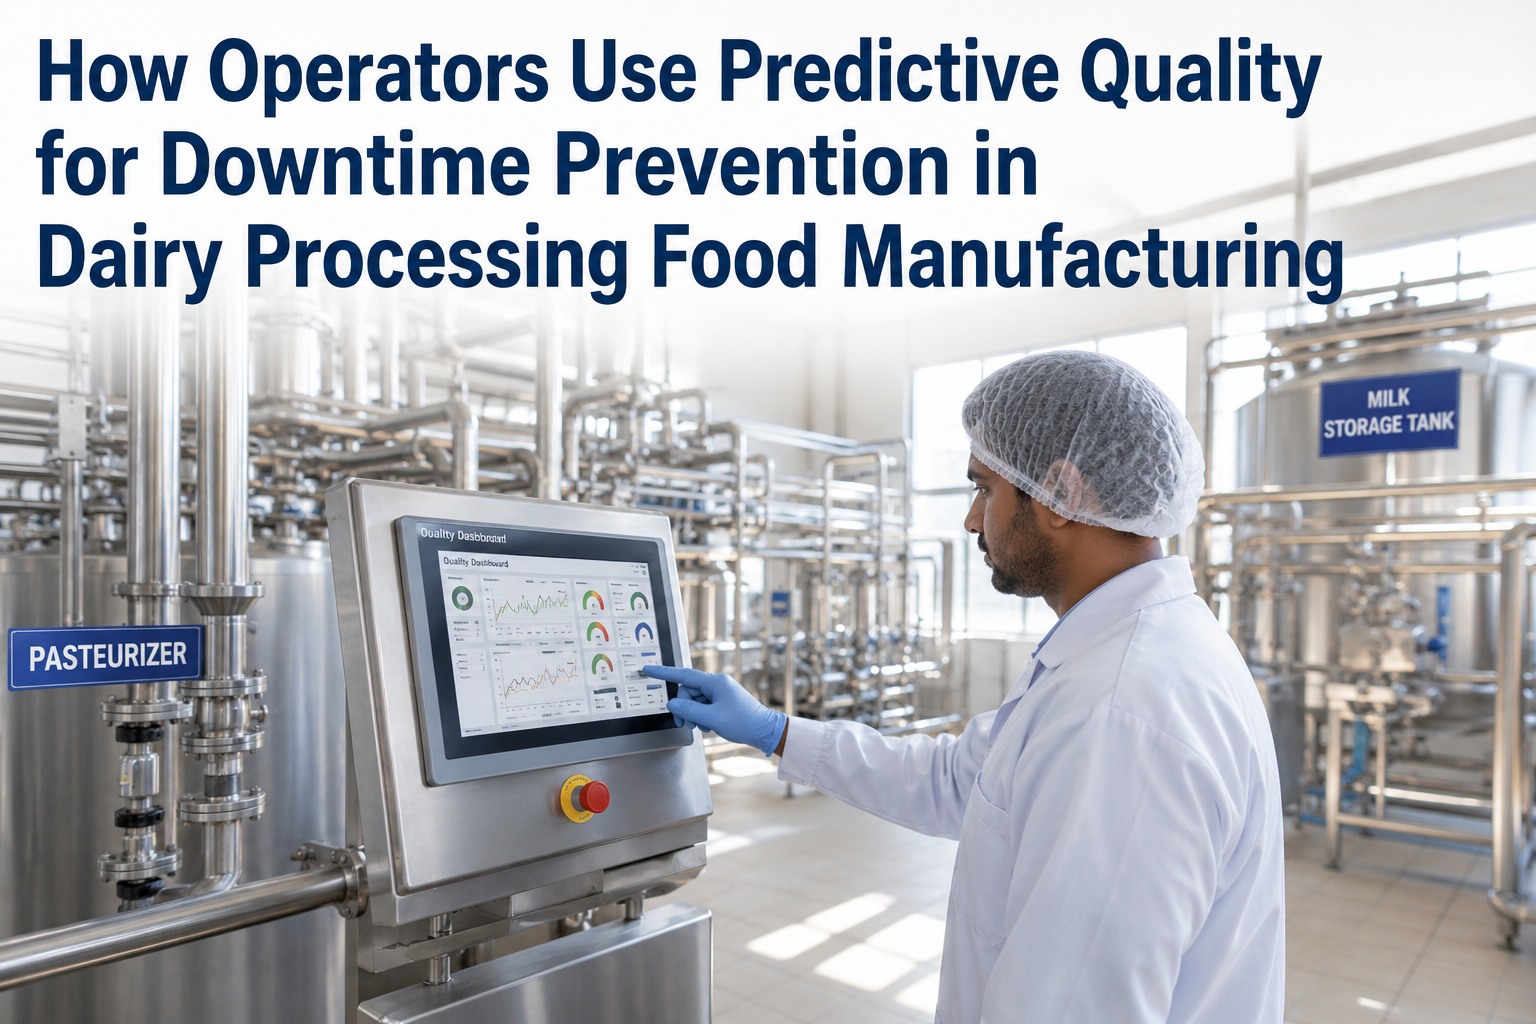
Real-Time AI Vision for Dairy Processing Food Manufacturing Operators
By Riley Quinn on May 26, 2026
A yogurt cup moves down the filler line at 4 cups per second. The operator has 250 milliseconds to look at each one before it disappears into the case packer. Multiply that across 8 hours, 3 shifts, 7 days, and you reach roughly 7 million cups a week per line. The human eye cannot inspect that many containers at that speed without missing things — that’s not a criticism of operators, it’s an honest accounting of biology. Skewed labels, missing caps, fill level drift, foreign body contamination, foil seal wrinkles, date code misprints, embossing defects on plastic cups — every one of these gets past the human inspector eventually. AI vision inspection catches every single container at line speed, every defect category in parallel, every shift, every day. Done right, it’s the difference between a Cpk of 1.18 and a Cpk of 1.67 on packaging quality — the difference between “capable” and “world-class.” This guide walks an operator through what real-time AI vision actually sees on a dairy line, how it integrates with existing fillers and capper stations, and what shifts the day vision goes live. Book a demo with us to see AI vision running on your line’s output.
Real-Time AI Vision · Dairy Inspection
7 Cameras · 1 Operator HMI · Zero Missed Defects
Every cup, bottle, carton, and pouch inspected at line speed across seven defect categories simultaneously.
CAM 01
Fill level
Pass · 99.7%
CAM 02
Foil seal
Pass · 99.9%
CAM 03
Label skew
Alert · 96.2%
CAM 04
Cap presence
Pass · 100.0%
CAM 05
Date code
Pass · 99.8%
CAM 06
Container body
Pass · 99.6%
CAM 07
Case-pack count
Pass · 100.0%
All cameras feed the same inference engine. All findings flow to the same operator HMI. All evidence stamps to the same audit trail.
The Seven Defect Categories Vision Catches at Line Speed
Every dairy packaging line carries the same seven defect categories. Each one moves at different speeds, hides in different places, and costs the plant differently when it ships. AI vision doesn’t prioritize between them — it inspects all seven on every container in parallel. Knowing what each category looks like is how operators read the dashboard the day vision goes live.
01
Fill Level Variance
Detection rate: 99.6%
Under-fills cost giveaway compliance. Over-fills cost product. Vision measures meniscus height to sub-millimeter accuracy on every cup, bottle, and carton at line speed.
Inspected per second4–12 units
02
Foil Seal Integrity
Detection rate: 99.9%
Wrinkles, partial seals, contamination under the foil, and induction-seal misalignment all cause downstream shelf-life failure. Vision catches each pattern type with deep-learning classifiers.
Defect patterns trained12+ classes
03
Label Skew & Placement
Detection rate: 99.8%
Rotational misalignment, vertical offset, peeling corners, double-labels, wrong-SKU labels. Even 2 degrees of skew is visible to customers and visible to vision.
Detection threshold±0.5° skew
04
Cap Presence & Torque
Detection rate: 100.0%
Missing caps, cocked caps, partially threaded caps, wrong-color caps. The simplest defect category and the highest customer-complaint generator when missed.
False positive rate< 0.01%
05
Date Code & Lot Print
Detection rate: 99.8%
Missing codes, smeared codes, wrong dates, illegible characters. OCR-grade vision reads what humans squint at — on every container, regardless of orientation or print quality.
OCR confidence floor97%+
06
Container Body Defects
Detection rate: 99.5%
Cracks in plastic cups, dents in cartons, scuffs on PET bottles, embossing failures, mold flash. The defects that ship past visual inspection 1 in every 5,000 containers.
Min defect size0.5 mm
07
Case-Pack Count & Pattern
Detection rate: 100.0%
Missing units in a case, wrong pack pattern, mixed-SKU contamination. The last-line defense before product leaves the plant — and the most expensive defect to miss.
Cases per minuteup to 60
Want your line’s top 3 recurring defect categories mapped to a vision deployment plan? Book a defect assessment with our dairy vision team.
What Humans Miss vs What Vision Catches — The Honest Comparison
This isn’t about replacing operators. It’s about giving operators a second pair of eyes that doesn’t blink, doesn’t fatigue, doesn’t look away at the wrong moment. The honest comparison shows where each excels — and why the combination outperforms either alone.
Swipe horizontally to compare human vs AI vision
Inspection capability
Human operator
AI vision system
Inspection rate
~1 per second sustained · degrades over shift
12+ per second sustained 24/7 across all cameras
Fatigue effect
Miss rate climbs 4–8 hours into shift
No fatigue · identical performance hour 1 and hour 8
Defect categories in parallel
1–2 simultaneously realistically
7+ categories on every container in parallel
Sub-millimeter defects
Hard to spot at line speed
0.5mm cracks and 0.5° label skew detected reliably
Edge-case judgment
Strong · pattern recognition for novel issues
Flags ambiguous units for human review
Audit evidence trail
Verbal handoff + paper log entries
Image-stamped, time-stamped, GFSI-ready records
Best use
Edge cases + AI flag review + line-stop decisions
Continuous inspection across all categories at line speed
How the System Sees What It Sees — The Inference Pipeline
Real-time AI vision isn’t just “a camera with software.” It’s a four-stage pipeline that takes each frame from each camera and turns it into a verdict on the operator HMI within sub-second latency. Knowing the pipeline helps operators understand what the platform is doing when the alert fires.
01
Capture
Industrial cameras at 60–120 fps capture each container as it passes the inspection zone. LED strobes synchronize to motion to eliminate blur at line speed.
60–120 fps · GigE Vision
02
Inference
Deep-learning models (YOLOv8, CNN-based classifiers) run on the edge AI server. Each frame gets a defect classification with confidence score in under 50 ms.
< 50ms latency · edge GPU
03
Decision
Pass / Reject / Review decision tagged to the container. Pass continues to packaging. Reject triggers reject mechanism. Review queues for operator inspection.
3 states · configurable thresholds
04
Record
Image, timestamp, decision, confidence score, lot/SKU metadata logged to the audit trail. Every rejected unit becomes a GFSI-ready evidence package.
21 CFR Part 11 · GFSI ready
Drive Packaging Cpk to 1.67 in 6–12 Weeks
iFactory ships a pre-configured AI vision server with 7 inspection categories tuned for dairy — cups, bottles, cartons, foil-sealed packs. Integrates with existing fillers, cappers, labelers via standard industrial protocols. First validated rejections within 4–6 weeks of go-live.
The Cpk Lift Story — Where AI Vision Actually Moves the Number
Packaging Cpk lives or dies on consistency. Most dairy plants run packaging at Cpk 1.0–1.2 not because the equipment is incapable but because intermittent defects bleed past the human inspector. AI vision removes those intermittents structurally. The Cpk number climbs because the underlying defect rate falls — visibly, week over week.
What Operators Actually Do Differently — Day One of Vision Go-Live
The change isn’t that operators stop inspecting. It’s that inspection becomes a different kind of work. Five concrete shifts happen the first week of vision go-live — each one removes a familiar source of stress and adds a familiar source of confidence.
01
Eyes on edge cases, not every container
Operators stop watching every cup go by and start reviewing the 0.5% that vision flags as ambiguous. The visual workload drops while the value of the work climbs.
02
Reject reasons arrive pre-classified
No more guessing why a unit is suspicious. The HMI shows the defect category, the confidence score, and the image evidence so the operator confirms or overrides in seconds.
03
Filler upstream tuning becomes possible
Vision sees fill drift on every container, so the operator catches filler nozzle wear days before it produces visible defects. The line tunes itself with real data.
04
Audit recordkeeping disappears as a task
Every rejected unit auto-logs with image and timestamp. The operator stops writing in the inspection logbook — the platform writes it better, faster, immutably.
05
Customer complaint week stops feeling like crisis
When a complaint arrives, the operator pulls the image evidence in seconds rather than reconstructing what happened from memory. Investigation becomes lookup.
Expert Perspective
"The gap between Cpk 1.2 and Cpk 1.67 on a dairy packaging line is almost never about the filler equipment itself — it’s about the inspection layer between the filler and the case packer. Human inspectors at line speed are a structural ceiling on Cpk because biological limits set the maximum sustainable inspection rate. AI vision removes that ceiling. Deep-learning classifiers running on edge GPUs catch every container at every camera every shift — the same performance hour one and hour eight, the same performance Monday and Friday, the same performance under operator shift change. That’s how Cpk 1.05 becomes Cpk 1.67 within a single quarter without changing a single piece of filling equipment."
— Dairy Manufacturing Vision Practice, 2026 industry insight
~0.6 ppm
defect rate at Cpk 1.67 world-class capability
< 50ms
inference latency per frame on edge GPU
7+ classes
defect categories inspected in parallel
Conclusion: The Inspection Layer That Was Always the Bottleneck
Dairy packaging Cpk has lived in the 1.0–1.2 range for decades not because equipment couldn’t deliver better, but because the inspection layer between equipment and customer was the structural ceiling. Human inspectors at line speed are limited by biology — not skill, not training, not effort. AI vision removes that ceiling. Seven cameras inspecting every container at every defect category in parallel, every shift, every day, at line speed, with the same performance from minute one to minute four-hundred-eighty. The Cpk number climbs from marginal to world-class. The customer complaints diminish to near-zero. The recall exposure drops to a structural floor. The operators stop watching every cup and start handling the edge cases AI flags — higher-value work, lower fatigue, better outcomes. Book a demo with us to see real-time AI vision running on your line’s output.
Bring Real-Time AI Vision to Your Dairy Line
iFactory’s dairy vision practice deploys in 6–12 weeks against your existing fillers, cappers, and labelers. Seven inspection categories at line speed, integrated with your PLC and SCADA, 24x7 monitoring. Get a free 30-minute working session built around your top recurring defect category.
How fast can AI vision actually inspect a dairy packaging line?
Modern industrial vision systems running on edge GPUs inspect at 60–120 frames per second per camera with inference latency under 50 milliseconds per frame. A typical dairy filler running at 4–12 containers per second has plenty of capture headroom, and most lines deploy 5–7 cameras inspecting different defect categories in parallel across the same container. The bottleneck on most lines is not the vision system — it’s the existing reject mechanism downstream. iFactory’s vision deployment includes tuning the reject actuator timing to match the AI inference window so no flagged container slips past the rejection point.
What defect categories does AI vision typically catch on dairy lines?
Seven categories cover the majority of dairy packaging defects: fill level variance (under/over-fills), foil seal integrity (wrinkles, partial seals, contamination under foil), label skew and placement (rotation, vertical offset, peeling, double-labels), cap presence and torque (missing, cocked, partially threaded, wrong color), date code and lot print legibility (smeared, missing, wrong dates), container body defects (cracks, dents, scuffs, embossing failures, mold flash), and case-pack count and pattern (missing units, mixed-SKU contamination). Most deployments start with the top 3 recurring defect categories from the plant’s customer complaint data and expand to the full seven over the 8–12 week deployment window.
Does this replace human operators on the inspection station?
No. The operator’s job changes from continuous inspection of every container to reviewing the 0.3–0.8% of containers that AI flags as ambiguous, plus handling edge-case judgment calls the AI hasn’t seen before. The visual workload drops while the value of the work climbs. Operators who used to stare at the line for 8 hours now spend most of their time on more cognitively engaging work — pattern recognition on novel defects, upstream filler tuning informed by vision data, and audit-investigation lookups when a customer complaint arrives. Most plants report higher operator job satisfaction within the first quarter, not lower headcount.
How does AI vision specifically lift Cpk from 1.05 to 1.67?
Packaging Cpk is determined by the defect rate at the customer end of the line. When defect rate falls, Cpk climbs — the math is mechanical. Human inspection at line speed lets through roughly 1 in every 350 defects (about 2,800 ppm) due to biological limits on sustained attention. AI vision lets through roughly 1 in every 1.7 million defects (about 0.6 ppm) because the system doesn’t fatigue, doesn’t look away, and inspects every defect category on every container in parallel. The Cpk improvement from 1.05 to 1.67 is structurally inevitable when the defect rate falls by three orders of magnitude. Plants typically see the climb happen progressively over the first 8–12 weeks of deployment as confidence thresholds tune.
How does deployment work alongside existing fillers, cappers, and labelers?
iFactory’s vision platform sits above your existing packaging equipment, not in place of it. Cameras mount at standard industrial positions adjacent to fillers, cappers, labelers, and case packers. The AI server reads camera feeds over GigE Vision, runs inference on the edge GPU, and pushes pass/reject/review decisions to your existing PLC and SCADA via standard industrial protocols (OPC UA, Modbus, EtherNet/IP). Your existing reject mechanisms continue to handle the physical rejection — vision just provides smarter, faster, more accurate decisions for them. Deployment runs 6–12 weeks: 2–3 weeks for camera installation and PLC integration, 4–6 weeks for model training on your specific products and defect patterns, 2–4 weeks for threshold tuning and operator workflow validation.